
The AD line gives another strong signal today, which offers good support to the Elliott wave count. The short term picture changes with this signal: the main and alternate hourly wave counts are again swapped over today.
Summary: The AD line has made another all time high, moving strongly higher today. The short term picture should be bullish. Corrections may be more brief and shallow than otherwise expected.
Pullbacks are an opportunity to join the trend.
The long to mid term Elliott wave target is at 2,922, and a classic analysis target is now at 3,045.
Always practice good risk management. Always trade with stops and invest only 1-5% of equity on any one trade.
New updates to this analysis are in bold.
The biggest picture, Grand Super Cycle analysis, is here.
Last historic analysis with monthly charts is here, video is here.
ELLIOTT WAVE COUNT
WEEKLY CHART
Click chart to enlarge.
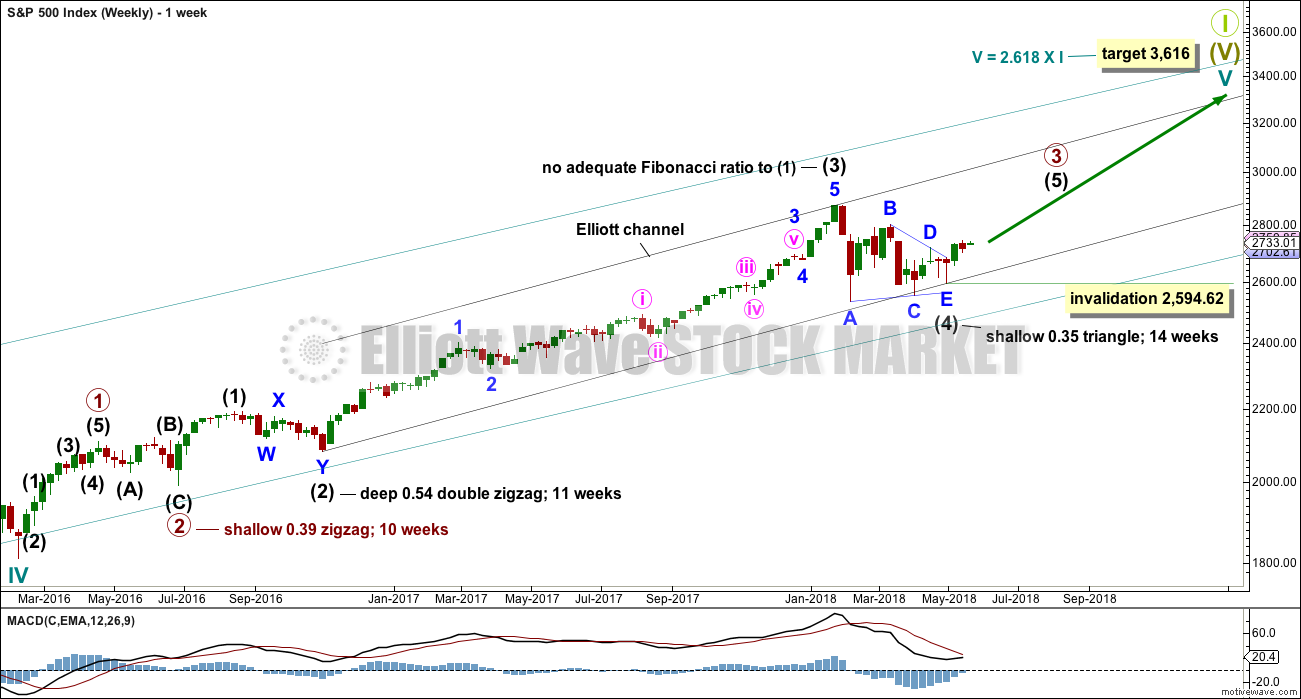
Cycle wave V must complete as a five structure, which should look clear at the weekly chart level. It may only be an impulse or ending diagonal. At this stage, it is clear it is an impulse.
Within cycle wave V, the third waves at all degrees may only subdivide as impulses.
Intermediate wave (4) has breached an Elliott channel drawn using Elliott’s first technique. The channel is redrawn using Elliott’s second technique: the first trend line from the ends of intermediate waves (2) to (4), then a parallel copy on the end of intermediate wave (3). Intermediate wave (5) may end either midway within the channel, or about the upper edge.
Intermediate wave (4) may now be a complete regular contracting triangle lasting fourteen weeks, one longer than a Fibonacci thirteen. There is perfect alternation and excellent proportion between intermediate waves (2) and (4).
If intermediate wave (4) were to continue further as either a flat or combination, both possibilities would require another deep pullback to end at or below 2,532.69. With both On Balance Volume and the AD line making new all time highs, that possibility looks extremely unlikely.
If intermediate wave (4) were to continue further, it would now be grossly disproportionate to intermediate wave (2). Both classic technical analysis and Elliott wave analysis now suggest these alternate ideas should be discarded based upon a very low probability.
Within intermediate wave (5), no second wave correction may move beyond the start of its first wave below 2,594.62.
DAILY CHART
Click chart to enlarge.
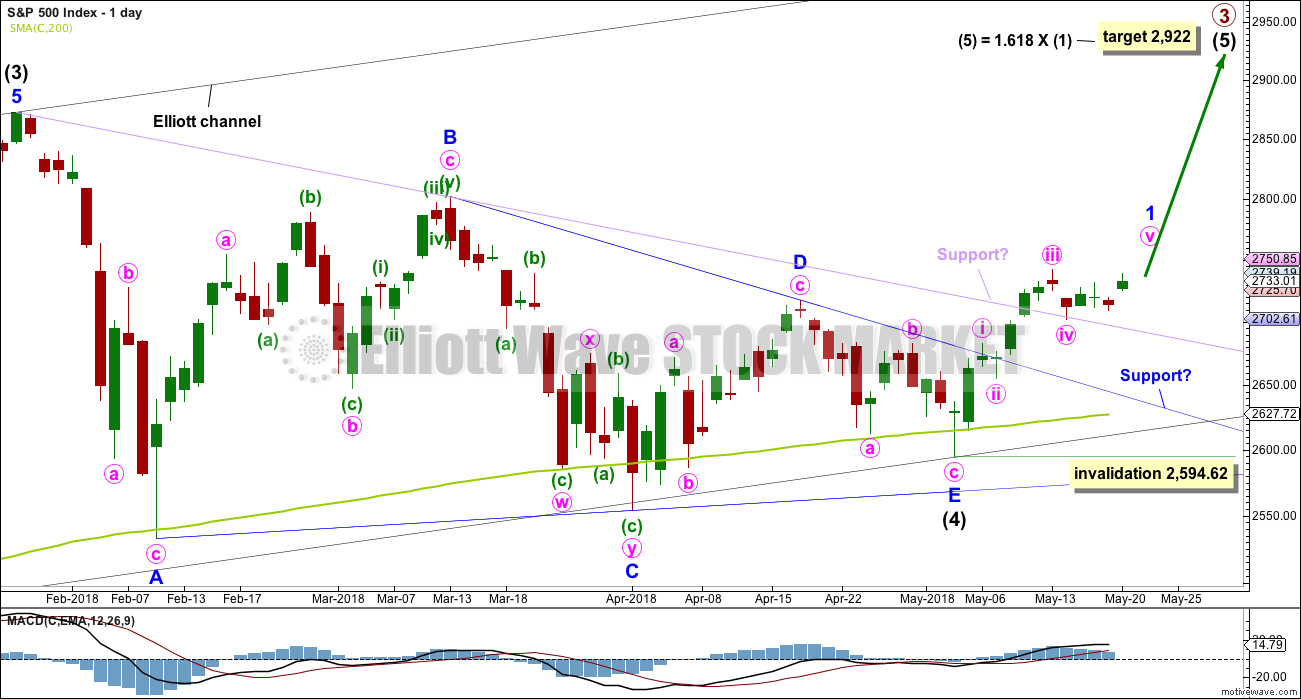
It is possible that intermediate wave (4) is a complete regular contracting triangle, the most common type of triangle. Minor wave E may have found support just below the 200 day moving average and ending reasonably short of the A-C trend line. This is the most common look for E waves of triangles.
Intermediate wave (3) exhibits no Fibonacci ratio to intermediate wave (1). It is more likely then that intermediate wave (5) may exhibit a Fibonacci ratio to either of intermediate waves (1) or (3). The most common Fibonacci ratio would be equality in length with intermediate wave (1), but in this instance that would expect a truncation. The next common Fibonacci ratio is used to calculate a target for intermediate wave (5) to end.
Price has clearly broken out above the upper triangle B-D trend line. This indicates that it should now be over if the triangle is correctly labelled.
A trend line in lilac is added to this chart. It is the same line as the upper edge of the symmetrical triangle on the daily technical analysis chart. Upwards movement has sliced cleanly through this line, finding no resistance before breaking it. This line may offer some support for any pullbacks. Price is finding support at that line so far. A breach of that line does not mean the classic triangle is invalid and that price must make new lows, only that the pullback is deeper. Look for next support at the blue Elliott wave triangle B-D trend line.
Sometimes the point at which the triangle trend lines cross over sees a trend change. A trend change at that point may be a minor one or a major one. That point is now about the 7th of June.
HOURLY CHART
Click chart to enlarge.
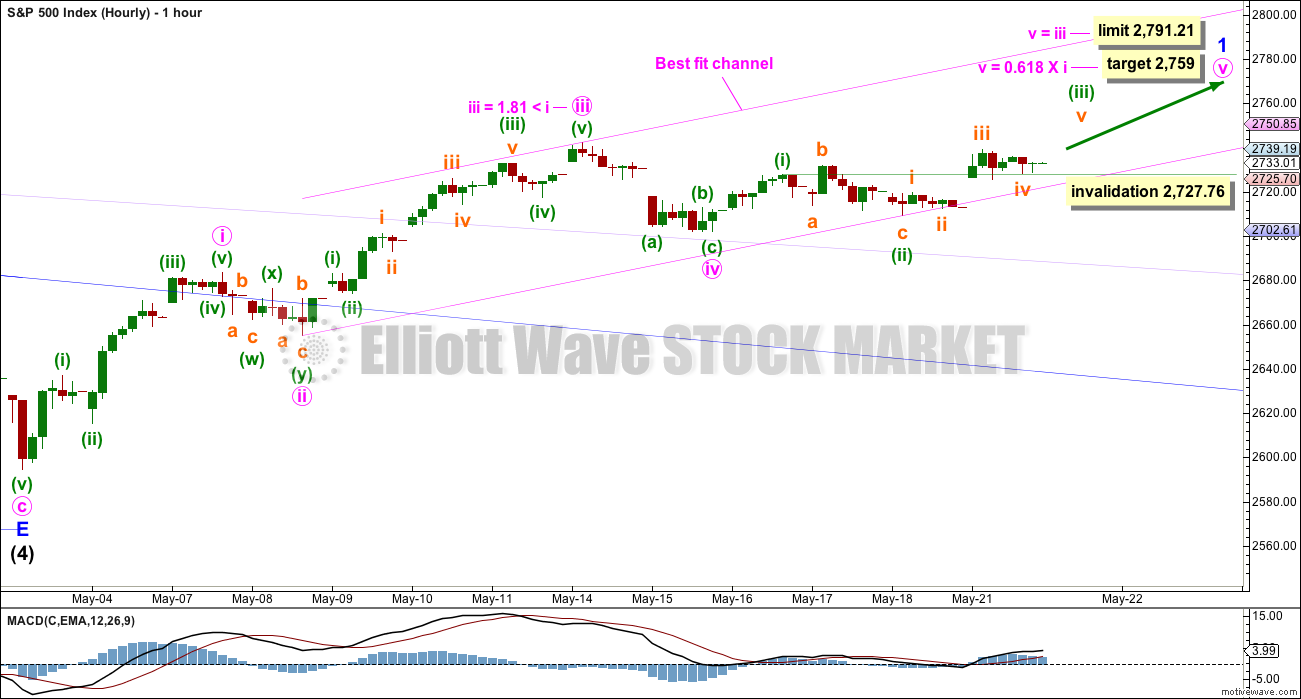
This hourly chart is again swapped over today due to another very bullish signal from the AD line. With the AD line moving strongly higher, it would be most likely that price will move higher tomorrow.
Minor wave 1 may be incomplete, and within it minute waves i, ii, iii and iv may all be complete. Only minute wave v may now be needed to complete an impulse upwards.
Minute wave iii is slightly shorter than minute wave i. So that the core Elliott wave rule stating a third wave may never be the shortest is met, minute wave v has a limit of no longer than equality in length with minute wave iii.
Within minute wave v, minuette waves (i) and (ii) may be complete. Within the impulse of minuette wave (iii), subminuette wave iv may not move into subminuette wave i price territory below 2,727.76.
The channel about this upwards movement is adjusted today to fit all upwards movement.
ALTERNATE HOURLY CHART
Click chart to enlarge.
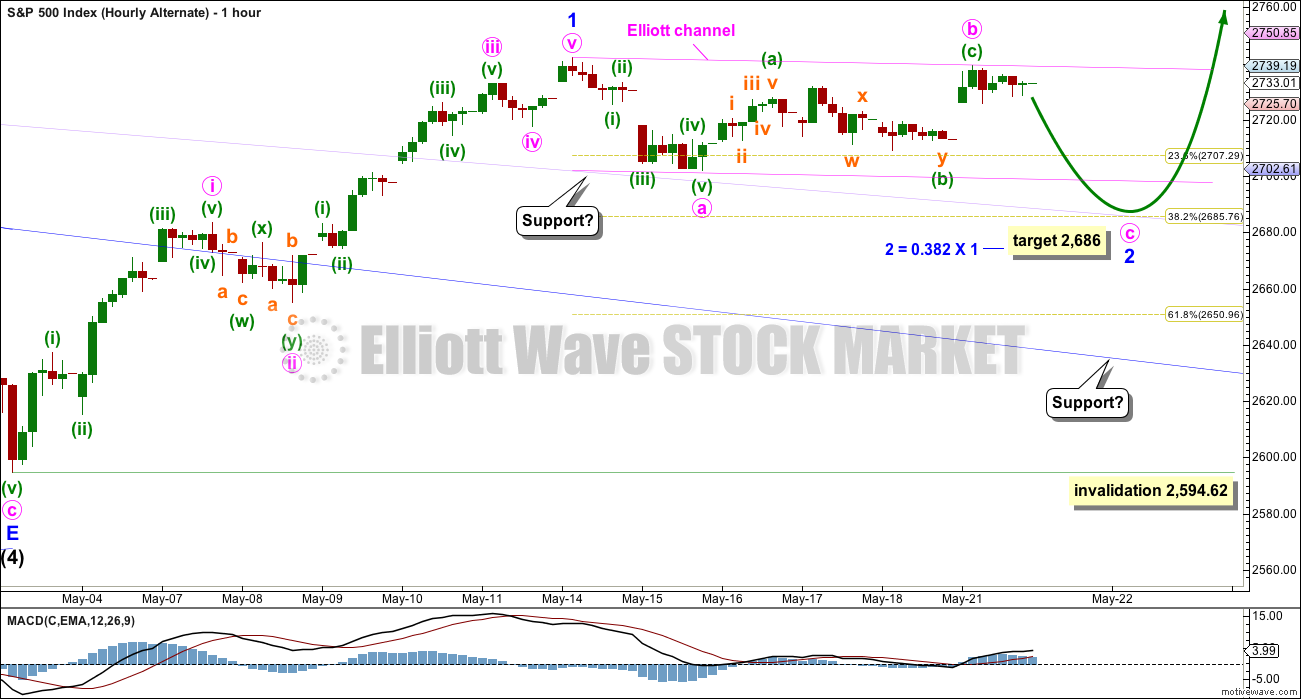
This wave count is swapped back to an alternate today. The very bullish signal from the AD line does not fit with the idea of a reasonable pullback occurring right here.
Minor wave 1 may be a complete five wave impulse. The middle portion of minuette wave (iii) does not have as good a look for this wave count, but the S&P does not always have good looking impulses.
Minor wave 1 may have lasted seven days. Minor wave 2 may be expected to last about three to eight days to have reasonable proportion to minor wave 1. Targets for minor wave 2 may be the 0.382 and 0.618 Fibonacci ratios. If it ends about the 0.382 Fibonacci ratio, then it may continue to find support at the lilac trend line (copied over from the daily chart).
Minor wave 2 may be subdividing as a zigzag, and within it minute wave a may be a complete five wave impulse. If minute wave a is correctly labelled as a five, then minute wave b may not move beyond its start above 2,742.10.
It is also possible that minute wave a is incorrectly labelled. It may be a complete double zigzag. If minute wave a is a corrective structure, then minor wave 2 may be unfolding as a flat correction. Within a flat correction, minute wave b may make a new high above the start of minute wave a at 2,742.10 as in an expanded flat. It is for this reason that an upper invalidation point is not added to this hourly chart.
Minor wave 2 may not move beyond the start of minor wave 1 below 2,594.62.
TECHNICAL ANALYSIS
WEEKLY CHART
Click chart to enlarge. Chart courtesy of StockCharts.com.
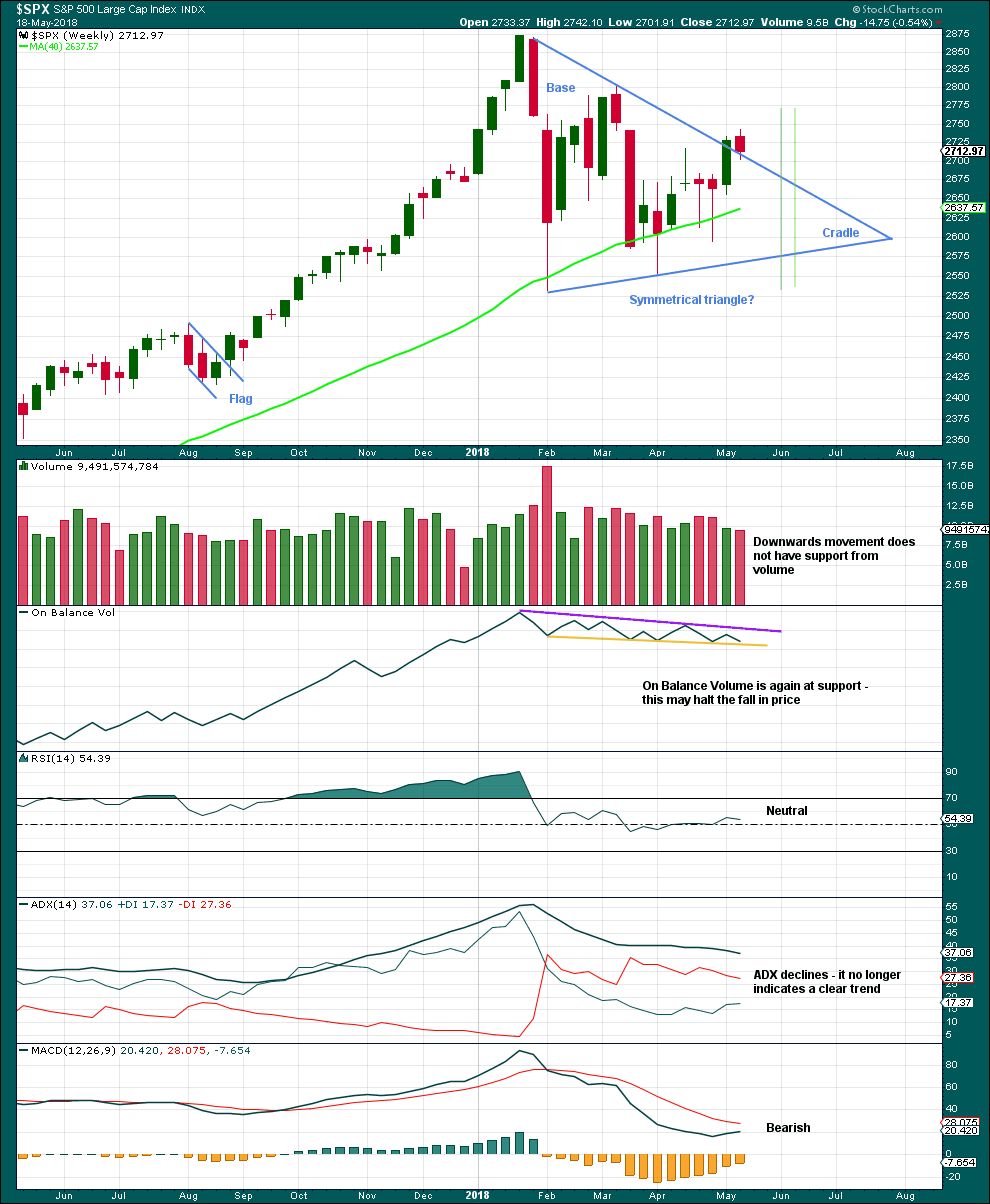
From Dhalquist and Kirkpatrick on trading triangles:
“The ideal situation for trading triangles is a definite breakout, a high trading range within the triangle, an upward-sloping volume trend during the formation of the triangle, and especially a gap on the breakout.”
For this example, the breakout may have now happened. There was a high trading range within the triangle, but volume declined. A downwards week may be a typical pullback following the breakout.
DAILY CHART
Click chart to enlarge. Chart courtesy of StockCharts.com.
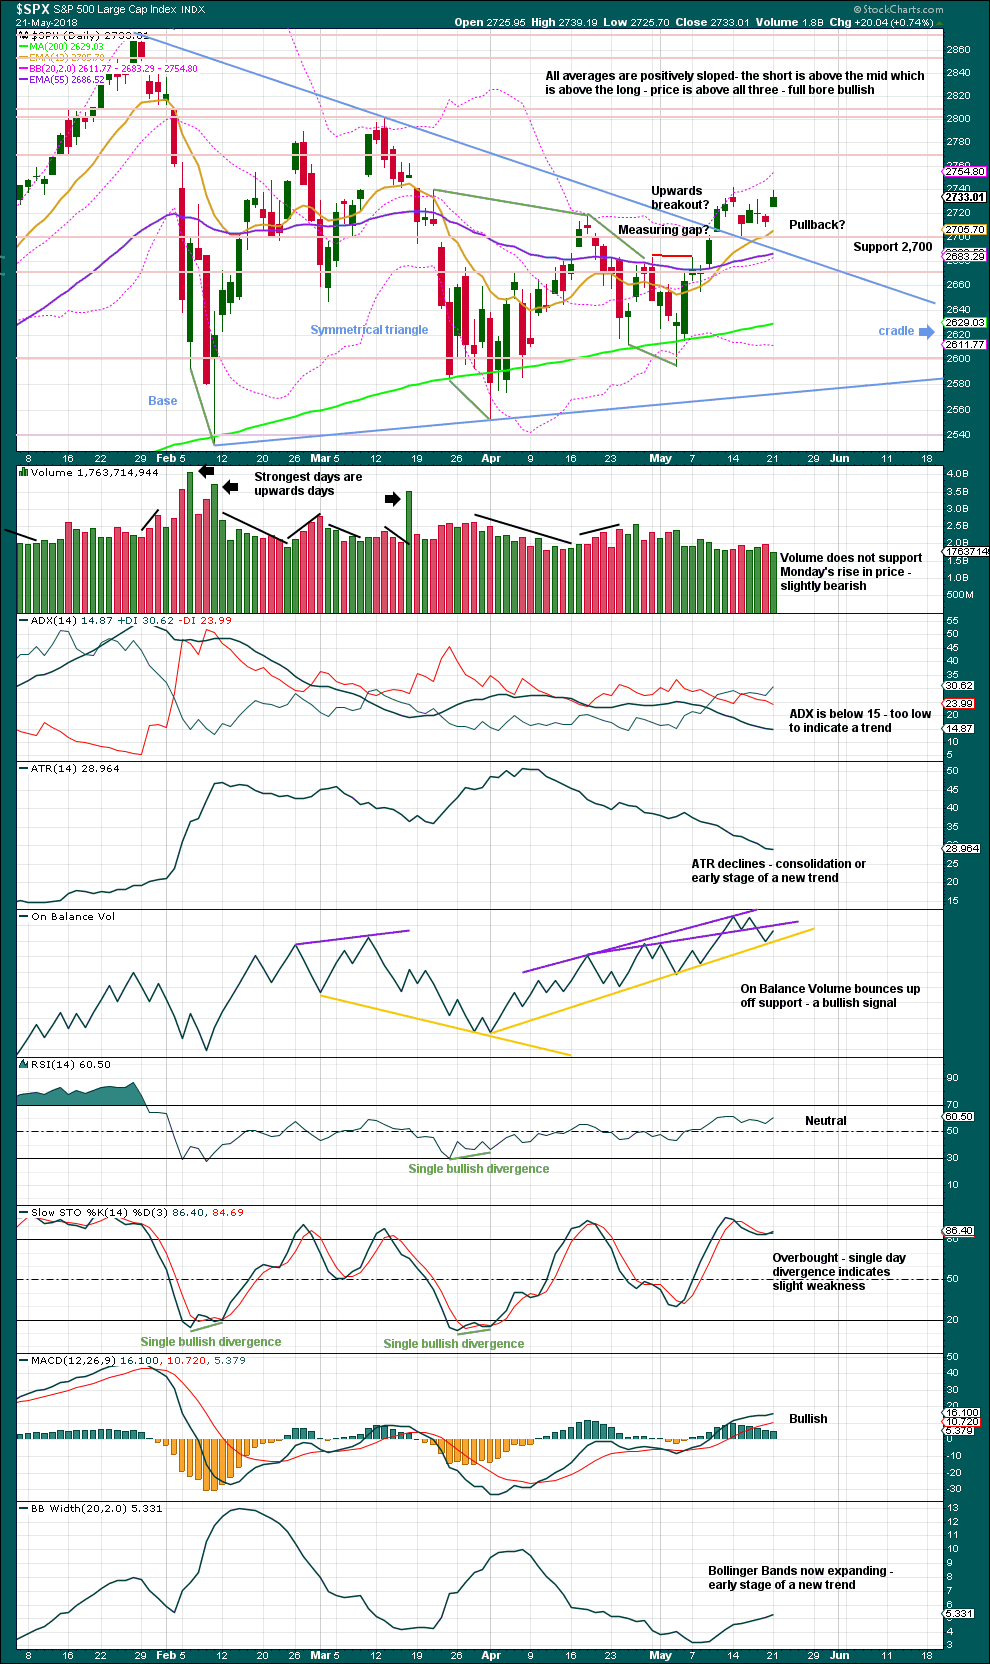
The symmetrical triangle may now be complete, and price has completed an upwards breakout. There may be some small cause for concern that the upwards breakout does not have support from volume. However, in current market conditions only some small concern is had here. Rising price on light and declining volume has been a feature of this market for years, yet price continues to rise.
After an upwards breakout, pullbacks occur 59% of the time. A pullback may find support at the upper triangle trend line and may be used as an opportunity to join a trend.
Symmetrical triangles suffer from many false breakouts. If price returns back into the triangle, then the breakout will be considered false and the triangle trend line will be redrawn.
The base distance is 340.18. Added to the breakout point of 2,704.54 this gives a target at 3,044.72. This is above the Elliott wave target at 2,922, so the Elliott wave target may be inadequate.
For the short term, the next smaller consolidation or pullback may come about 2,811. This shorter term target is calculated using the measuring gap. That gap may now provide support and may be used to pull up stops on long positions. The gap still remains just open; this target remains valid.
On Balance Volume has made a new all time high, providing a very strong bullish signal; expect price to follow. Another bullish signal now from On Balance Volume offers some support to the new main hourly wave count.
VOLATILITY – INVERTED VIX CHART
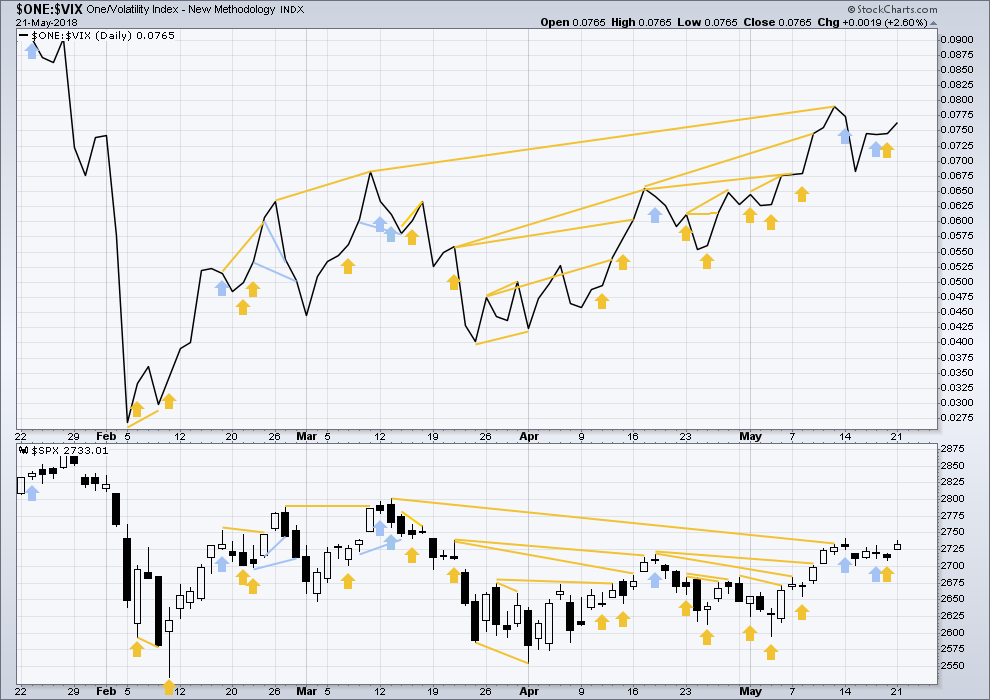
Click chart to enlarge. Chart courtesy of StockCharts.com. So that colour blind members are included, bearish signals
will be noted with blue and bullish signals with yellow.
Normally, volatility should decline as price moves higher and increase as price moves lower. This means that normally inverted VIX should move in the same direction as price.
There is still a cluster of bullish signals on inverted VIX. Overall, this may offer support to the main Elliott wave count.
Inverted VIX is much higher than the prior swing high of the 9th / 13th March, but price is not yet. Reading VIX as a leading indicator, this divergence is bullish.
Both price and inverted VIX moved higher today. There is no new divergence.
BREADTH – AD LINE
Click chart to enlarge. Chart courtesy of StockCharts.com.
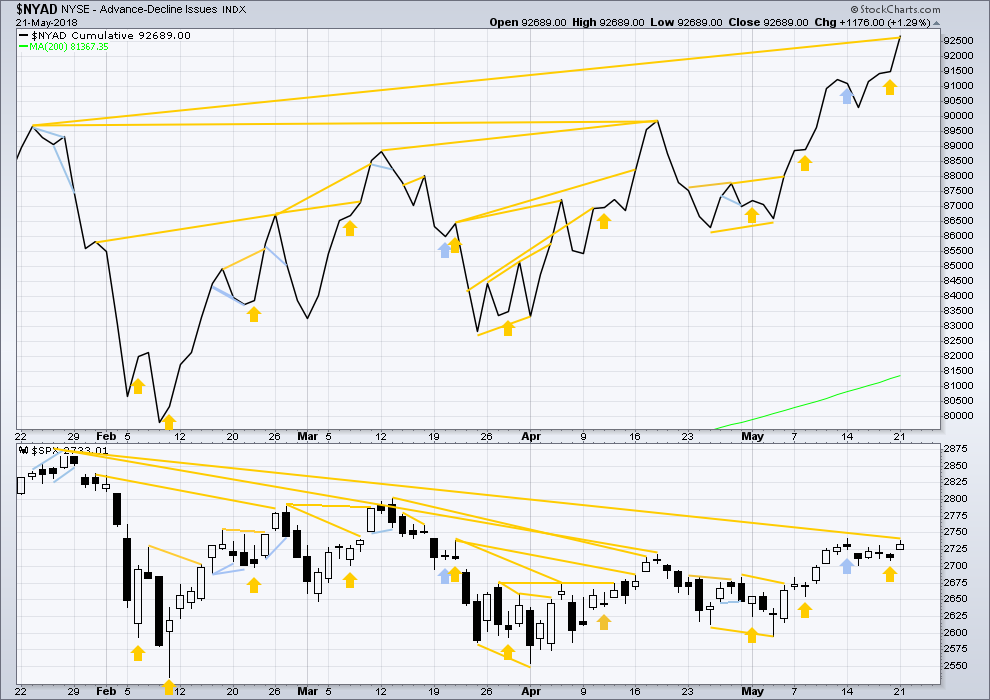
There is normally 4-6 months divergence between price and market breadth prior to a full fledged bear market. This has been so for all major bear markets within the last 90 odd years. With no longer term divergence yet at this point, any decline in price should be expected to be a pullback within an ongoing bull market and not necessarily the start of a bear market. New all time highs from the AD line means that any bear market may now be an absolute minimum of 4 months away. It may of course be a lot longer than that. My next expectation for the end of this bull market may now be October 2019.
Small caps continue to make new all time highs, but mid and large caps have yet to do so. This divergence may be interpreted as bullish. Small caps may now be leading the market.
Breadth should be read as a leading indicator.
There has been a cluster of bullish signals from the AD line in the last few weeks. This also overall offers good support to the main Elliott wave count.
The AD line has moved strongly higher today. It is almost vertical.
The new strong all time high is extremely bullish and supports the Elliott wave count, which expects price to follow through.
DOW THEORY
The following lows need to be exceeded for Dow Theory to confirm the end of the bull market and a change to a bear market:
DJIA: 23,360.29.
DJT: 9,806.79.
S&P500: 2,532.69.
Nasdaq: 6,630.67.
At this stage, only DJIA has made a new major swing low. DJT also needs to make a new major swing low for Dow Theory to indicate a switch from a bull market to a bear market. For an extended Dow Theory, which includes the S&P500 and Nasdaq, these two markets also need to make new major swing lows.
Charts showing each prior major swing low used for Dow Theory may be seen at the end of this analysis here.
Published @ 08:09 p.m. EST.
Enjoy! Low risk high confidence entry. Timed correctly you can consistently pull down 5K on each leg as you trade larger lots as you become more comfortable with the strategy….half that if you get whipsawed or proven wrong on trend. Also easy to defend… 🙂
Decided to join your party Verne, bought SPX bear call credit spread, Jun 14 expiry. If SPX > 2742, I’m out in a nanosecond for a very small loss.
Vern and Kevin ,
Vern – when you say 249/250 bear call spread – you mean 250/249 bear call spread – correct ?
buy over sell – correct – buying the 250 call , selling the 249 call
correct ?
Your terms below are confusing
A bearish call spread is a CREDIT spread, and the higher priced (and hence LOWER strike) call is the one SOLD, and the lower priced (and hence HIGHER strike) call is the one BOUGHT. Resulting in a net credit. So he meant selling a SPY call at 249 strike, and buying a SPY call at 250 strike. In my case, I used SPX options instead, and sold at 2725 strike, bought at 2730 strike (both Jun 14 expiry). I prefer to use credit spreads for shorts with a short expiry, so I can quickly “capture” the net credit (which is really time premium $’s) as quickly as possible, and credit (vs a debit spread) because if the price moves against me (up), the volatility should FALL, and the options will be come CHEAPER. If I have to close the position at a loss, I’ll be buying more than selling…so I’d prefer the price of the options to have fallen. And v.v. if the price moves my way (down): the IV should increase, the price of options should increase, I won’t have to buy back my sold options, and when I sell the calls I bought, they will have a higher price than “otherwise”. Hope that all makes sense!
The interesting question to me is why Verne chose a spread that is so far out of the money. Very Interesting that…something I will have to ponder and play around with using my tools. I’m sure he has an excellent reason for it…or perhaps it’s a typo? VERNE? What’s up with that???
Not so far if it was a DIAMOND (DIA) spread…
I already had SPY 272.50/273 and 274/275 spreads in the kitty….
Silly me….
They are CREDIT spreads, as always…. 🙂
“Uh, Houston, uh, we have a double top, repeat, we have a double top…”
Measured move point is roughly 2662, if it cracks the 2702 low.
A lost battle around a new pivot will often see price revisit the arena of the prior contest…think round numbers 😉
Well 2683 gave resistance 3 times recently…. and the tops of those numbers are round, lol. Not to mention the TA triangle might be hanging around there too
At break even on Diamond spread. Covering half.
Good morning everybody! It’s getting cold down here in NZ. Hope you’re all coping with the heat up there in the northern hemisphere.
Updated hourly chart for you:
It looks like submineutte iv was a nice little triangle on the five minute chart. Minuette wave (iv) may be also unfolding as a little triangle. Which would mean one final small thrust higher to end this session could be happening….
Or, I’m wrong. As Kevin says, minor 1 could possibly be over at todays high.
If the invalidation point is passed that would be how I’d label it. So that’s where risk is right now.
2742, lets break it!
DJI’s third attempt this month to clear 25K pivot (equivalent SPX 2740) coming on decreased volume and meeting resistance. Sold long SPY calls for very nice gains.
Deploying DJI 249/250 bear call spreads. You know the drill! 🙂
Vern , when you say 249/250 bear call spread – you mean 250/249
buy over sell – buying the 250 call , selling the 249 call
correct ?
Yep!
Technically the minor 1 could be complete, without any truncation of the minute 5; it’s exceeded the minute 3 by a tiny amount. Some care is warranted here re: downside risk, IMO. The minor 2 down could start any time, and could sell like nobody’s business.
To add to that, price is also sitting right on the 61.8% retrace of the Jan-Feb high-low swing. A “most likely” place for a turn back down, generally speaking. I’ll be exiting long positions very fast if there’s any signs of weakness here. And getting short appropriately if and as it drops.
Hi Kevin
I know you don’t know this but in your opinion what do you think the odds are of this idea of 2 down starting?
Thank You
I don’t really think that way too much. I think of “primary” (or “main”), and alternate. Clearly the main here is more push up in a minute 5; looking at the hourly, it “shouldn’t” be anywhere near complete. So that’s the “high probability” case (70%???).
The alternate is it IS complete (or the minor 1 up was complete on May 14 and everything since is the slow to develop minor 2). What I look for is CONFIRMATION, which would make this more like “70% likely”. What will confirm it reasonably solidly for me? Price dropping underneath the May 18 low of 2709.42. That would undercut the low of the supposed minuette 2. At that point, I get super light to nonexistent on the long side (except for my real long term plays, like Oct or Dec calls, perhaps). And the “main” switches to something with minor 2 in progress, and expected to go lower.
OF course there’s always the risk of major whipsawing here. It happens! Better to eat some commissions IMO and perhaps miss a little profit than take the risk of holding while price possibly starts collapse. But first: does 2709.42 hold??? Price is reasonably above it now, but that can change in an instant.
There is also the possibility the Intermediate 4 triangle is incomplete. I am concerned with the slow progress to the upside and the inability to close the gap above 2742. The momentum is not looking like what I would expect for the beginning of an intermediate 5 bull rally. Thus, I am still only 50% long in my long term trading account.
🙂
Or…the triangle turns into a combination….as Yogi Berra said, it ain’t over until it’s over!
I’m not concerned at all. Remember how light and weak the last bull run of intermediate (3) looked, up until about September last year?
I expect intermediate (5) will be weaker. It’s a fifth wave.
I think we may have seen the last real strength in this market at the end of intermediate (3) from September last year to the end of January this year.
That would follow a typical commodity type of behaviour: exhibit a swift strong fifth wave to end a third wave impulse, have a meandering fourth wave, then a weak fifth wave to end it all.
Now, I could be wrong. We could see strength return for a wee while to end primary 3. But that’s a way away yet.
I agree there’s a possibility there’s a major swing high here, so much so that if I held significant SPX profits, I’d take them here, and only reenter on a decent push ABOVE 2742 (but that’s just me being a conservative pig!). But as for the momentum, at the weekly level, it’s as high as it ever was during the roaring bull of 2018. The May 3 to today move was very high momentum!! It just hasn’t run for long yet. Nor has it broken down yet. Here’s my weekly chart with my “speed lines”, taken from the recent high momentum periods in 2018. SPX is still running well above them. It may not last. And it’s probably not reasonable to expect “maximal” momentum to immediately return (i.e., tracking to the steepest speed line). We’ll see…
“There is also the possibility the Intermediate 4 triangle is incomplete. I am concerned with the slow progress to the upside and the inability to close the gap above 2742.”
That’s what I keep coming back to. I’m probably wrong, but everytime I look at this triangle I wonder if it is still going on.
Dogged resistance at the May 14 high of 2742.2!! If that can go today, perhaps the market can go too. “It’s time….” Took 1/2 my morning SPX profit at the high of the first push, considering a reload (perhaps smaller, using SPY options instead of SPX) or…just relax and watch. Nice to grab some little profits first thing, just in case it turns into an Ugly Day. All the “market drivers” (FAANG stocks) started strong, but have mostly stalled/slightly reversed now. NFLX an exception, it looks very strong.
It seems to me that the AD Line may not be an immediate indicator. If I recall properly, we have had three new ATHs in the AD Line indicator over the past couple of weeks. Not all of them have been followed by an up day much less a new ATH in price. Don’t get me wrong, I think the AD Line is telling us we are headed to new price ATHs and it is very bullish. But somehow, it seems to me to be a longer term indicator rather than a short term or immediate indicator. Just my thoughts.
As far as my trading strategy. I am still 50% long in my long term account. I am still looking for a low in Minor 2 to purchase the other half of my longs. I was looking for two things to happen to set up my 2nd half long position; 1) back test the triangle line which has happened, and 2) a low in Minor 2 which has not happened.
Is it possible that the advance off the 2495 low, Minute E, is a 1-2, 1-2? See the chart below. If this count is correct, we should see a strong advance almost immediately as we would be in a 3rd of a 3rd wave up. That is the danger of my current strategy. I could miss acquiring the 2nd half of my long position.
Hourly model for tomorrow. futures up 0.7…this main is on track!
The approaching top (3-5 days away?) will be significant, as it completes a minor 1 and the minor 2 could in theory even approach 2594.
sorry, my bad, futures flat currently, not up.