
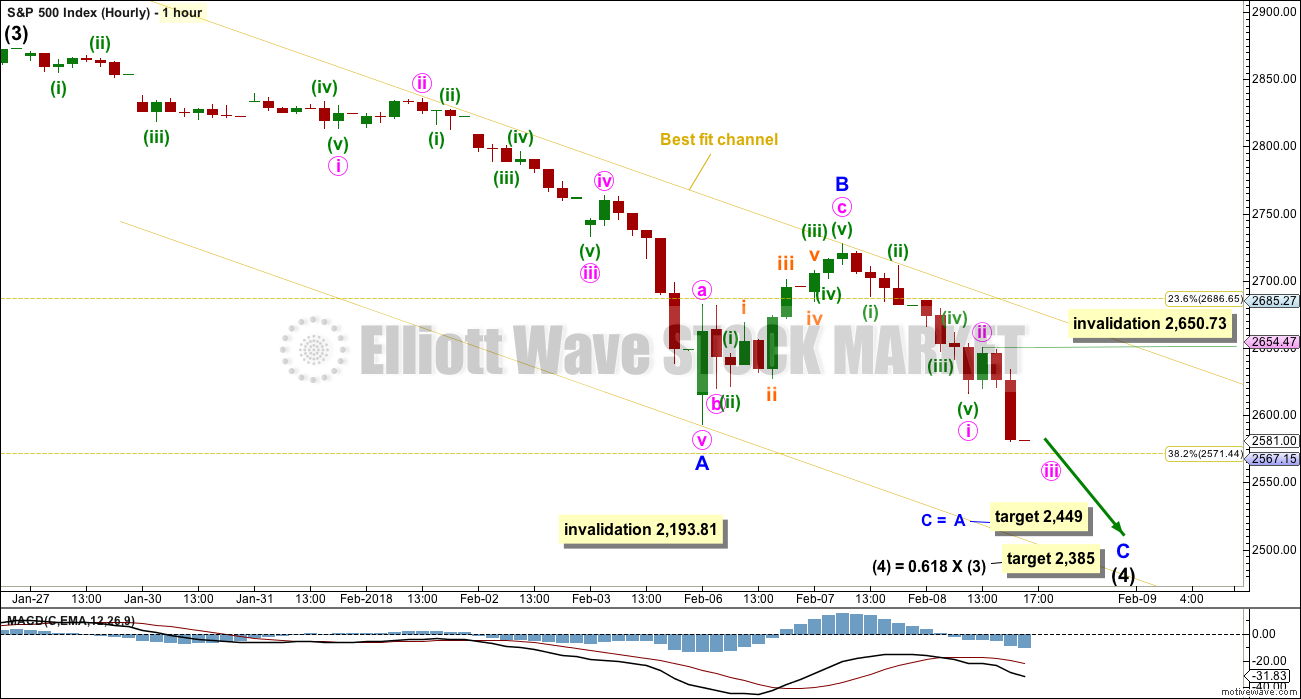
A new low below 2,668.62 in the first hour of trading invalidated the main hourly wave count and gave confidence to the alternate. At that stage, more downwards movement to new lows was expected. The targets have not yet been met.
Summary: Downwards movement looks incomplete. Targets are now at 2,449 or 2,385.
Always practice good risk management. Always trade with stops and invest only 1-5% of equity on any one trade.
The biggest picture, Grand Super Cycle analysis, is here.
Last historic analysis with monthly charts is here. Video is here.
An historic example of a cycle degree fifth wave is given at the end of the analysis here.
MAIN ELLIOTT WAVE COUNT
WEEKLY CHART
Click chart to enlarge.
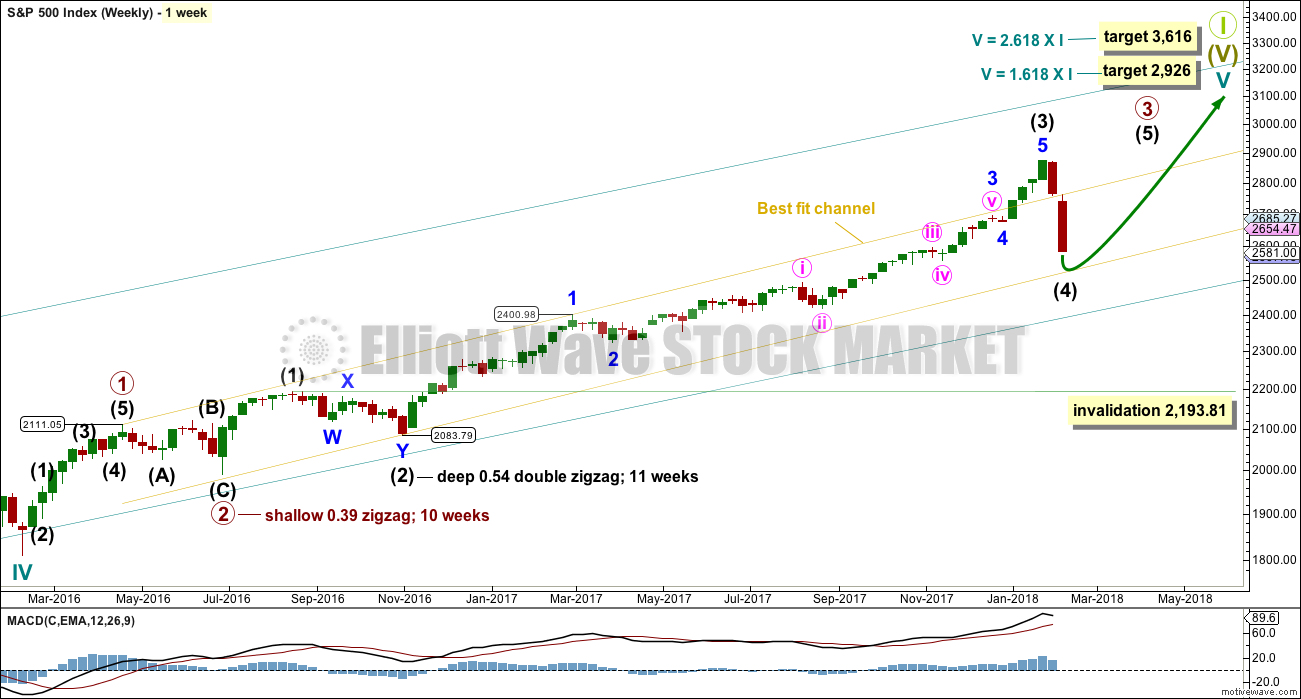
Cycle wave V must complete as a five structure, which should look clear at the weekly chart level. It may only be an impulse or ending diagonal. At this stage, it is clear it is an impulse.
Within cycle wave V, the third waves at all degrees may only subdivide as impulses.
This analysis is changed today to see the current correction as intermediate wave (4). Due to its size intermediate wave (4) looks proportional to intermediate wave (2), even though their durations so far are quite different.
Intermediate wave (4) has breached the Elliott channel on the last published weekly charts. The channel may be redrawn when it is complete using Elliott’s second technique. A best fit channel is used while it is incomplete to show where it may find support. Price points are given for this channel, so that members may replicate it on a semi-log scale.
Intermediate wave (4) may not move into intermediate wave (1) price territory below 2,193.81.
DAILY CHART
Click chart to enlarge.
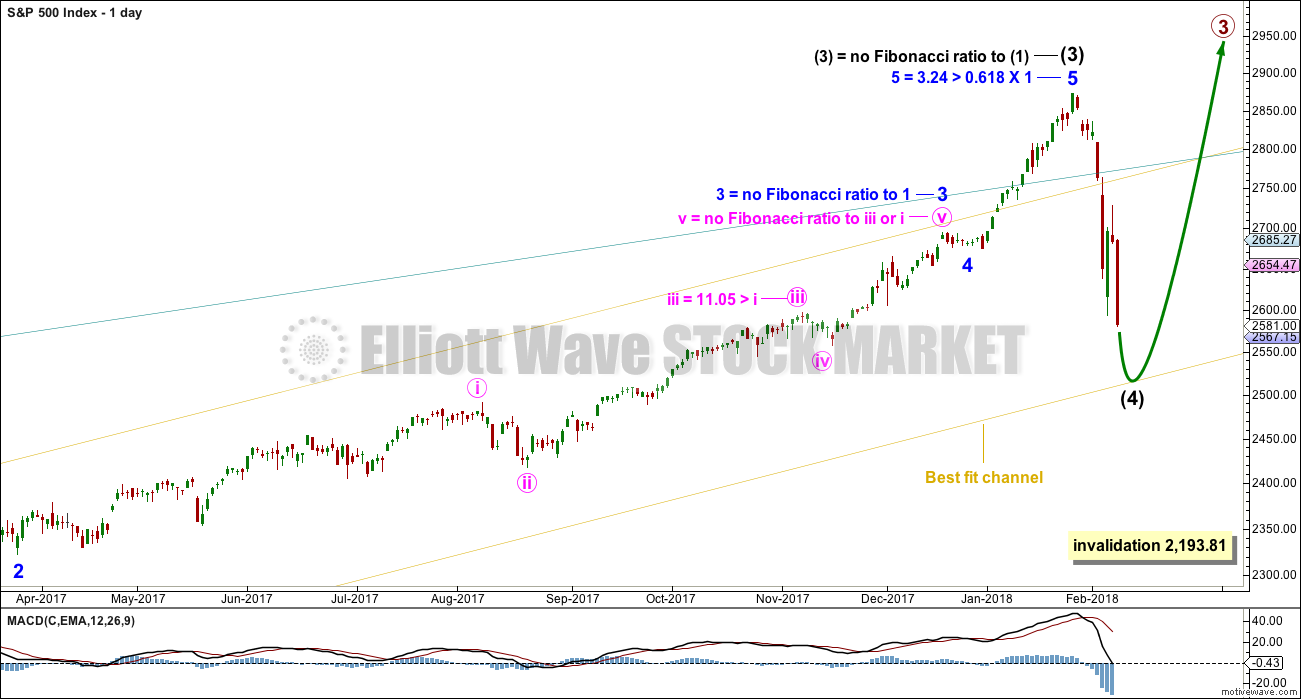
The S&P has behaved like a commodity to end intermediate wave (3): a relatively strong fifth wave with a steep slope. The high looks a little like a blow off top. This is being followed by a sharp decline, which is typical behaviour for a commodity and not common for the S&P.
There are adequate Fibonacci ratios within this wave count. It is common for the S&P to exhibit a Fibonacci ratio between two of the three actionary waves within an impulse, and uncommon for it to exhibit Fibonacci ratios between all three actionary waves. This means that the lack of Fibonacci ratios for intermediate wave (3), minor wave 3, and minute wave v is not a concern. This is normal.
There is some distance below before intermediate wave (4) may find support about the lower edge of the yellow best fit channel.
HOURLY CHART
Click chart to enlarge.
A zigzag downwards may be completing.
With the degree of labelling moved up one today, this affects the Fibonacci ratios of intermediate wave (3) and so affects the targets for intermediate wave (4).
The first target expects to see the most common Fibonacci ratio between minor waves A and C within the zigzag. If price keeps on falling through this first target, or if when it gets there the structure of minor wave C is incomplete, then the second target may be used.
The second target would see intermediate wave (4) a deep correction, providing poor alternation with the depth of intermediate wave (2).
ALTERNATE WAVE COUNT
WEEKLY CHART
Click chart to enlarge.
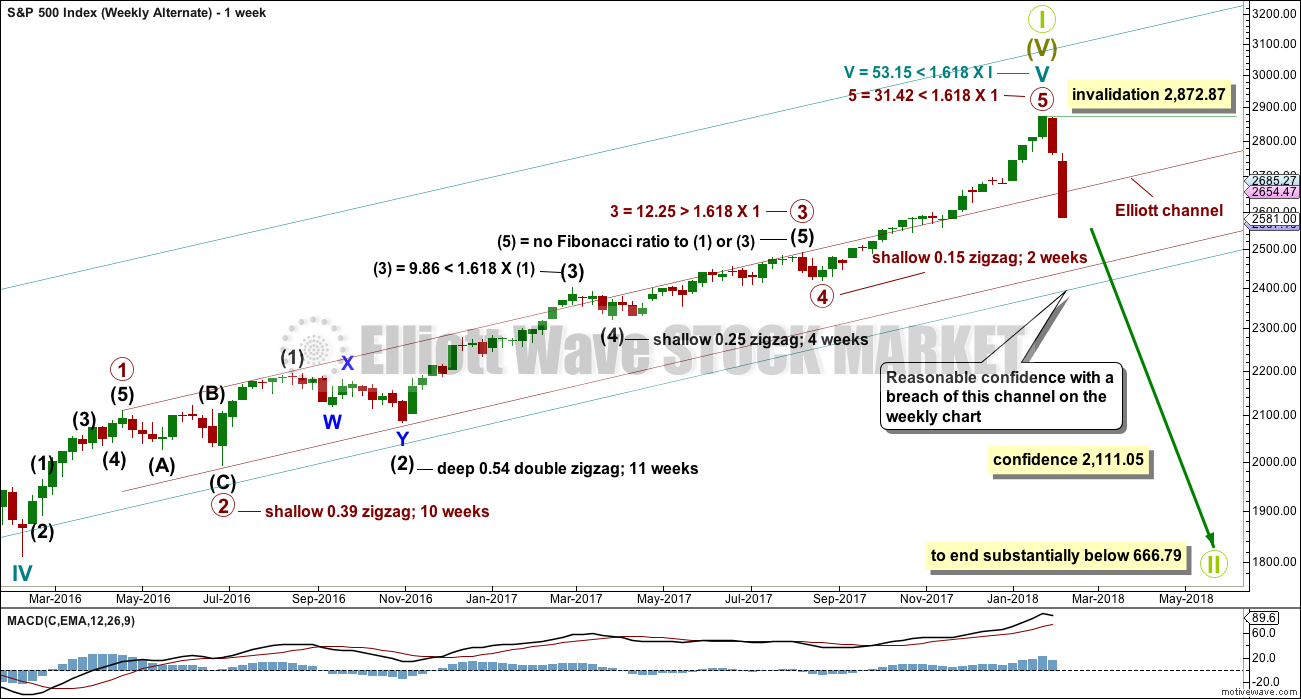
This alternate wave count is published with the caveat that at this stage it must be judged to have an extremely low probability for the following reasons:
1. There is no divergence between price and the AD line at the all time high. All bear markets within the last (almost) 100 years began after a minimum of 4 months divergence with the AD line. If this wave count is correct, then this is the first time in almost 100 years when divergence did not occur.
2. There is no divergence between price and RSI on the monthly chart at the last all time high. This is again highly unusual prior to a bear market.
3. The bear market may have begun suddenly without a normal prior increase in market volatility. Normally, corrections unfold prior to the end of a bull market that increase by degree prior to the bull market ending.
However, low probability (even as low as I judge this to be) does not mean no probability. I would rather members are aware of this risk and manage this risk accordingly.
This wave count absolutely requires a clear breach of the teal channel on the weekly chart before any confidence at all may be had in it. A breach would be a full weekly candlestick (not just daily) below and not touching the lower teal trend line. This channel is copied over from the monthly chart.
Thereafter, a new low by any amount at any time frame below 2,111.05 would add substantial confidence to this wave count. At that stage, downwards movement could not be a fourth wave correction within an ongoing impulse as it would be back in first wave price territory of primary wave 1.
If this wave count is correct, then a once in multi-generations trend change may have occurred last week. Grand Super Cycle wave II would be expected to last at least 20 years, and very likely a generation. It would be very likely to end substantially below the end of Super Cycle wave (IV) at 666.79.
I judge the probability of this alternate wave count to have such a low probability that I was hesitant in publishing it. But I am also aware that just because this kind of end to a bull market has not been seen in almost 100 years does not mean it cannot happen.
TECHNICAL ANALYSIS
WEEKLY CHART
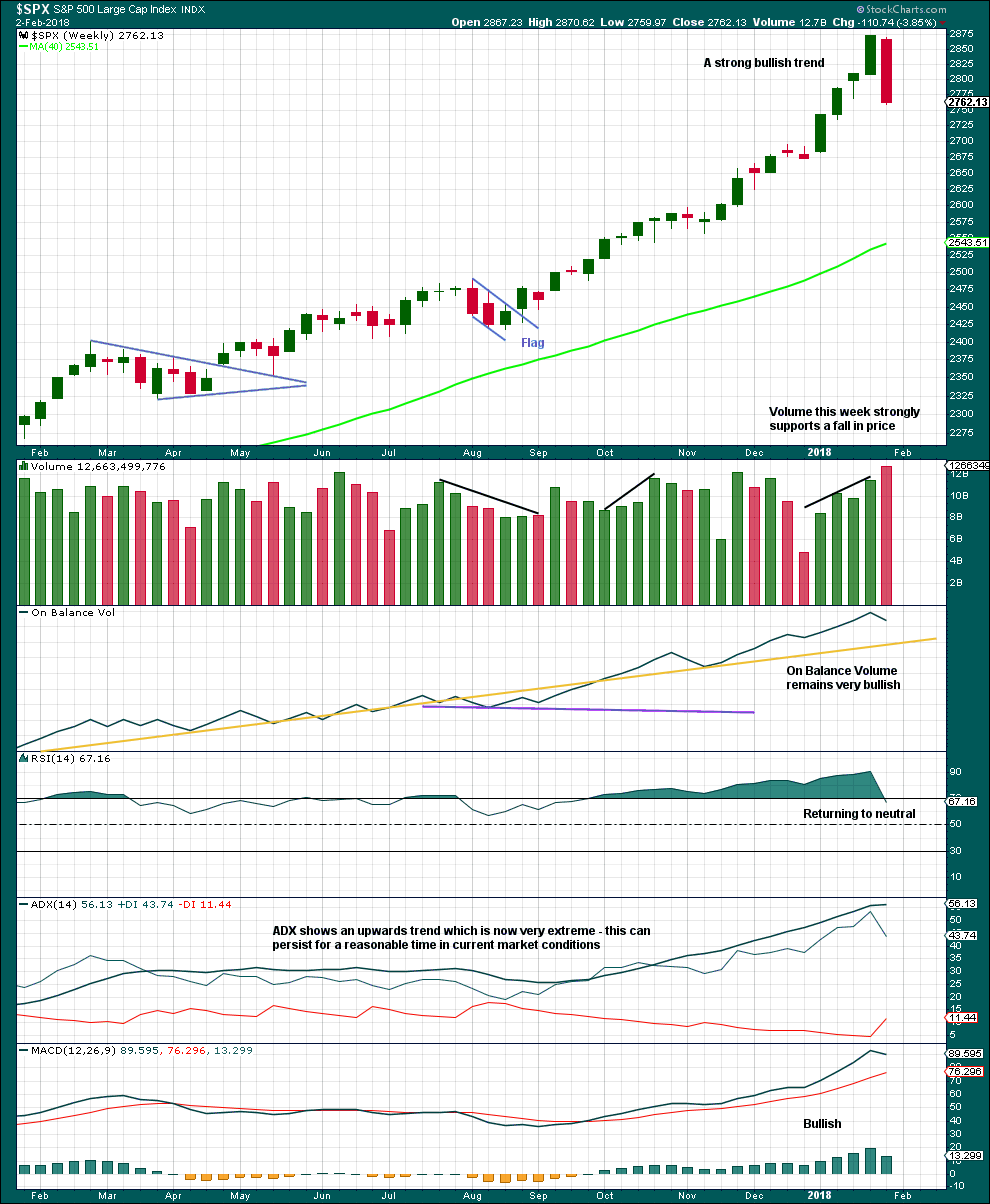
Click chart to enlarge. Chart courtesy of StockCharts.com.
This strong bearish weekly candlestick is not technically a bearish engulfing reversal pattern because the open this week gapped lower. However, the close this week well below last week’s open is very bearish. Support from volume is also very bearish.
DAILY CHART
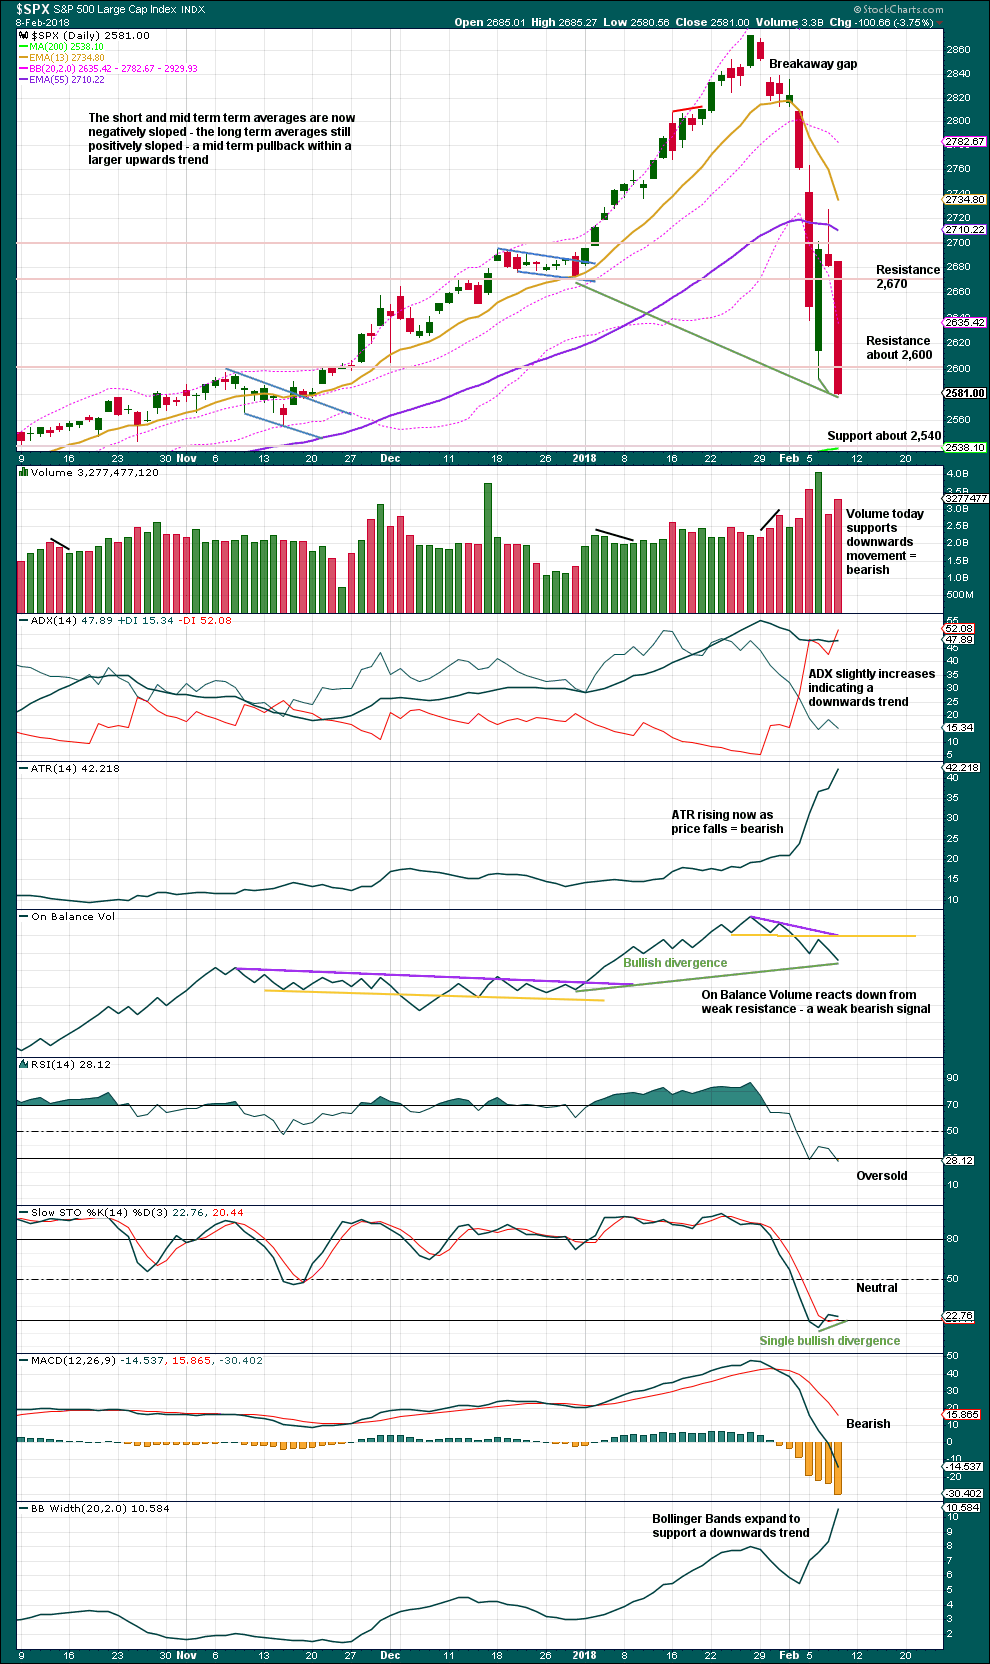
Click chart to enlarge. Chart courtesy of StockCharts.com.
Next support is about 2,540. Below that there is support at 2,490 and then strong support at 2,420.
RSI is oversold, but there is no divergence with price. If divergence again develops, even single day, a bounce would be expected.
Divergence with Stochastics indicates some weakness today in downwards movement. But this can develop further before a low is found.
VOLATILITY – INVERTED VIX CHART
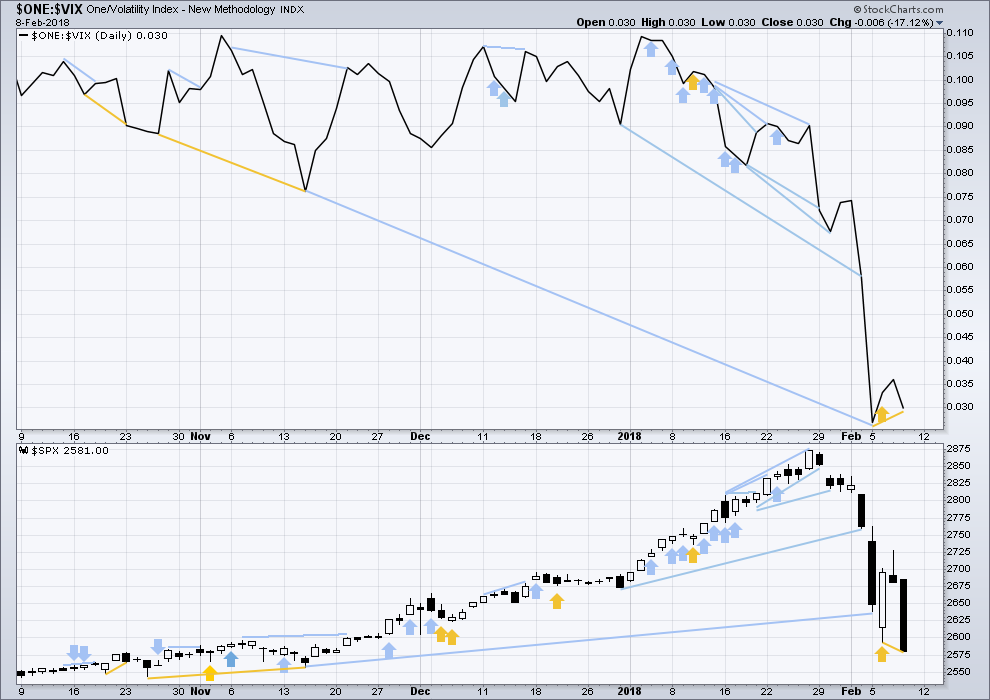
Click chart to enlarge. Chart courtesy of StockCharts.com.
So that colour blind members are included, bearish signals will be noted with blue and bullish signals with yellow.
Normally, volatility should decline as price moves higher and increase as price moves lower. This means that normally inverted VIX should move in the same direction as price.
The new low today for price is not matched by a corresponding new low from inverted VIX. The fall in price did not come with a normal increase in volatility. This divergence is bullish and indicates some weakness within price.
BREADTH – AD LINE
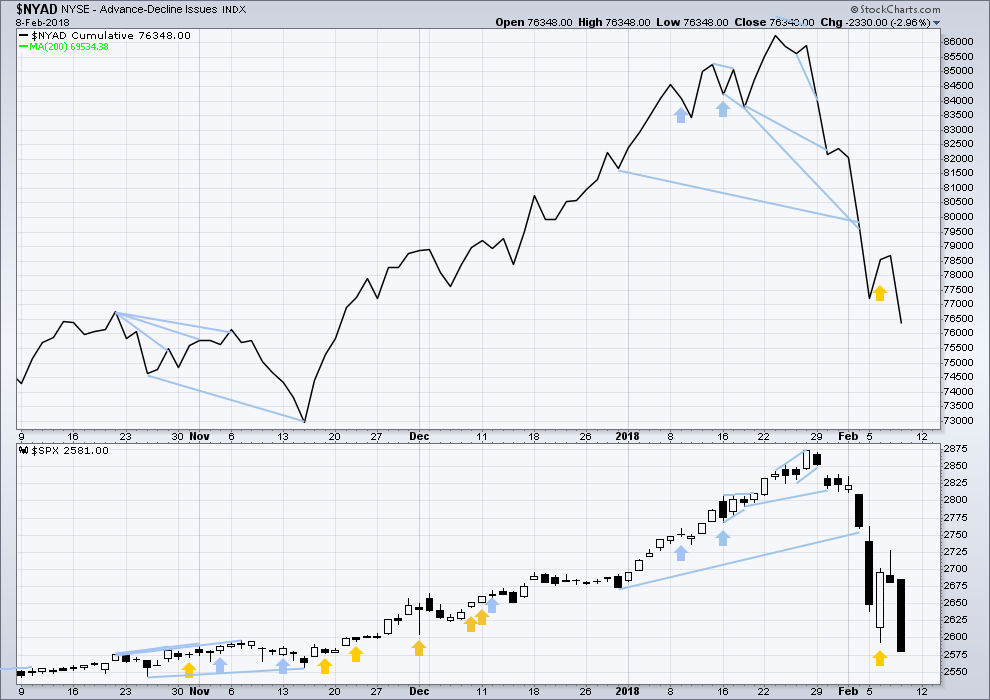
Click chart to enlarge. Chart courtesy of StockCharts.com.
There is normally 4-6 months divergence between price and market breadth prior to a full fledged bear market. This has been so for all major bear markets within the last 90 odd years. With no longer term divergence yet at this point, any decline in price should be expected to be a pullback within an ongoing bull market and not necessarily the start of a bear market.
All of small, mid and large caps last week made new all time highs. This market has good support from rising breadth.
Breadth should be read as a leading indicator.
Both price and the AD line made a new swing low today. The fall in price has support from falling market breadth; this is bearish. Bearishness in the AD line will be given more weight in this analysis than the bullish divergence between price and inverted VIX.
DOW THEORY
All indices have made new all time highs as recently as three weeks ago, confirming the ongoing bull market.
The following lows need to be exceeded for Dow Theory to confirm the end of the bull market and a change to a bear market:
DJIA: 17,883.56.
DJT: 7,029.41.
S&P500: 2,083.79.
Nasdaq: 5,034.41.
Charts showing each prior major swing low used for Dow Theory are here.
Published @ 10:04 p.m. EST.
FWIW, I don’t know what EWI is saying this weekend, but both Nate and Daneric are showing the Jan. 29 high as the top of Intermediate 5, with seriously bearish-looking wave counts after that…
I believe the high was Jan. 26…. 🙂
That’s right. You are correct, sir!
Everyone – thanks for all of the commentary and live updates today. Seemed to be a very healthy message board with some consensus around the fade at the open, new lows, and impulse higher. Rarely works that way, but it was a good day. Thanks for everyone’s help – let’s keep it up next week.
Lara. Is Minor 4 still a possibility rather than Intermediate (4)?
Granted we have come down .618 of 3-unusual for fours to retrace that far but we’re still above minor 1.
Technically yes it is. But when you look at this move now on the weekly and monthly time frames it looks too big for minor 4.
It is now so large I really only want to consider intermediate or primary degree for it.
Fair enough thanks
This question for for Verne (who I know has a lot of experience trading experience with UVXY, and many many other instruments) and others who have experience trading VIX instruments:
I purchased SVXY today near the lows at 9.60. I do know it implodes when VIX explodes to the upside like it did plunging from over 100 to 10 last week… and this could very well happen again if we have another VIX spike. But since the VIX didn’t make a new high with the market plunging to new lows today, I felt it was good risk/reward move… Plus SVXY itself barely made a new low today below yesterday’s low even when the market was down significantly intra-day, again pointing to a good risk/reward…
Assuming VIX going down as market rebounds (i know both of those assumptions may not happen, as VIX can go up when market goes up; and markets may plunge again next week)… what is a realistic target for me to sell this unpredictable instrument?
I just don’t think Fib ratios apply to this type of instrument and other like VXX, and UVXY…
Thanks so much in advance as I’ve learned a lot from this forum over the years, from Verne in particular 🙂
Also I wanted to send a shout out to Olga (I do miss her input in this forum), Rodney (who i’ve also learned a lot from), and Doc…
Hi Ari,
I am not at Verne’s level but I did put on a similar trade today. I think it is very reasonable to assume UVXY can drop 30-40% in a week or two assuming a short-term bottom is in. Now that SVXY is starting to track again, that would imply somewhere around $13-$13.2, which is my target. You can easily squeeze more out of it but that is a very healthy return given time-frame.
Also, always wait to see how Lara’s targets change. If she is expecting downwards movement then we can take it off a sooner perhaps.
Thanks Jonathan! Good reference points…
Probably a good trade guys. I picked up a few calls at the close myself.
Just remember that even though some folk got away with it for a long time, these are genetally NOT good buy and hold instruments. The funds rebalance daily and can be frighteningly volatile as some folk sadly discovered. Probably smart to roll profits out early and often. It does seem that Frau Yellen’s departure is returning normal price discovery to markets. Lord only knows what she has been up to all these freaky years! 🙂
My trading plan was to use the 200 day as a short term pivot. Going foward it will be the 50 day and overhead gaps before I switch from scalping to safely riding the trend to new highs. I am thinking of taking a little break but it won’t be too long; I would miss you guyz! 😉
I’m sure more than a few people will miss your input on here while you’re gone.
Thanks Verne!
What are you planning for vacation?
Andorra… 🙂
Well thank you Ari. I appreciate your affirmation. Have a great weekend.
Hey Rod, don’t forget to settle your scores bud!
We are rooting for ya!!!! 🙂
Thanks. It is really looking like we will get good signals. Small 3rd wave up to close in the green. Plus over 2620 is a confidence point.
This is a HISTORIC WEEK of market activity. Quite amazing.
I did well today, hope all did or are positioned to do so.
Have a great weekend all.
Last chart today:
updated 5 min
could have completed a five up, three down. if so, now looking for another five up
bottom line still remains that while price is within the channel on the hourly chart, assume it could continue lower, high levels of risk remain
Very good advice Lara. If the bottom is in, the market has a long way to go to the upside, lots of profit potential. Missing the launch may mean missing some profit. But in the larger scheme of the next move up, it should be a small portion of the total gains relatively speaking as we head to new ATHs.
Lara, you tha man!! Er….excuse me…LADY!!
Have a fantastic weekend!!
BTW, even if you are bear, like moi, unless you are a young whippersnapper you know some of the most insane rallies you will EVER see are bear market rallies. They can indeed be a sight to behold with trades doubling and quadrupling in a single session. The most fun you can legally have! 🙂
Wow, if we are going up from here this 5 min chart is a perfect example of EW levels working. Retraced at 50% retracement when C=A.
The great Jesse Livermore once said the greatest money he ever made was when he was sitting and doing nothing!
The one time you can achieve truly life-changing gains is when markets are at extremes, such as was the case at the recent highs. Some of us made bigger gains than we had trading the previous 12 months.
The market is now at another extreme, and is probably offering another similar opportunity in the opposite direction. What is great about this situation is that it does not require a lot of activity. If you are an options trader and pick up say DIA 240 strike calls a few months out you can simply sit!
Stops are critical, and so are profit targets. Don’t be avaricious! ( like that word?)
Even if we have a new bear market underway, a 62% re-tracement at the very least can reasonably be expected. Go for it!! 🙂
You recommend a good book for understanding options? I just barely finished an EW book, just in time!
Anything written by Ken Trester…
Oh my god I love this market…..good to have some real vol!!! Jerome Powell’s my new hero. Since he’s been in haven’t seen the wizard step in once!
All aboard!!!
is this legal?? 😀
VXX puts deeply in the moolah!
So much fun…..
This is a study in sentiment and herd behavior.
Before I go through comments below, this is what I see this morning
Hourly:
breakdown of minor C on the 5 minute chart:
the low could be in now folks
but let us see what RSI and volume have to say after the session is closed.
and the bottom line must remain that while price is still within the yellow channel accept the risk price may continue lower
a channel breach is important for confidence
two confidence points on the hourly chart: the first means that this upwards bounce can’t be just a second wave correction within minute wave v, so minute v must be over
the second higher confidence point means upwards movement could not be a second wave correction within minor wave C, and so minor wave C would have to be over
Where’s the 2 down? Please Lara may I have a 2 down now? I want to get on board again!!! (And I’m a miser, so now “price is too high”!!!)
may have now arrived… right on schedule 🙂
I’m focusing on these retrace lines of the upmove, to try to get on board long at more size on this “2” pullback.
I’m expecting/looking for an ABC down, and I see an A and a B in progress…C should end at 50% or 62% retrace? That would be perfect…
Clean bounce off the 50%. I’m in after the first 1 minute bar up off the low….Elliott Save Me!!! Lol!!
Keep those fib levels rolling…! 🙂
does anyone have a count for this?
Impulse up off the low…
Look alive people! 🙂
If that’s the C wave done then it ‘s very short compared to A
Can you say “impulse?” 🙂
Look at volume…fits nicely with a third down and three of five…
What’s that old adage? Oh yea…”don’t fight the tape”. Not bad advice on a day like today.
Clearly five waves down. Somebody with a fib ruler throw out the 62% retrace will ya?
We should all now be watching that pivot with EXTREME interest…
2652 (roughly) is the 62% retrace of the low today to the high from Wednesday. I assume that’s what you mean by the 5 wave down, the C leg of this overall A-B-C.
Crunch time. The 200 day sma MUST hold. If we move past and do not retake it that could be a game changer…
Trying to take a page from the Verne playbook and putting in “stink bid” for SPX calls, 2580 for today’s expiration, at 2.00. Hoping to see a dip below the 200dma and a bullish hammer reversal.
Damn, not dice on the fill. Cancelling order for now. Still not enough volume on the hourly candle for me to be confident that’s it.
Getting a little nervous going into the close. Everyone seems to be expecting a bounce, and has been for the last two weeks. This market isn’t giving anything back so far though.
Gunslinger! I chomped on some DIA 240 puts expiring today at the high this morning! 🙂
I remember Tim Knight saying a few month’s back that the banksters had so screwed up the markets that not even he was going to like what happened when the coming bear market finally arrived…
This reminds me of another song…”it’s the end of the world as we know it!!!”
BOOM!!! A clean hit on the 200 day (daily) SMA. Is it time for Johnny????
I have SPX at down over 11% since the ATH…
I bgt a big wad of UPRO right after the initial hit at 2540 for a nice bounce cash collection. RRRRRINGGG….
I feel like we’ll hit the 200dma one more time and maybe even venture a little bit below. That bounce was wayyy too robotic.
Yeaaaa…at some point though, the buyers are going to flood back in. Stuff is “cheap” (relative to a week ago!!!) all over the place. And the market is already sold off over 10%. While A=C pointing to another 100 points down is possible, I have trouble seeing that at this point. The 1.27 extension of the initial A wave down is just a bit below, roughly 2515. That’s would be another major support/decision point, if the 200 MA falls.
FWIW I’m saying I expect just one more venture slightly below the 200dma (~10-20 points) followed by a stronger reversal. I have the 200dma at 2539 so I don’t think we quite got there. I also feel like there wasn’t enough volume and VIX is still venturing too close to the highs to be able to say that was it.
Sounds good to me Bo! I’m long after cashing once, but in the red on this second try. I do have the sneakly suspicion I would regret bailing with a small loss…but discretion has definitely been the better part of valor in this market for the last week!!!
Yep. Lots of traders and algos eyeing it…
DJI lagging the tag. Maybe plays catch-up?
Wow! Call options are SKY HIGH. The are expecting one helluva bounce!!! 🙂
Right on schedule, downside break from futures triangles…
UVXY facing resistance at 200 day sma…
We should be getting close…perhaps one more dive?
Oh bottom, where art thou???? The 200 ma beckons below….
When are we expecting Lara’s 2449? Next week?
looks like it may not happen now
Hey Rod, time to start thinking about payback for that XIV ambush! 🙂
I am holding tight right now to the cash on the sidelines. I will be ready to deploy I think when we get past 2520 with a red VIX inside the BB. So perhaps late today or Monday morning.
I am also trying to identify a five wave up on the 5 minute chart with a 3 wave correction. I don’t see that yet.
Smart! Plenty of time to settle old scores! 🙂
I am starting to load UVXY bear call spreads…
This reminds me of an ancient diddy…
“I’m just sittin’ on a fence! You could say I’ve got no sense!…”
Lol!
VIX signaling the All Clear! 🙂 🙂 🙂
Someone must have pushed the wrong button again!!
Hyuk! Yep!
We should get our interim low sometime today. Don’t you just LOVE beating the banksters at their own game??! Man that was fun!!!!
Do you realise DJI travelled 600 points from spike open to spike low?
You could smell this one a mile away!
Key to scalping these kind of manic moves is to open a STC order IMMEDIATELY after getting filled. You can collect an awful lot of market makers’ scalps, pun intended! 🙂
Verne, what do you mean by STC? Trailing stop?
STC is “Sell to Close” A trailing stop is just an order to sell a position if price falls by a pre-specified amount. It can be a percentage, or it can be points. For example if I execute a trailing stop of 1 point for a stock ( or option) I bought for 10.00, the stock will automatcally sell if price falls to 9.00. If price jumps to 13.00, my stop “trails” the move and automatically adjusts to 12.00 to protect my profit. One HUGE caveat. Price can and sometimes do (thanks to crooked market makers) gap past stops and if that happens you get filled at the best price BELOW your stop…unless you included a LIMIT price in your sell order, always a good idea!
I understand all that about trailing stops and limits, etc. I’ve just never seen the term STC before.
Is that pretty much just another name for a market order to get out quick, expecting the short-term momentum of a spike has given you a gain?
It is just another acronym “like good till cancelled” ( GTC).
Got it. Thank you!
If we look back to what preceded previous bear markets, Lara has consistently spoken about market breath giving at least 4 months of negative divergence as new highs are made. Another thing that happens is for about 6 months volatility picks up significantly.
It is my guess that what we have witnessed over the past week + is the tremor before the real earth quake. We will have a few more tremors before the final top. This volatility can be a trader’s friend. If this is all correct, and that is a big if, the final top and earth quake to follow will be devastating. Shock and awe as the military likes to call it.
Fasten your seat belts.
Exactly.
I know there are some members here who disagree with me and Lowry’s about AD line divergence, and that’s okay. It may not happen.
But I’m going to go with expecting this time will be similar, and not completely new, to what has happened in the last almost 100 years.
Chris Ciovacco’s last weekly video covered some ideas of volatility approaching the end of a bull market. And when he showed his charts all I could see was a series of fourth waves of increasing size toward the end of the bull markets.
Looking at the chart of current movement just prior to this decline which began last week, it looked more like the middle of a third wave than the end of a fifth wave.
If that all makes sense….
As some of you probably guessed, I shorted the H-E double tooth picks out of that gap and trap. I don’t post those as I now realise some folk with less risk management experience might follow my example. TRIPLE!!! BOOYAH!
If you took the hint and smacked em good, good for you!!!
A new low for the correction ~ 2569. If we can close above 2620 or so, and VIX is red closing inside its BBs, that would be a good clue as to at least a more temporary bottom in place followed by a nice rally.
WWWWWEEEEEEEEEE!!!!!!!!!!!!!!!!
Goodniiiiiiight, Irreeeeeeeenee!!!!
As Verne has been saying…down to the 200 daily MA!!! Getting closer and closer. I have it around 2540….
We still have a non-confirmation of the new low from VIX. That could change of course. But as of right now, it is not.
As you would say Kevin….”WHAM!!!” 😉
Every now and then, the smart thing to do is SOH.
I think I know where this is going but it does not hurt to be patient and let Mr. Market show his cards…
Absolutely amazing cash dump in DAX to defend the 12K pivot. Wow!
Futures still looking like some kind of triangle still in play. Tough to see a turn around in the cash session without futures also breaking to the upside…
I believe the hourly main just got invalidated with the upside action. As counted, the 4 up just intruded into the price domain of the 1 down.
The downtrend line on yesterdays downmove hasn’t been violated yet, and is key as I see it.
This…
One revised way of counting the downmove now is as a complete 5, with this morning’s bounce being a 1 and a 2 likely underway now….
Now this perhaps.
This is also consistent with Rodney’s VIX assessment of the downmove being a complete 5. Waiting for the trend line to go and 8/34 ema’s to cross positively….I’ve closed small short and waiting patiently for a decent long signal. This “should” be a momentus opportunity to get long…if indeed the ABC 4 wave down is over. Though I’m doubtful the 4 is over; I fully expect a large triangle to play out now, to “fill the time” required for such a large 4 (it’s filled the price dimension already!!). If correct, the let up here should be large and profitable. But first things first…where’s the BOTTOM??? And anyone have another count that says the current 5 wave down is NOT done here???
Looks like we have a “Gap & Trap” unfolding! 🙂
It seems to me it would have been far better to let this baby find a new low this morning so we could get it over with. Another fade of this ramp is going to make a lot of folk nervous about going into the weekend exposed….VIX going nowhere in a hurry….
Major resistance around 2615-16, a couple of retrace fibo’s and the swing low from mid-day Thursday. I’ve taken a small short off that, following Lara’s lead that the lows aren’t in here overall. We’ll see! It’s a crazy market.
Perhaps today we’ll get the most shocking thing of all: a small range day!!! Lol!!
Can you believe it?
They did it again!!
Ramped it higher out of a triangle entered in a downtrend!! You know what to do! Funny!
Well it turns today! The Signal?
This headline!
“Gartman: “A Full-Fledged Bear Market Is Upon Us; We Added To Our Short” “
He!He!
He is a sly one! 🙂
Most smart traders don’t announce to the world their positions….of course we are family here so that doesn’t count! 🙂
The green in futures is a bit amusing. What exactly are they trying to prove I wonder? Don’t the dummies know we need a new low? Oh I get, WE are supposed to be the dummies! 😀
Spot on today Verne!
🙂
I never trade on rumors but it does not hurt to keep your ears to the ground. About two weeks before the vol trade blew up word was that a few hedge funds got together. ‘Nuff said!
I am still very curious about the relatively benign response of the inverse UVXY.
Don’t get me wrong. It has started to awaken, but it has not yet exploded. The last time market traded at these levels around November 29 last year UVXY was trading at less than half its value today, so there is certainly something stirring. Of course VIX is also much higher so it will be interesting to see of they start to diverge.
Definitely worth keeping an eye on! 🙂
Quite a bit of futures whipsaw. Looks like yet another triangle of some sort. Last time I was wrong about the break as it temporarily bolted to the upside before resuming downtrend as sometimes happens. We should put in a new low out of it.
Verne, you called it today. You were looking for the new low and nailed it. That insight + Lara’a target gave me a huge advantage today. I was anxious to get long, tempted to chase the open, but waited until we broke 2,550.
Thank you.
Although I expect a bottom in the a.m., I could be wrong. Overseas markets shed some of their substantial losses so things could be getting ready for a nice bounce or trend change. This market is on a knife edge, and warrants great caution in my humble opinion. The count calls for lower prices so even if we get a nice bounce today, we could
still wake to more carnage on Monday. A red VIX today, hopefully a very fat candle, would be auspicious for the immediate bullish case. If it hangs around the current high or closes green we probably don’t see an interim low till next week.
Interesting how we have these mega sell offs right before the change of guard at FED. We had the same thing when Berneke was replaced with Janet and now Janet getting the boot. I guess this is how the new chair establishes the control by showing that he/she is the saviour markets have been waiting for…US FED doesn’t care for money as far as pumping into the markets as entire world is hooked on to the USD and there is no desire or option to correct this dominance (at least near term 5-10 years).
Verne, I’m gonna take a little bite on bull put spreads on XLU, DIA, and IWM next week expiration.
Way too funny! Bull put spreads is EXACTLY what I am doing, for obvious reasons!!!
🙂
I like my Juice in the morning…..finally some nice premiums!!!
The 30 Year US Treasury is at a 3.14% Yield (Close Yesterday) and this morning 3.13%.
Everyone is screaming about interest rates going materially higher focusing on the 10 Year US Treasury. Focusing on that doesn’t tell you anything about where longer term Yields are going from here! This 10 Year is the most manipulated Bond on Earth. It tells you ONLY the narrative that they want to suck you into believing so that they can put their trades on to make serious money!
The REAL and ONLY signal that will 100% confirm that interest rates will break out of the upper end of this range to new higher levels and new higher range is the 30 Year US Treasury. This is Based on 40 Years of personal experience in this area.
Watch ONLY this one and ignore all the other Loud NOISE!…. This is the Test!
If 30 Year goes above a 3.26% Yield… and when it does the Yield also accelerates and spikes higher (3.40-3.50) in the blink of an eye. ONLY then do you have 100% certain confirmation of a new Higher Level Range of longer term Yields! That higher range will then be carved out over the following 12 to 18 months.
That 30 Year Yield has been repelled many times in the high teens and very low 20’s. It has NOT painted 3.26% yet since it’s historical low has been recorded.
So let’s see what happens this time! The Treasury Yield Curve will continue to Flatten until proven otherwise and that proof is the EXACT test above!
Great point Joseph. I am short TLT and expect it to go to 100. I have a wide stop as I think it could whipsaw…
Lara – Thanks for publishing the alternate. It is scary.
The world is scary enough when the market is at all time highs. Ugh.
I appreciate all of the analysis. Great insights from everyone. I’ve been able to stay in the black or limit most losses even though I’ve been wrong.
This is pure speculation, but the market seemed to have a visceral reaction to the proposed budget. All of the debt from the new tax bill coupled with the new debt from the proposed bill was simply too much. It was reflected in higher rates. Then, the bill didn’t pass and markets seemed to applaud it. Perhaps sending govt a message that they finally need to start making some tough decisions. I hope it works. Maybe we have some relief until the next bill comes. But it seems like bond market won’t absorb any more debt.
I am confused – can anyone tell me why the attached Stockchart already shows a lower low on the hourly?
Stockcharts shows the closing price only, not the futures action… 2581 was the closing cash price on the SPX today at 4pm Eastern…
In the cash market, the SPX did make a lower low. The previous low you see in other charts down to 2530 is in the futures markets established after market close on Monday Feb 5th…
Thank you Ari for clearing that up for me
Hi Bo:
Just wanted, in case you missed, it to let you know I posted a reply on the previous thread. 🙂
Another analyst who like me, has been bearish, and admittedly wrong, (and bewildered) for some time, give a rather poignant perspective of what if felt like to be in the minority for so long, but also shares some keen interesting insights as what has informed the thinking of some of us on the so-called “dark” side.
https://www.tastytrade.com/tt/shows/trading-the-close-with-tim-knight
Yep… Trying to catch the Top for 3 Years…
I was positioned perfectly May/June 2015 for what started in Aug 2015 to early Feb. 2016. Nope… It STOPED a hair before confirmation and turned backed up (Thanks to the Fed / other CB’s and PPT).
Then I continued as Bearish… through end of December 2017 trying to catch the top again… but each time it didn’t follow through down long enough to make any money, it turn around on a dime each time. AT each major event tease!
Then the Thursday/Friday of the crazy highs… For the 1st time I didn’t position like I had done for the period above. But… This time it followed through enough down for me to have made some serious money on the short positions I would have put on.
I just hope its not the Really Big one I had been planning for and taking shots at since 2012. This is the Bear Case that I firmly believe in and have since 2012. It’s the one that makes sense to me based on everything I know and have known. The adjustment period before the Trump USA Investment revival actually takes hold (The Physical Plants going online are not built & operational yet).
Now that Alternate Weekly count re-surfaces!
For my sake and sanity… I hope the main weekly is in play!
10%+ Corrections are now recorded! SO the main weekly is free to take hold, if that is what will actually play out!
For newer people, I am not a day trader like most who post here. I am more of a swing trader… 1 week to a couple of months is how I position.
I hear ya man. Most people don’t seem to comprehend how 21 TRILLION of central bank liquidity can distort markets. Of course those of us who were alarmed at what was going on as we literally watched, as traders and in real time, every single attempt of the market to correct being violently arrested, were completely wrong in our thinking it could continue for as long as it did. In my humble opinion, no thinking person who understood the context in which this bull run was taking place could help but be cautious, even though it continued for so long. It took me a long time to fully trust Lara’s counts.
How long did you guys have to putt up with my constant yapping about skewed vol before XIV and SVXY blew up? Exactly! A LONG time, but blow up they did. Folk, it was INEVITABLE.
On the question of historic market behaviour we also need to be very careful. I kept thinking to myself every time I heard that argument: “But we have NEVER (look at vol for example) been in a market environment like the current one, so it could be a fatal mistake to think it will necessarily behave like prior markets”
Here is another intetesting illustration. I am sure many of you have heard of the “January Effect” as regards the market, which simply states that price action in the first two weeks of the month is a good predictor for the rest of the year. This has been statistically reliable and this January has been one of the most historically spectacular on record. Despite that remarkable fact, we are now about to conclude in February, the WORST week of market performane ever!
Something recently happened that truly stunned me. Sven Heinrich, known as Northman Trader, who is one of the abelest technical analysts out there documenting the remarkable distortions in the market, threw in the towel. I guess the relentless ridicule he endured finally got to him. He no longer calls himself a bear, but “neutral”. I hope he was able to distinguish being bearish, with sucessfully trading a bullish trend. There is a HUGE difference, and the two are not incompatible, which I can certainly attest to. Was Sven’s capitulation the ultimate contrarian indicator? Interestingly enough, it came one week before the vol trade he had been talking about for over a year finally blew up!
Trade Safely.
I forgot to add:
For the alternate idea, the short term picture on the hourly chart would be mostly the same. A-B-C of a zigzag subdivides 5-3-5, which is exactly the same as 1-2-3 of an impulse.
The alternate would see an impulse unfolding lower.
The low of minor A at 2,593.07 would become the price point which differentiates the two ideas after the next wave down may be complete. For an impulse that would be the end of wave 1. The correction for wave 4 can’t move above that point.
Analysis that once again demonstrates why Lara is the best in the business in my humble opinion.
Precise.
Thorough.
Flexible.
Nimble.
None of us should be loosing money following her analysis and trading advice. Just one man’s opinion.
My goodness, thank you very much Verne! Coming from someone with as much experience and trading skill as you, that means a lot.
maybe 2718 was the top of wave C .. B wave ? we did 5 down today bounce 2650 to 2667 ish wave 2 up …then down.. Or Higher might mean wave B is not over 2761 .. good luck
I like the handle Doc…! 🙂
No wabbit again 😉
Je Suis La!