
Price has moved sideways to complete an inside day and close as a doji.
Summary: A new alternate expects sideways movement for possibly up to another 22 sessions. If price remains above 2,327.58, this possibility will remain valid.
The main wave count still expects a deeper pullback here to 2,299 – 2,297, which may be reached in a very few days.
New updates to this analysis are in bold.
Last monthly and weekly charts are here. Last historic analysis video is here.
MAIN ELLIOTT WAVE COUNT
WEEKLY CHART
Click chart to enlarge.
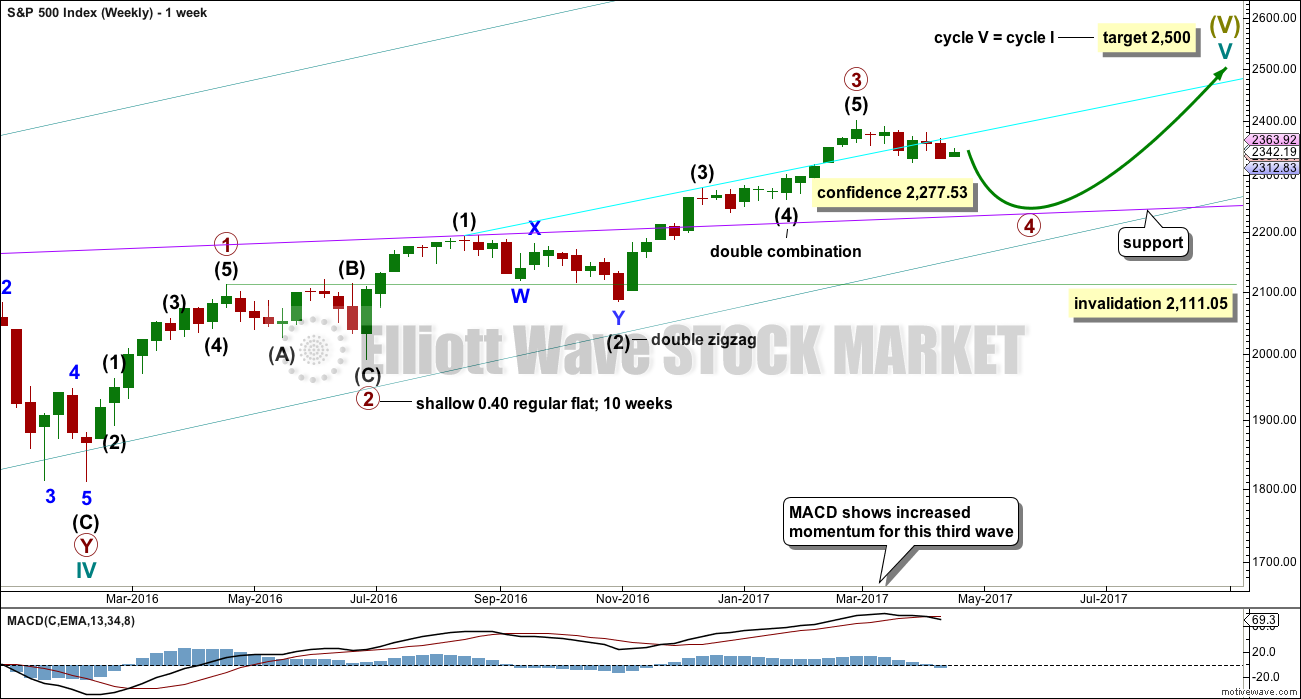
The degree of labelling within primary wave 3 is here moved up. It is possible that primary wave 3 may be over.
The alternate idea which moves the degree of labelling within primary wave 3 down and sees only minor wave 4 within it now complete also remains valid. However, at this stage it is judged to have a low probability and will not be published.
There is another idea which sees only intermediate wave (3) within primary wave 3 complete (thank you to our new member Peter for emailing me his chart) and intermediate wave (4) now continuing.
At this stage, I will follow these ideas but publish only one, primary wave 4. If the alternate idea of intermediate wave (4) begins to diverge substantially in terms of direction expected, then it will be published.
Primary wave 4 may continue lower.
To exhibit alternation with primary wave 2, primary wave 4 may be most likely a single or multiple zigzag. It may also be a triangle.
Primary wave 2 was a flat correction lasting 47 days (not a Fibonacci number). Primary wave 4 may be unfolding as a double zigzag. It may total a Fibonacci 34 or 55 sessions. If it totals a Fibonacci 34 sessions, it may end next Friday.
Primary wave 4 may not move into primary wave 1 price territory below 2,111.05.
DAILY CHART
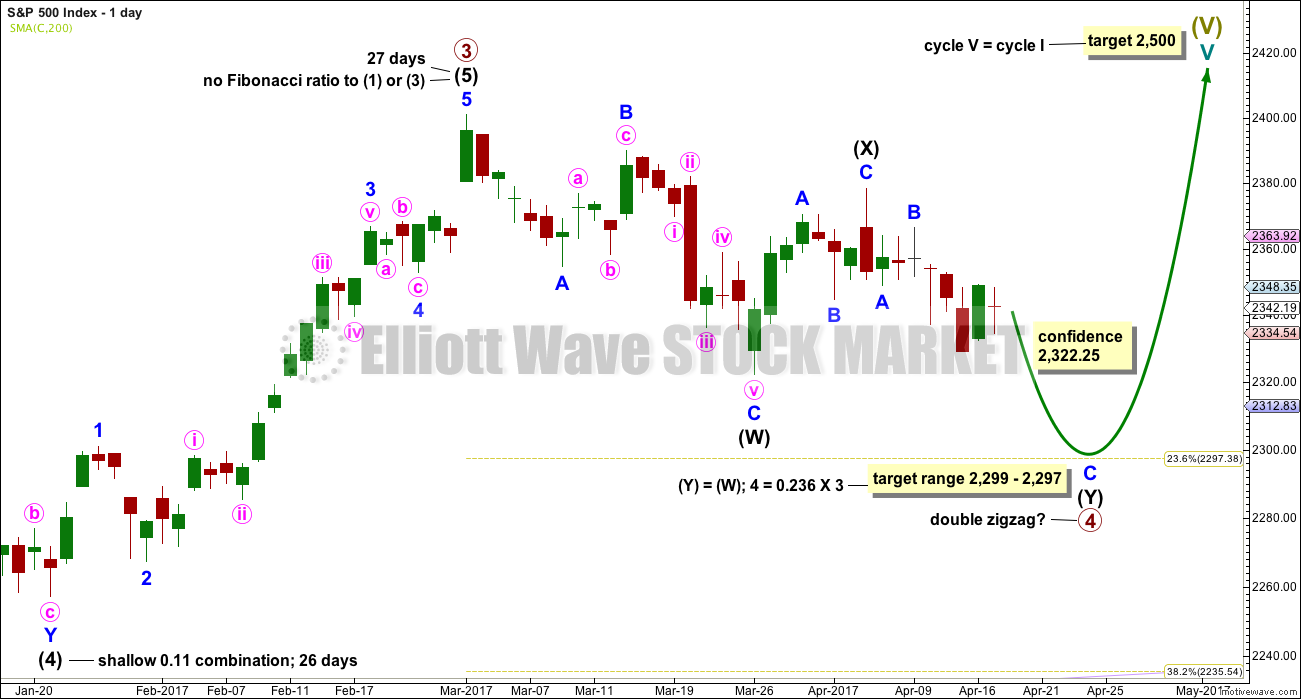
Click chart to enlarge.
Within double zigzags, the X wave is almost always brief and shallow. There is no rule stating a maximum for X waves, but they should not make a new price extreme beyond the start of the first zigzag in the double.
X waves within combinations may make new price extremes (they may be equivalent to B waves within expanded flats), but in this instance primary wave 4 would be unlikely to be a combination as it would exhibit poor alternation with the flat correction of primary wave 2.
For this wave count intermediate wave (X) may now be complete.
If a new high above 2,400.98 is seen, then this wave count would be discarded.
The correction for primary wave 4 should be a multi week pullback, and it may not move into primary wave 1 price territory below 2,111.05.
A target is calculated for primary wave 4 to end based upon primary and intermediate degrees. This target would see primary wave 4 end just short of the fourth wave of one lesser degree price territory, that of intermediate wave (4) which has its range from 2,277.53 to 2,233.62. If the target at 2,299 – 2,297 is wrong, then it may not be low enough.
HOURLY CHART
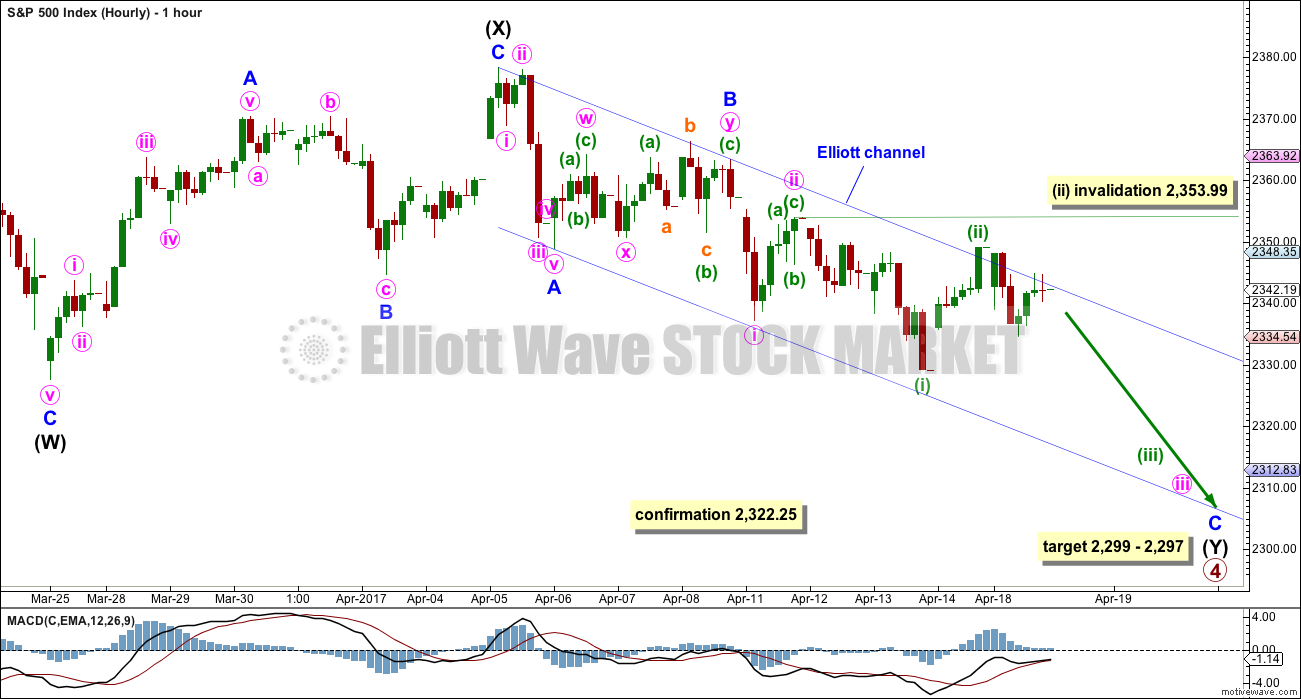
Click chart to enlarge.
The second zigzag in the double is labelled intermediate wave (Y) and minor waves A and B may be complete within it.
Minor wave C may be underway, unfolding as an impulse; the structure looks incomplete. The strongest portion of minor wave C may yet be ahead.
Minor wave C must complete as a five wave structure. It may find support about the lower edge of the Elliott channel.
When minuette wave (iii) is complete, then the following correction for minuette wave (iv) may not move into minuette wave (i) price territory above 2,341.18.
ALTERNATE ELLIOTT WAVE COUNT
DAILY CHART
Click chart to enlarge.
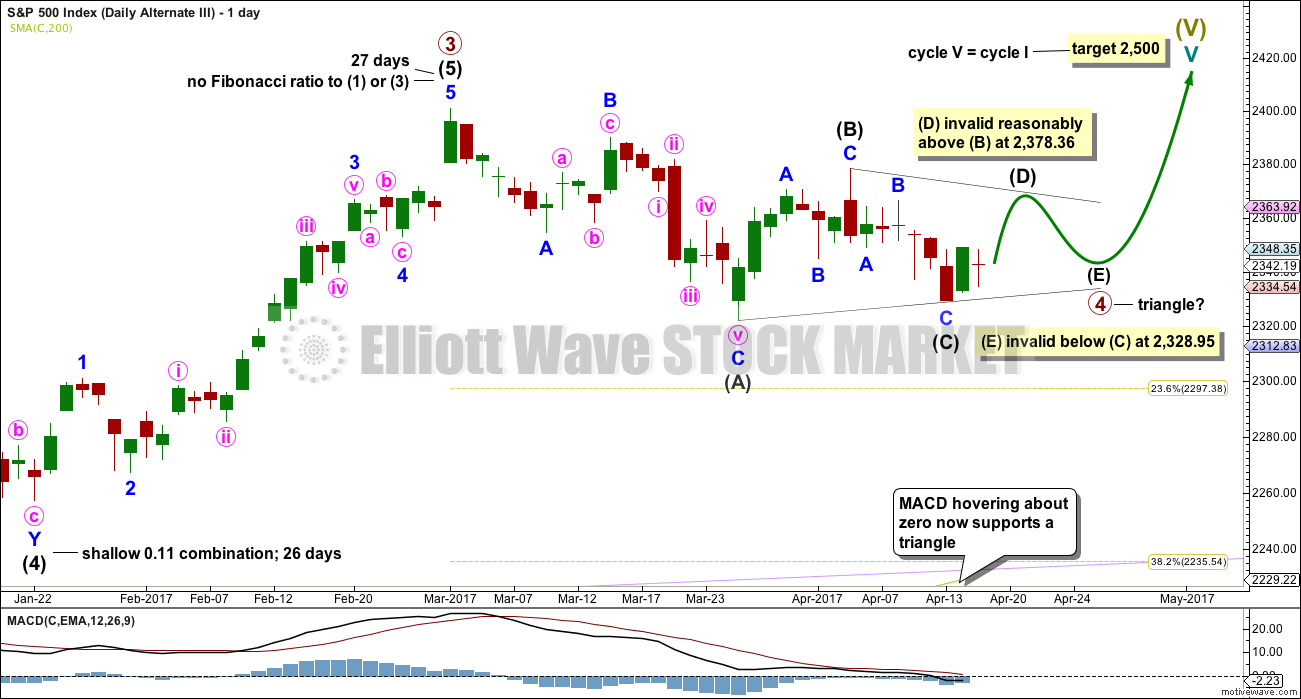
This wave count is new. It looks at the possibility that a large regular contracting triangle may be completing for a fourth wave. This may be primary wave 4, but it may also be intermediate wave (4) within primary wave 3. Both ideas would have subdivisions labelled the same way and both ideas would see the triangle incomplete.
This idea is now supported by MACD hovering about the zero line as the triangle unfolds.
There would still be adequate alternation between the shallow 0.40 expanded flat of primary wave 2 and the more shallow triangle.
Primary wave 2 lasted 47 days. Triangles are some of the longest lasting corrective structures. So far this one may have lasted 33 days. It may end in a total Fibonacci 55 days.
A contracting triangle may not have intermediate wave (D) move beyond the end of intermediate wave (B) at 2,378.36.
A barrier triangle may have intermediate wave (D) end about the same level as intermediate wave (B) at 2,378.36; as long as the (B)-(D) trend line remains essentially flat the triangle would remain valid. In practice, this means that intermediate wave (D) can move a little above 2,378.36. This is the only Elliott wave rule which is not black and white.
For both contracting and barrier triangles, intermediate wave (E) may not move beyond the end of intermediate wave (C) below 2,327.58.
HOURLY CHART
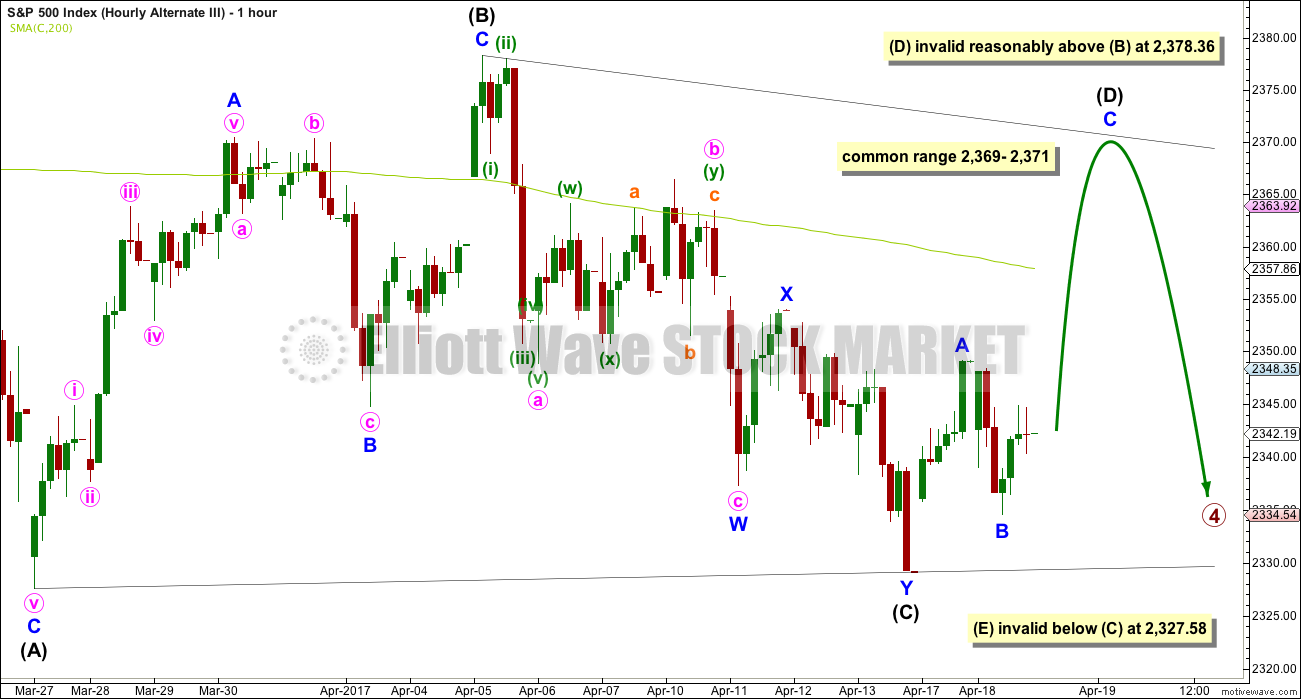
Click chart to enlarge.
The subdivisions of most recent movement are essentially the same.
If a triangle is unfolding, then intermediate wave (C) should be over now. To try and see it move any lower would mean the (A)-(C) trend line would not have sufficient slope for the right look.
A new low below 2,327.58 would invalidate this triangle idea in favour of the main wave count.
If price continues sideways, then this triangle would increase in probability.
TECHNICAL ANALYSIS
WEEKLY CHART
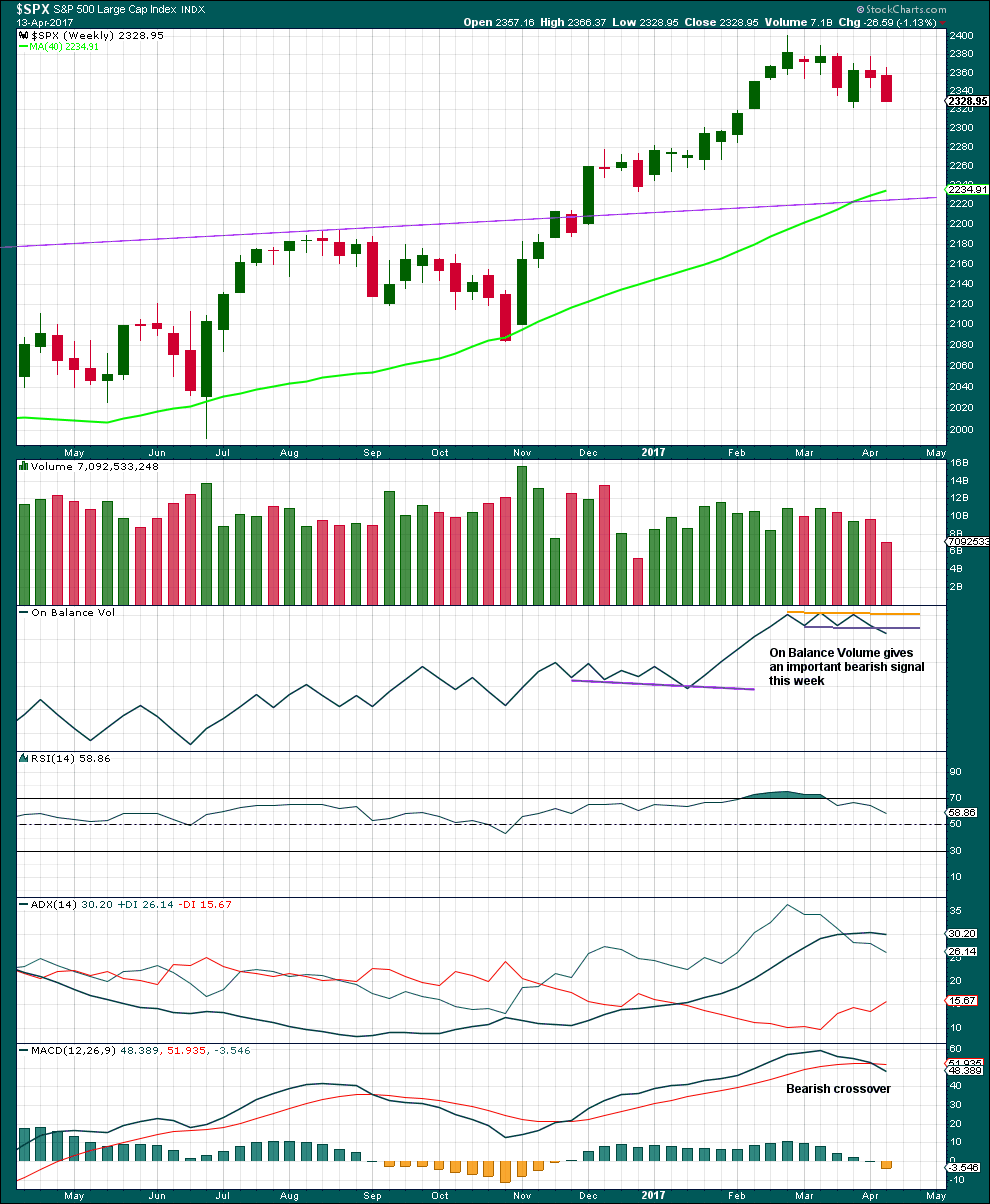
Click chart to enlarge. Chart courtesy of StockCharts.com.
Although a strong downwards week has lighter volume, because last week was a short week this should not be read as bullish.
The signal from On Balance Volume should be given weight; it supports the main Elliott wave count. In conjunction with MACD, this is overall a fairly bearish weekly chart.
DAILY CHART
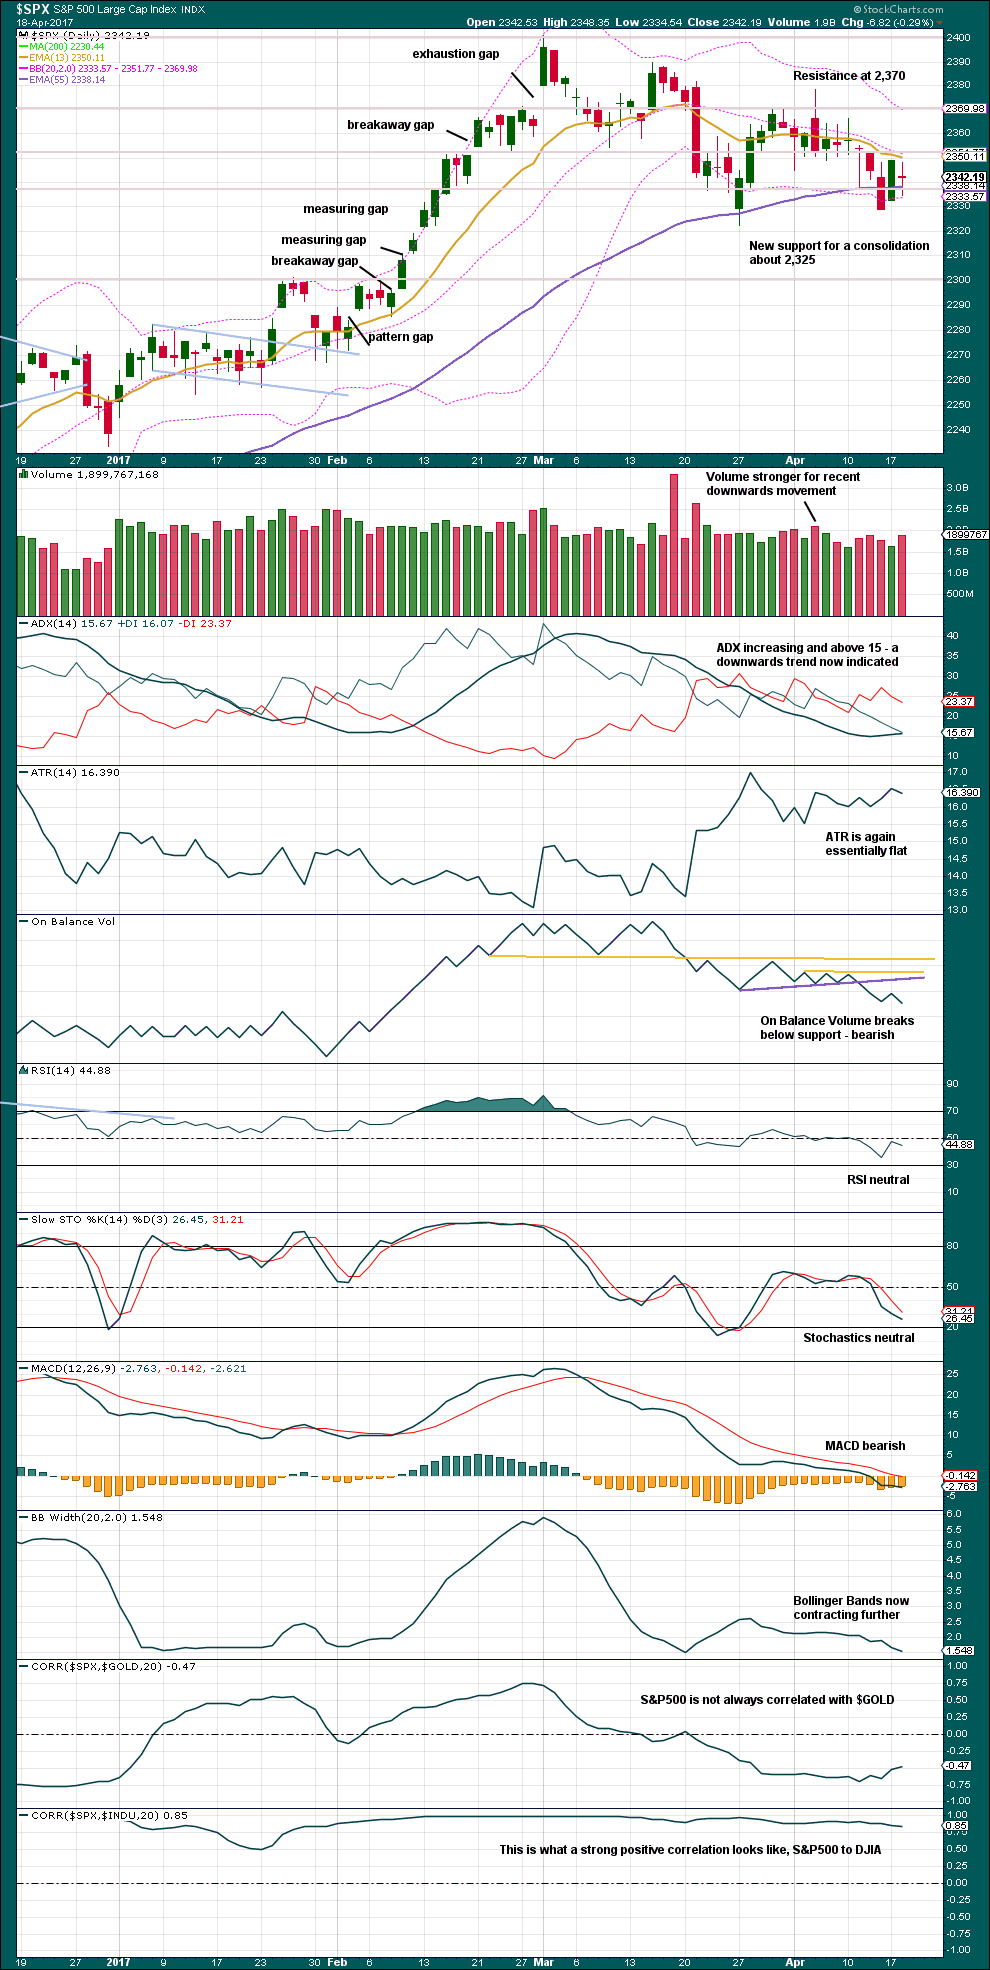
Click chart to enlarge. Chart courtesy of StockCharts.com.
This chart remains overall bearish with some neutrality.
Volume, On Balance Volume, and ADX support the main wave count.
ATR and Bollinger Bands could be interpreted to support the new alternate.
VOLATILITY – INVERTED VIX CHART
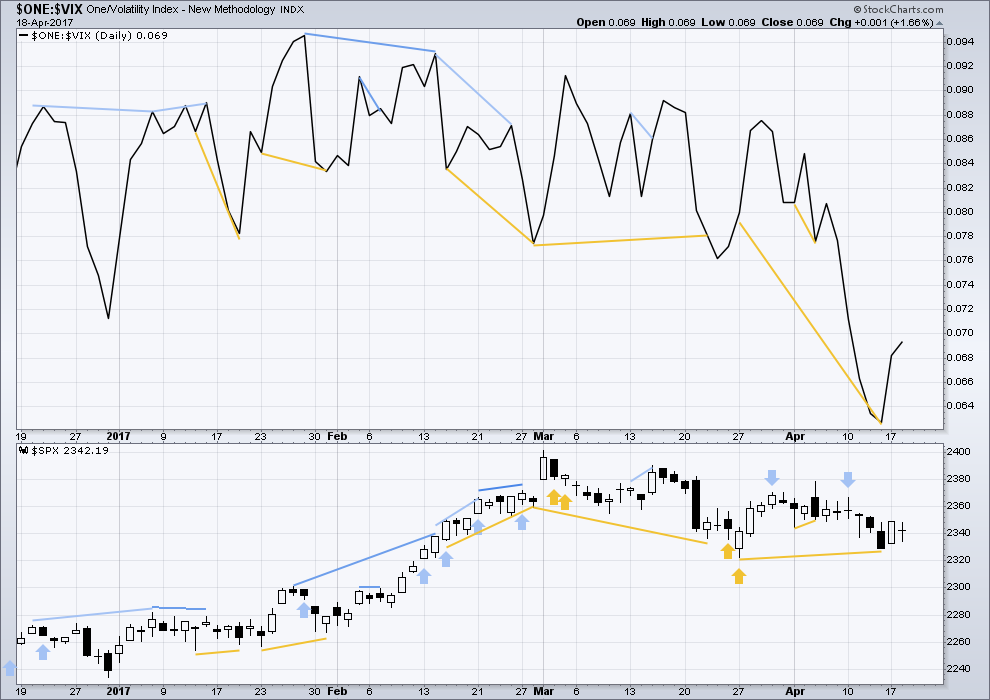
Click chart to enlarge. Chart courtesy of StockCharts.com.
Normally, volatility should decline as price moves higher and increase as price moves lower. This means that normally inverted VIX should move in the same direction as price.
It is noted that there are now six multi day instances of bullish divergence between price and inverted VIX, and all have been followed so far by at least one upwards day if not more. This signal seems to again be working more often than not. It will again be given some weight in analysis.
There is no new divergence today noted between price and VIX.
BREADTH – AD LINE
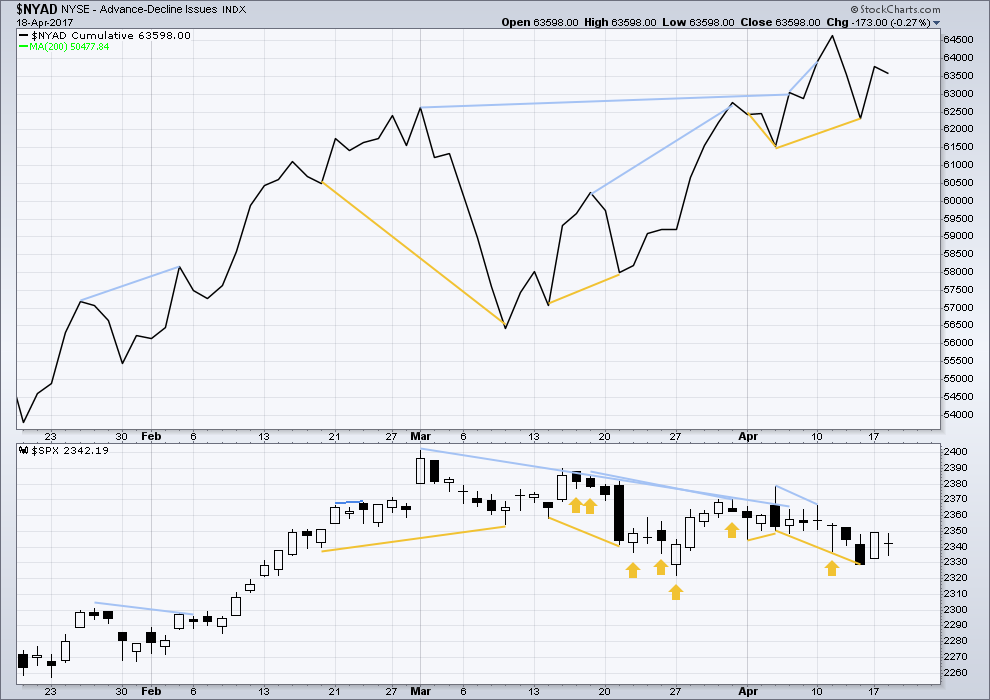
Click chart to enlarge. Chart courtesy of StockCharts.com.
The rise in price has support from a rise in market breadth. Lowry’s measures of market breadth do not at this stage warn of an impending end to this bull market. They show an internally healthy bull market that should continue for at least 4-6 months.
With today being an inside day creating no new low nor new high, no divergence can be interpreted for the AD line to price.
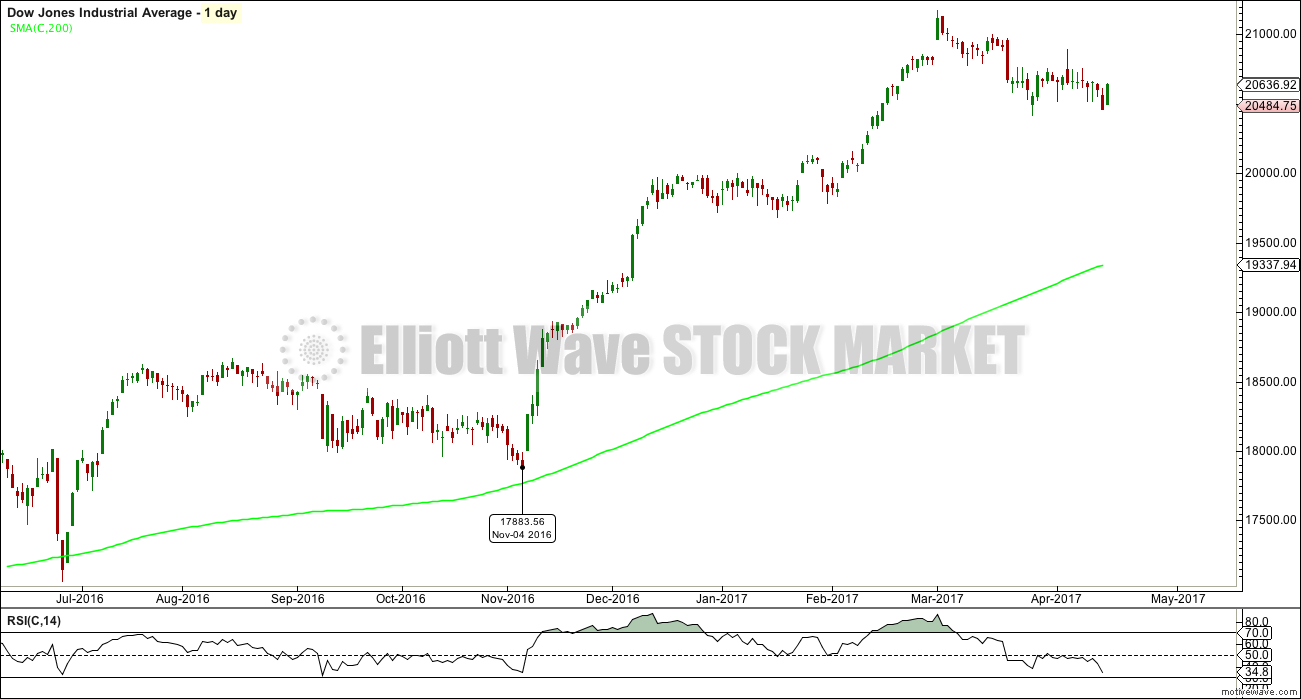
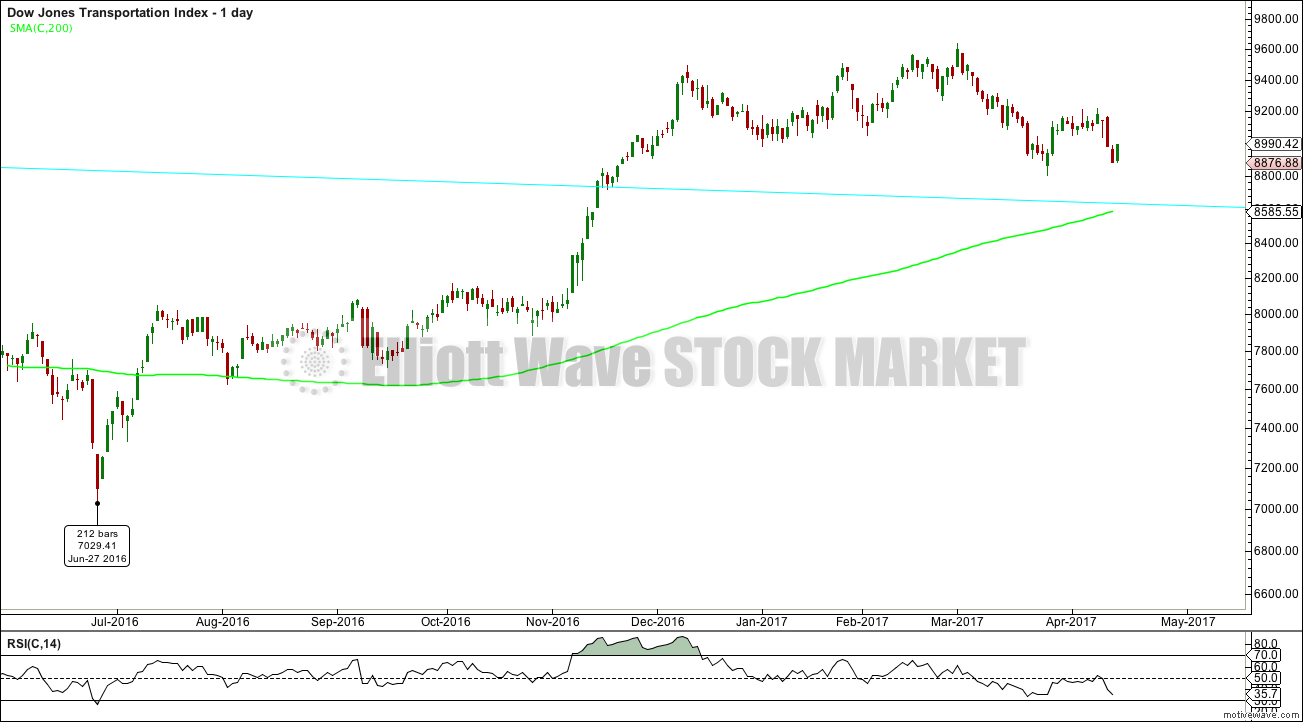
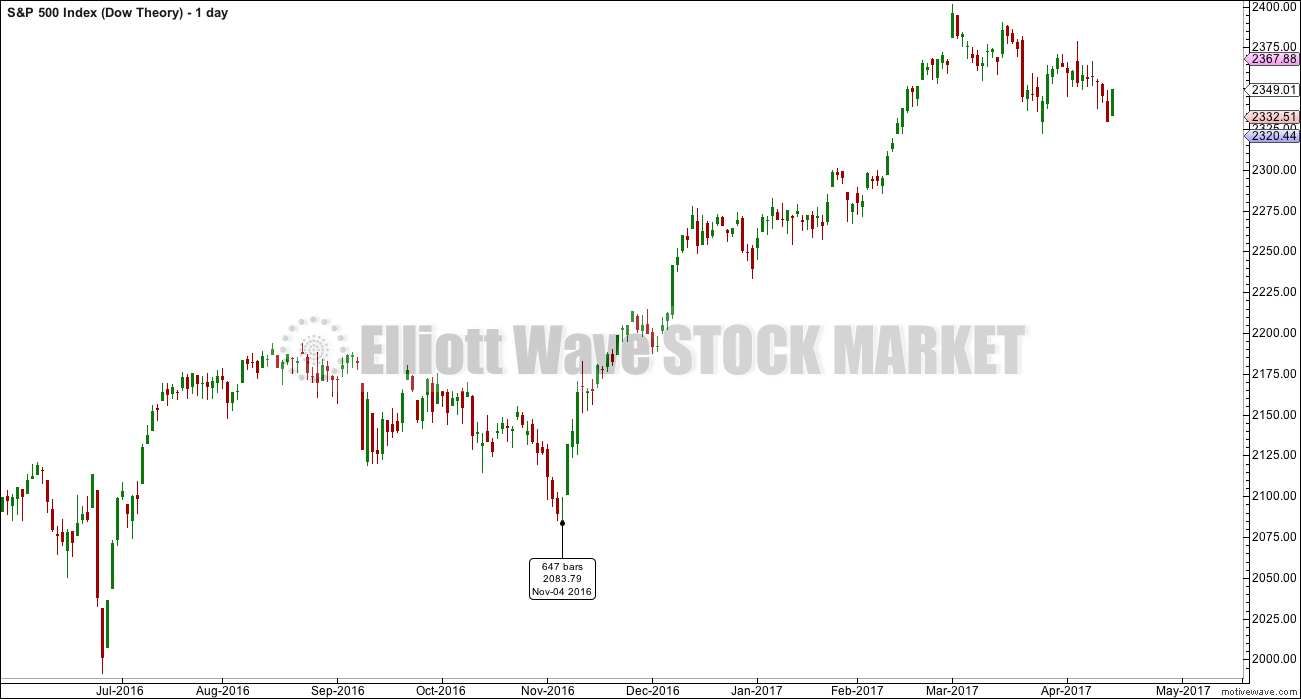
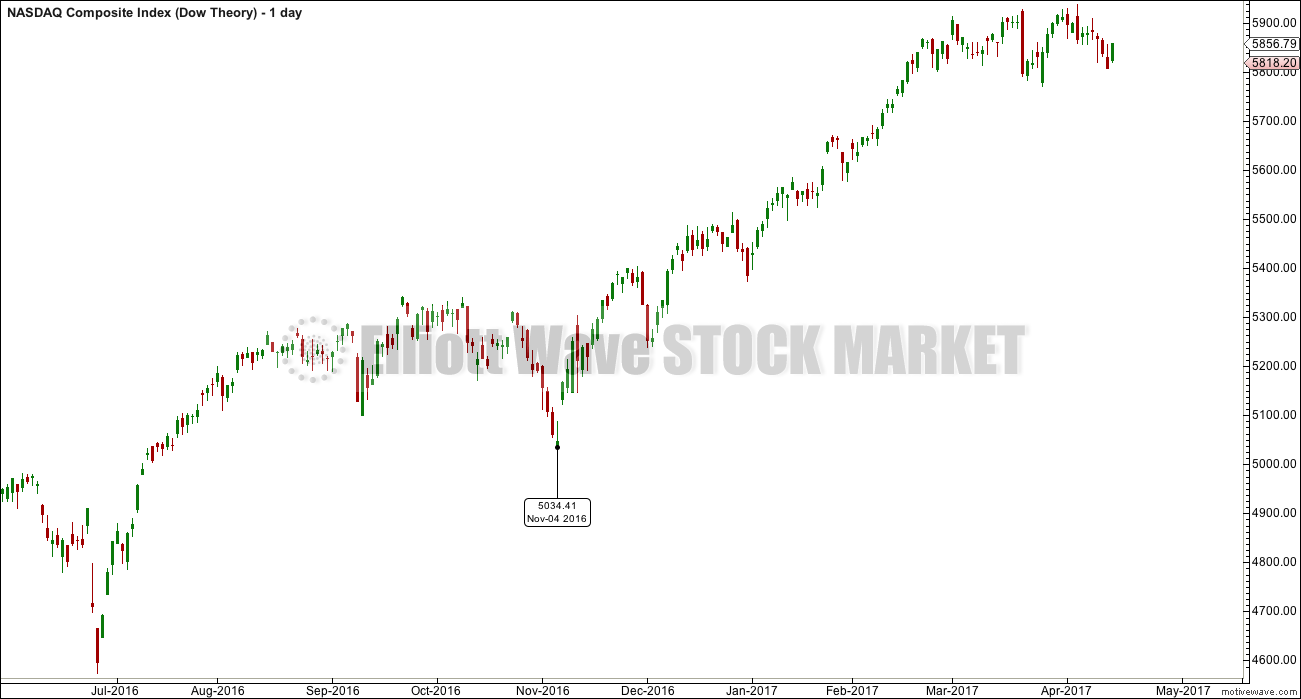
DOW THEORY
The DJIA, DJT, S&P500 and Nasdaq continue to make new all time highs. This confirms a bull market continues.
The following lows need to be exceeded for Dow Theory to confirm the end of the bull market and a change to a bear market:
DJIA: 17,883.56.
DJT: 7,029.41.
S&P500: 2,083.79.
Nasdaq: 5,034.41.
Charts showing each prior major swing low used for Dow Theory are below:
Click chart to enlarge.
Click chart to enlarge.
Click chart to enlarge.
Click chart to enlarge.
This analysis is published @ 10:55 p.m. EST.
Here is a good summary article of the recent CTA fee increase.
https://www.investing.com/news/stock-market-news/essential-stock-market-data-costs-to-soar,-trade-group-warns-475575
The next move higher in VIX should extend above the upper BB with some authority. I am looking for another long upper wick to signal the end of the current correction and start of the final wave up. It will present the best opportunity to short volatility this year, and probably the last…
I’m leaning more towards a big triangle wave count at this time. MACD indicates this may be the case, and it would explain the maddening behaviour of price lately. Sideways movement is so hard to analyse, all the little subdivisions in a bunch of threes….
Anyway, bottom line is this correction isn’t over. I don’t think I’ll be publishing that other alternate which sees a fifth wave up now underway, that looks increasingly wrong.
Any chance the movement off of the 2400 high could be counted as nested 1s and 2s? If we break 2322, that looks right to me.
Yes. But that would see cycle wave V most likely over.
I’m not going to publish anything that bearish while there isn’t any divergence in market breadth at the high of 2,400. And the EW structure of cycle V isn’t complete and doesn’t look complete at the daily, weekly or monthly chart levels.
We are living in strange times indeed. NDX is trading, not one, not two, but THREE standard deviations away from its monthly mean! This kind of extremism borders on out and out insanity. I know it sometimes feels like it but the principle of reversion to the mean has not been abrogated. It could be that a short trade on this index now represents the highest reward to risk ratio any trader has seen in quite some time. Holding May expiration 130 puts on triple Qs.
Crowded, Crowded trades in NDX. Also, my Bloomberg terminal no longer reports GAAP numbers, only adjusted earnings on Tech. Hmm……..
Well, well well! My Chris, you really are a serious player, Bloomberg terminal and all! 😀
Wish my wife also thought so…..:)
🙂 I hear ya…
Well, Verne and I think so 🙂
Much obliged
VIX sold very hard this morning and headed down, as I expected, for a retest of 200 dma. It never actually got there and has put in a long lower wick so far today. You know what to do…. 🙂
Really? No one ahead of me?
Nope. It’s all yours 🙂
Another very symmetrical 5 down from the high today…..
I can’t get that to fit as a complete five…. not with an extended first, third nor fifth wave. There’s too much overlapping.
Yeah i spoke too soon.
Look at the level that DJI broke prior to the close…!