
Price continues higher as expected.
Today, monthly charts are analysed and a new target is added.
Summary: The next target is at 2,858, and at about that point a correction to last about two weeks is expected. The trend remains upwards.
The long term target is still at 2,926. A new target is now at 3,616.
The biggest picture, Grand Super Cycle analysis, is here.
MAIN ELLIOTT WAVE COUNT
MONTHLY CHART
Click chart to enlarge.
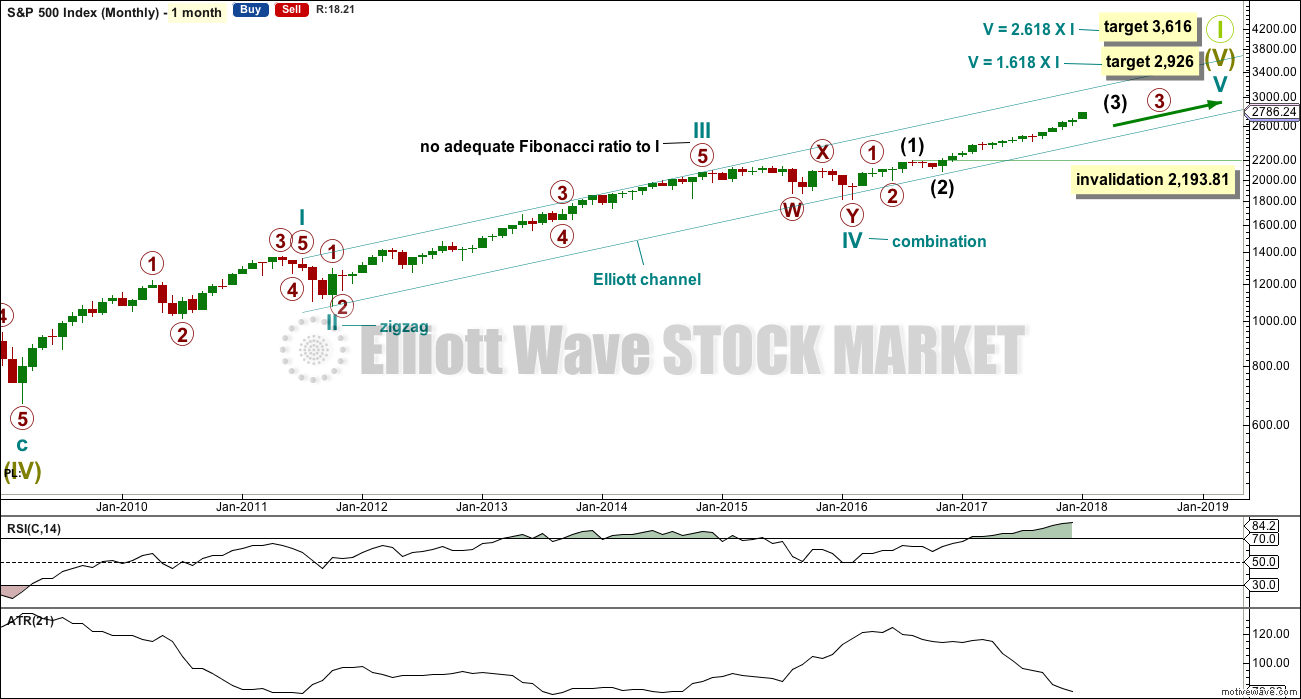
The large expanded flat labelled Super Cycle wave (IV) completed a 8.5 year correction. Thereafter, the bull market continues for Super Cycle wave (V). The structure of Super Cycle wave (V) is incomplete. At this stage, it is subdividing as an impulse.
There is no Fibonacci ratio between cycle waves I and III within Super Cycle wave (V). This makes it more likely that cycle wave V will exhibit a Fibonacci ratio to either of cycle waves I or III. Cycle wave V has passed equality in length with cycle wave I. The next two Fibonacci ratios in the sequence are used for two possible targets for it to end.
The teal channel is drawn using Elliott’s first technique about an impulse. Draw the first trend line from the ends of cycle waves I to III (from the months of July 2011 to December 2014), then place a parallel copy on the low of cycle wave II. Cycle wave IV has found support very close to the lower edge of this channel, so the channel looks about right. The lower edge should continue to provide support, and the upper edge may provide resistance if price gets up that high.
Copy this large channel over to weekly and daily charts, all on a semi log scale. The lower edge will be important.
Cycle wave II was a shallow 0.41 zigzag lasting three months. Cycle wave IV is now seen as a more shallow 0.28 double combination lasting 14 months. With cycle wave IV nearly five times the duration of cycle wave II, it should be over there.
Cycle wave I lasted 28 months (not a Fibonacci number), cycle wave II lasted a Fibonacci 3 months, cycle wave III lasted 38 months (not a Fibonacci number), and cycle wave IV lasted 14 months (one more than a Fibonacci 13).
Cycle wave V has begun its 23rd month. The structure needs several more months to complete. It may last another 11 months to total a Fibonacci 34, but that may not be long enough. The next Fibonacci number in the sequence is 55, which would see it continue from now for another 32 months, just under three years. That looks entirely possible.
It is also possible that cycle wave V may not exhibit a Fibonacci duration.
Within cycle wave V, the upcoming correction for intermediate wave (4) may not move back down into intermediate wave (1) price territory below 2,193.81.
WEEKLY CHART
Click chart to enlarge.
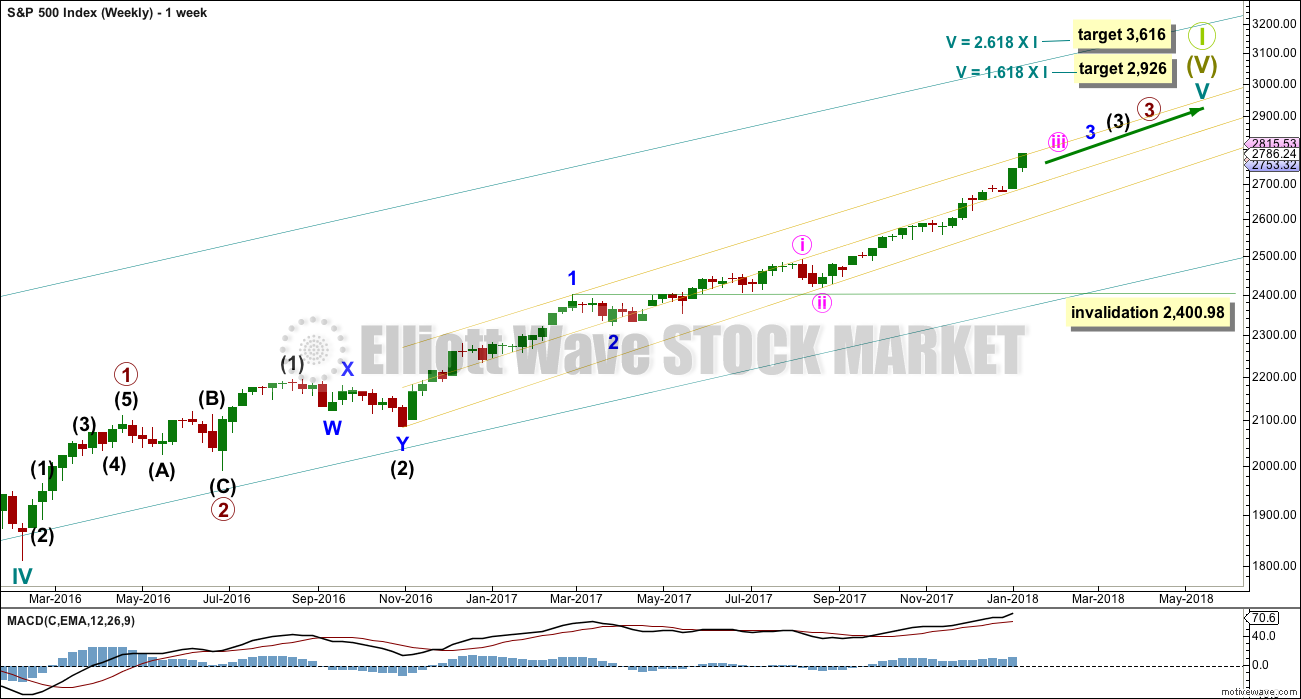
Cycle wave V must complete as a five structure, which should look clear at the weekly chart level. It may only be an impulse or ending diagonal. At this stage, it is clear it is an impulse.
Within cycle wave V, the third waves at all degrees may only subdivide as impulses.
Within cycle wave V, the corrections for primary wave 2 and intermediate wave (2) both show up clearly, both lasting several weeks. The respective corrections for intermediate wave (4) and primary wave 4 should also last several weeks, so that they show up at weekly and monthly time frames. The right proportions between second and fourth wave corrections give a wave count the right look. This wave count expects to see two large multi week corrections coming up.
Cycle wave V has passed equality in length with cycle wave I, which would be the most common Fibonacci ratio for it to have exhibited. The next most common Fibonacci ratio would be 1.618 the length of cycle wave I.
Intermediate wave (3) has passed equality in length with intermediate wave (1). It has also now passed both 1.618 and 2.618 the length of intermediate wave (1), so it may not exhibit a Fibonacci ratio to intermediate wave (1). The target calculation for intermediate wave (3) to end may have to be done at minor degree; when minor waves 3 and 4 are complete, then a target may be calculated for intermediate wave (3) to end. That cannot be done yet.
When minor wave 3 is complete, then the following multi week correction for minor wave 4 may not move into minor wave 1 price territory below 2,400.98. Minor wave 4 should last about four weeks to be in proportion to minor wave 2. It may last about a Fibonacci three, five or even eight weeks if it is a time consuming sideways correction like a triangle or combination. It may now find support about the mid line of the yellow best fit channel. If it does find support there, it may be very shallow. Next support would be about the lower edge of the channel.
A third wave up at four degrees may be completing. This should be expected to show some internal strength and extreme indicators, which is exactly what is happening.
DAILY CHART

Click chart to enlarge.
Keep redrawing the acceleration channel as price continues higher: draw the first line from the end of minute wave i to the last high, then place a parallel copy on the end of minute wave ii. When minute wave iii is complete, this would be an Elliott channel and the lower edge may provide support for minute wave iv.
Minute wave iii has passed 1.618 the length of minute wave i. The next Fibonacci ratio in the sequence is used to calculate a target for it to end.
Minute wave iii may only subdivide as an impulse, and within it minuette wave (i) only may have recently ended as a long extension.
Within the impulse of minute wave iii, the upcoming correction for minuette wave (iv) may not move back into minuette wave (i) price territory below 2,694.97.
Because minuette wave (i) with this wave count is a long extension, it is reasonable to expect minuette wave (iii) may only reach equality in length with minuette wave (i). This target fits with the higher target for minute wave iii one degree higher.
HOURLY CHART
Click chart to enlarge.
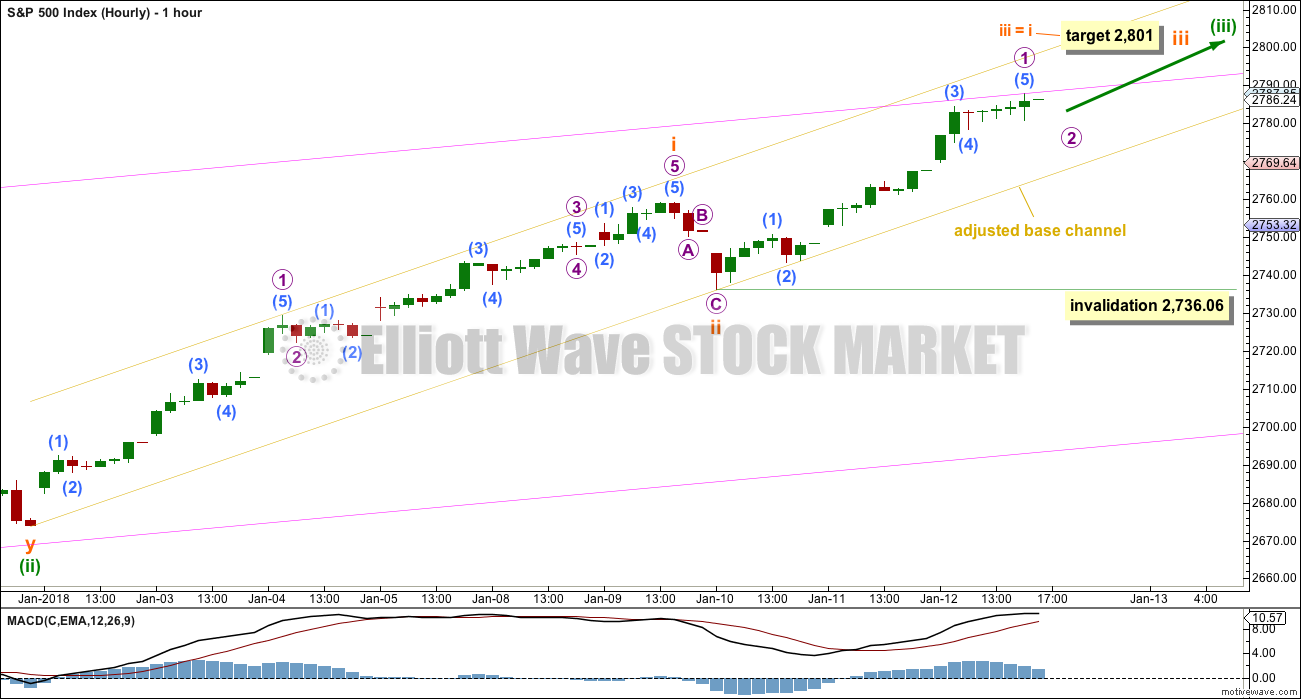
Always assume that the trend remains the same until proven otherwise. At this stage, there is no technical evidence for a trend change; we should assume the trend remains upwards.
The adjusted base channel is drawn in the same way. Look for the lower edge to provide support for corrections along the way up.
Momentum is increasing. This wave count expects that a third wave at six degrees is coming to an end (four degrees at the weekly chart level, and six at the hourly chart level now). Momentum may increase further.
Micro wave 2 may not move beyond the start of micro wave 1 below 2,736.06. However, it should find support at the lower edge of the adjusted base channel. If that channel is breached by downwards movement, then this analysis must consider the possibility that subminuette wave iii may be over.
TECHNICAL ANALYSIS
MONTHLY CHART
Click chart to enlarge. Chart courtesy of StockCharts.com.
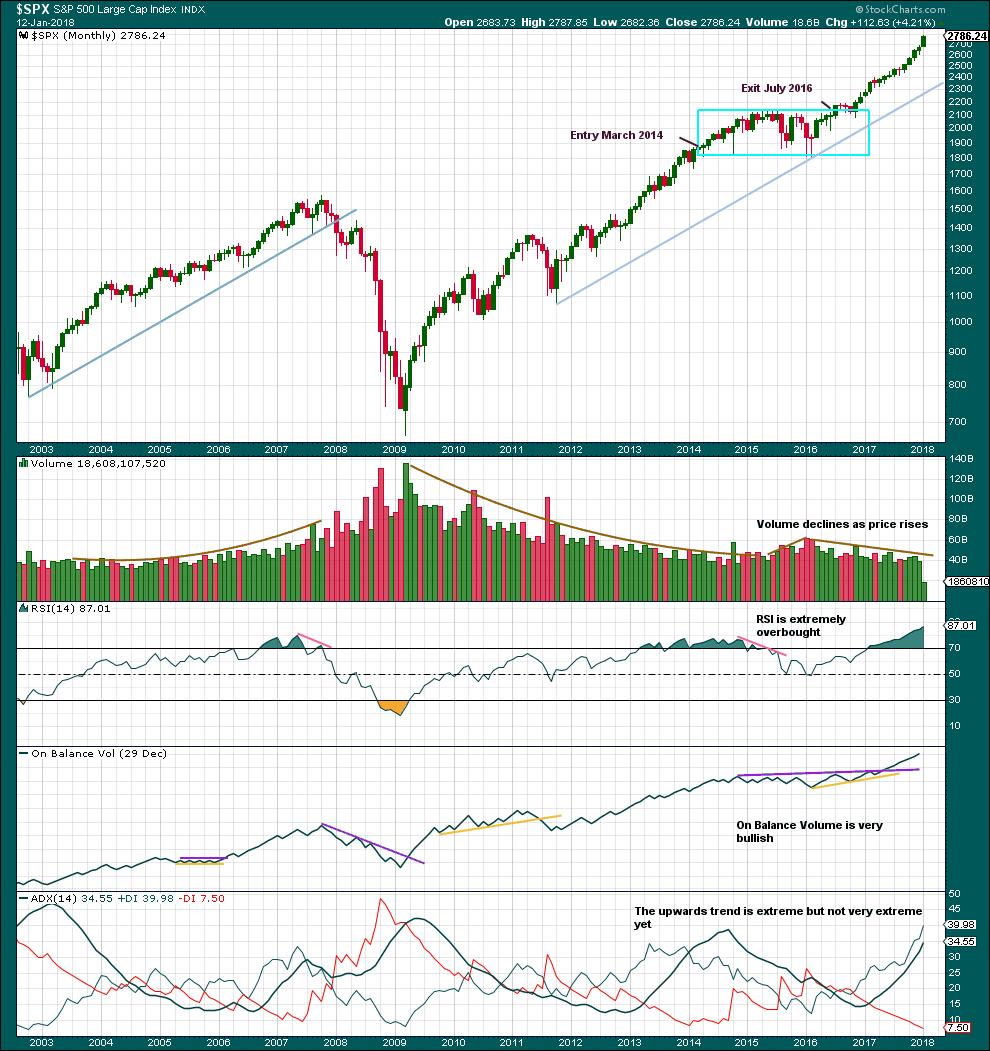
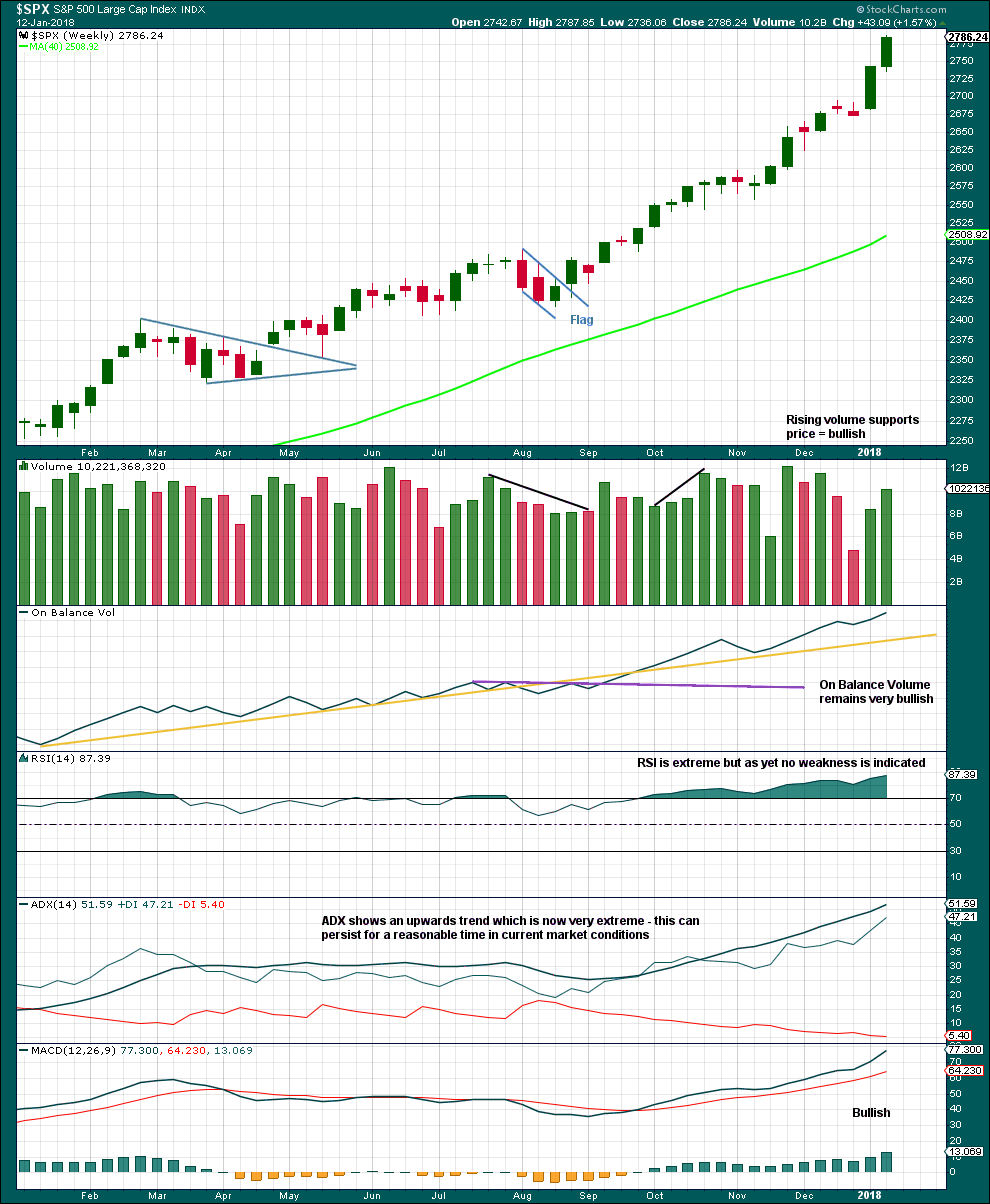
Volume continues to decline as this bull market continues. This has been a persistent feature of this bull market. It seems that price is drifting higher due to a lack of resistance. With thin trading volume, there will be very little support below to halt falling price when this bull market ends.
ADX is extreme but not very extreme. If the black ADX line crosses above both directional lines, then it would be very extreme. The last time that happened price continued to drift higher for over a year before the trend was interrupted at the monthly chart level. If ADX becomes very extreme again, then price may still continue higher for another year or more.
RSI is now very extreme. This may need to be relieved by a multi month correction which may be coming up sooner rather than later.
WEEKLY CHART
Click chart to enlarge. Chart courtesy of StockCharts.com.
Indicators should be expected to be extreme as a third wave at four degrees comes to an end.
When third waves are ending they fairly often will show weakness at the weekly chart level. There is still no evidence of weakness at this time. When intermediate wave (3) is close to or at its end, then we may expect to see some weakness.
DAILY CHART
Click chart to enlarge. Chart courtesy of StockCharts.com.
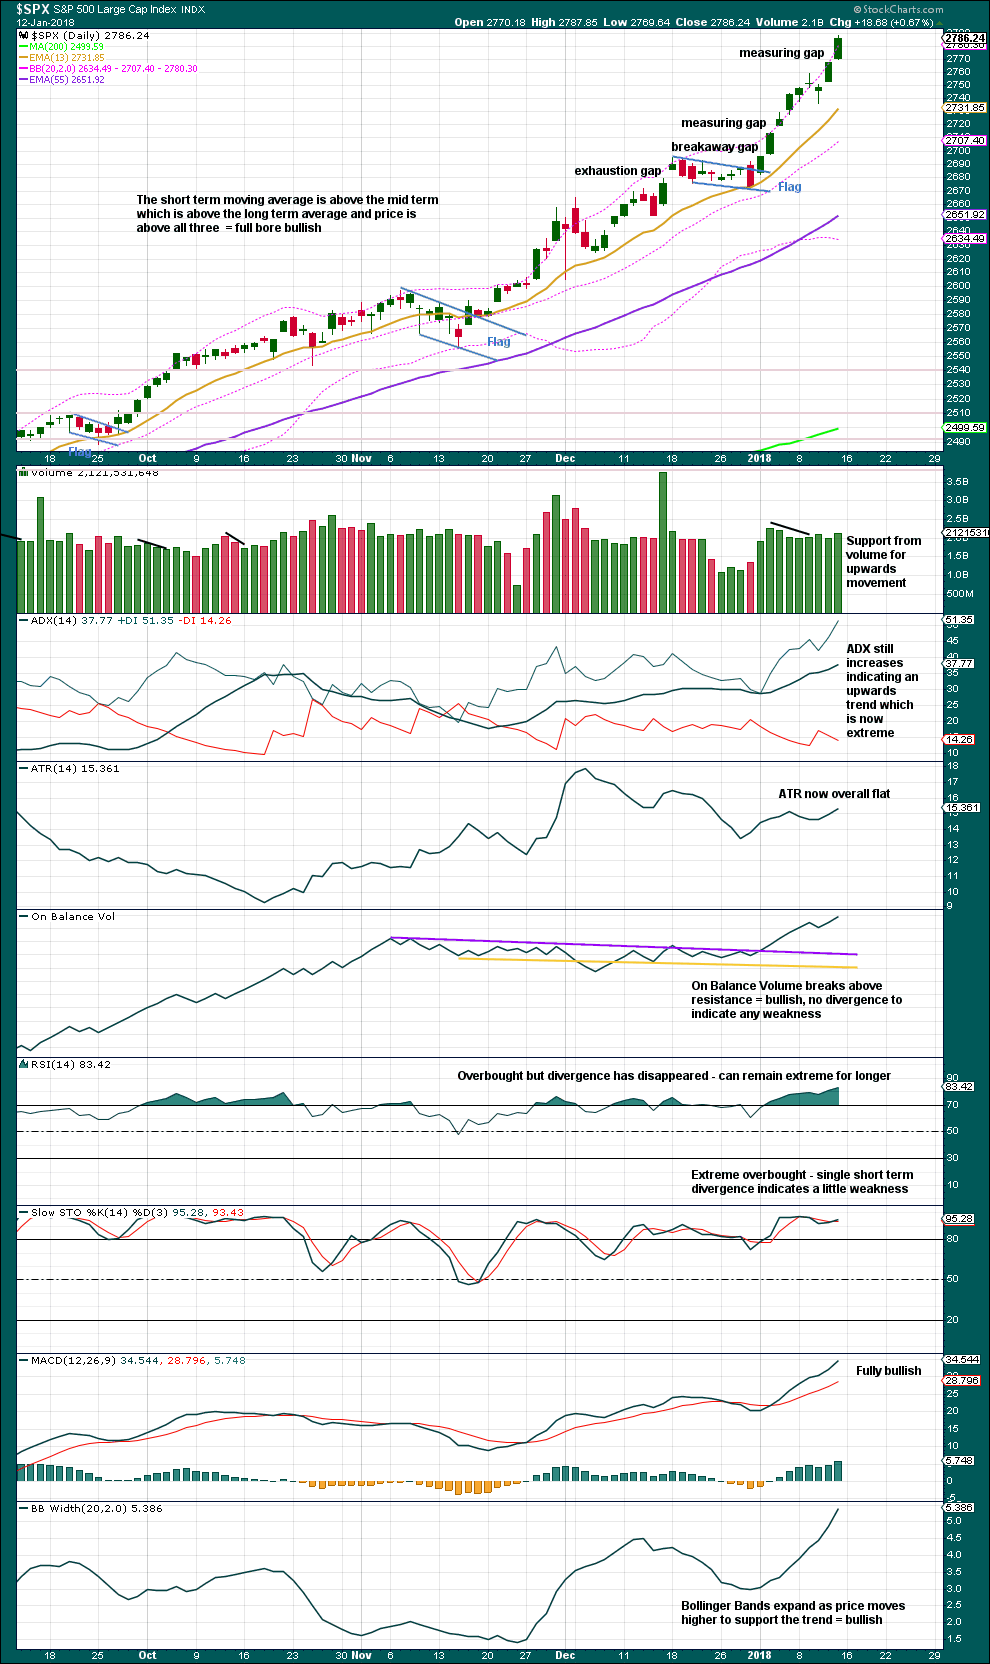
A new target calculated using the new measuring gap is at 2,801. This is the same as the Elliott wave target for subminuette wave iii on the hourly chart, so it seems reasonable to expect a small correction about this point.
RSI is very extreme but can continue for longer. Stochastics exhibits slight weak divergence, but not enough to indicate a correction should begin here.
This chart is very bullish indeed.
VOLATILITY – INVERTED VIX CHART
Click chart to enlarge. Chart courtesy of StockCharts.com.
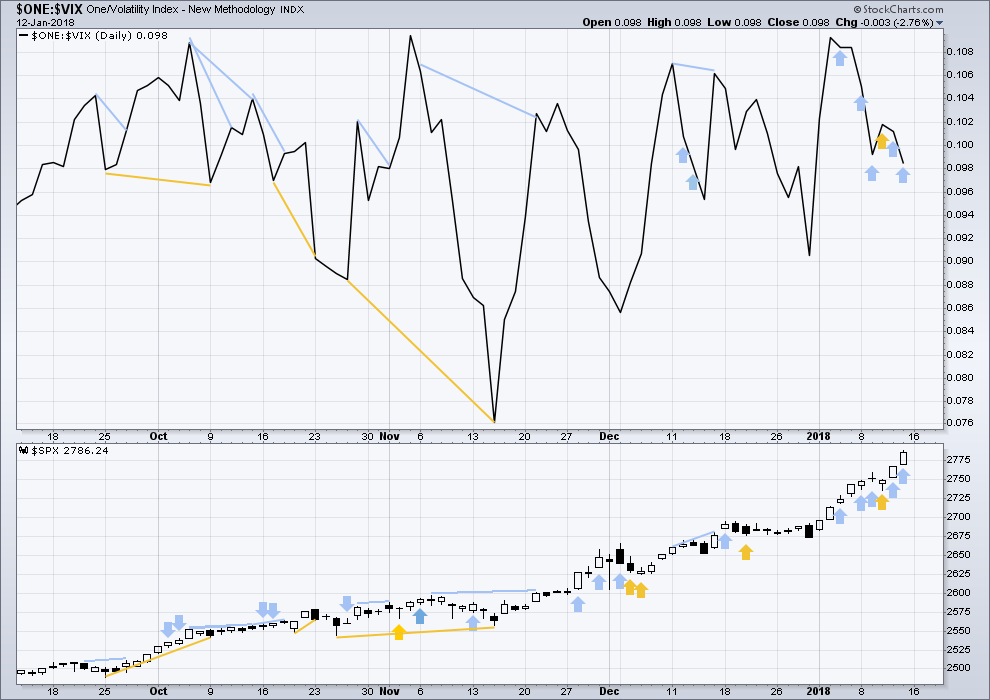
So that colour blind members are included, bearish signals will be noted with blue and bullish signals with yellow.
Normally, volatility should decline as price moves higher and increase as price moves lower. This means that normally inverted VIX should move in the same direction as price.
Price moved higher for the last two sessions, but inverted VIX moved lower. The rise in price has not come with a normal corresponding decline in market volatility; volatility has increased. This is interpreted as bearish.
This bearish divergence may need one or two downwards days to resolve it.
BREADTH – AD LINE
Click chart to enlarge. Chart courtesy of StockCharts.com.
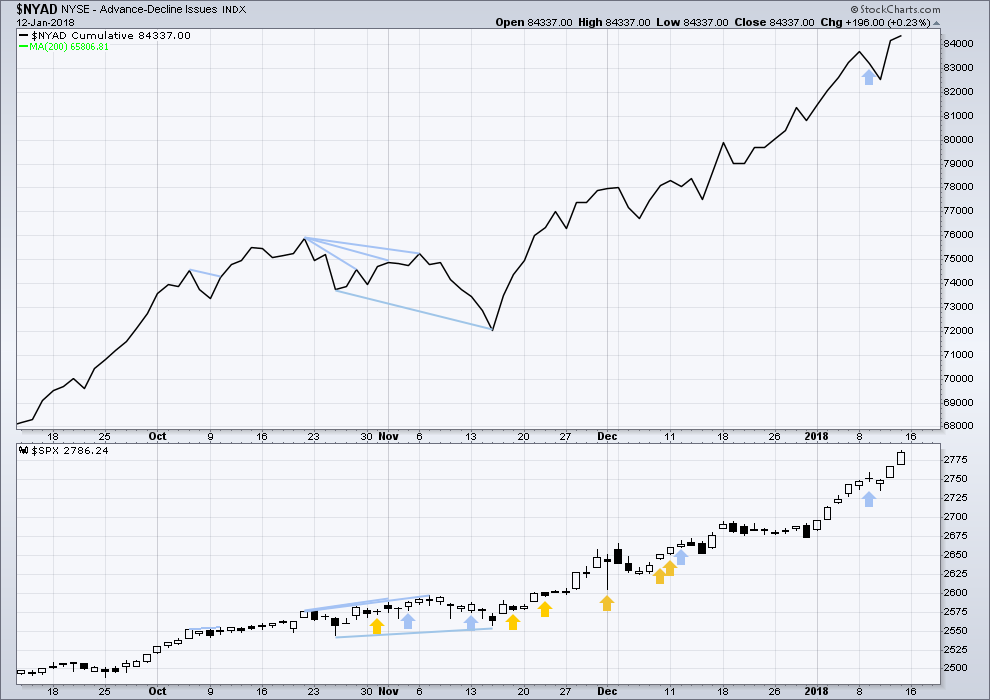
There is normally 4-6 months divergence between price and market breadth prior to a full fledged bear market. This has been so for all major bear markets within the last 90 odd years. With no longer term divergence yet at this point, any decline in price should be expected to be a pullback within an ongoing bull market and not necessarily the start of a bear market.
All of small, mid and large caps this week made new all time highs. This market has good support from rising breadth.
Breadth should be read as a leading indicator.
Both price and the AD line have made new all time highs again for Friday. The rise in price has support from rising market breadth. This is bullish.
DOW THEORY
The S&P500, DJIA, DJT and Nasdaq this week all made new all time highs. The ongoing bull market is confirmed.
The following lows need to be exceeded for Dow Theory to confirm the end of the bull market and a change to a bear market:
DJIA: 17,883.56.
DJT: 7,029.41.
S&P500: 2,083.79.
Nasdaq: 5,034.41.
Charts showing each prior major swing low used for Dow Theory are here.
Published @ 04:37 p.m. EST on 13th January, 2018.
Today’s downwards movement looks a bit too big for micro 2, that’s why I’ll consider it could be subminuette iv and submineutte iii could be over.
But if submineutte iii is over at todays high then it was shorter than subminuette i. That limits submineutte wave v to no longer than equality in length with subminuette iii, at 2,840.12. Which means the target at 2,845 on the daily chart for minuette (iii) may be too high.
Updated hourly chart;
alternate idea:
Looks like they are going to sneak past the 12.50 pivot after the close. Too funny!
Volume hinting at massive distribution underway today. Wow!
O.K. The VIX kerfuffle is finally underway.
I am supremely interested in how this turns out!
Very interesting setup here. VIX fell significantly short of the trendline I mentioned before (at 13). Unless things really go south from here, we aren’t going to see a close above it. Perfect setup for a tag tomorrow morning for a C wave down on SPX.
Looks like the new line in the sand is 12.50.
If we get a gap past that pivot that would be “noteworthy” (the understatement of the year! 🙂 )
I can’t believe you’re actually saying 12.50 VIX is a line in the sand. Any other period in history it’d be above 20!!!! lol
Can you freakin’ believe it?
I said that based solely on what price point drew ’em out of the wood-work. Looks like that level is what for the moment concerns them.
That would be a pretty business-like ZZ!
Just a few more points down and a close below 2767 and I think we have a bearish engulfing candle on the SPX. This may just be the start of a correction at a much higher degree than many suspect. Is it time to jump on the long volatility position?
Yep. I am actually a lot more interested in the gap from Jan 11 at the 2767.56 high…a move below that level would be noteworthy…
I have the engulfing candle in play below 2769.64
The current SPX low doesn’t look stable to me, it’s “around” the 50% but it pierces it a lot. I think a C down it going to get to at least the 62% at 2763.4 and maybe even the 76.4% at 2752.5. Only below there am I starting to think “uh oh”, because once past the 76.4%, it’s awfully common for moves to go out to the 1.27% (2717 ish).
I took my XIV and UWM profits because I’m greedy and it pushed me over target for the day and because I do expect a C to start up sooner rather than later so why not. I want to make positional buys deeper, which I do think is coming.
Rolling half of VIX of 10.00 strike puts. Selling for 3.00, using half proceeds to buy 12.00 strikes for 2.00 even.
Bearish engulfing candle in RUT above B band. There was a time when this would have been the mother of all reversal signals but these days one can never be certain. I have recently seen price turn around and head even higher the very next session after a bearish engulfing candle so nothing is certain when it comes to this market.
On the other hand, RUT’s only retraced 62% of its Jan 10-16 move. Bearish engulfing or not, it’s still in the very minor retrace in terms of scope. And it’s bouncing nicely of that 62%, so much so I’m taking a little long…crazy as that may be.
Also snared some XIV at 137.5
Looking at SPX 5 minute the down action all looks like an “A” in progress. I like the head fakes perfectly off the 23.6% fibo. FRACTAL GEOMETRY IS AWESOME! Anyway, 2780.3 area next 38%, and given the gentle nature of this pullback I’m suspicious that’ll hold for the A leg. A flat 2 overall would also be consistent with this very strong market, so watch out for a “double top” move over the next day.
For me personally, these 2’s (and 4’s) are w/no doubt the most critical timing element in my trading plan. It’s the opportunity to “buy low” with constrained risk due to close by invalidation points. How low is low though? Lol!!!
G’luck all…
This perhaps (zig zag 2 wave).
Have they turned the algos off?! The last nine visits of VIX to the upper B band have seen them dutifully kick in, as evidenced by those long upper wicks…hmmmnnn…!
For those interested in trading with the overall long term and intermediate term trend, XIV is getting very nicely set up, and when the market turns back up, will move up quicky by 3-5%. Of course the tricky part is that “when the market turns back up” business.
Curious there has been no attempt to short the VIX gap higher.
Synchronous gaps up in both VIX and and markets are quite rare, like the three white soldiers we saw a few weeks back. Even rarer are intra-day gaps higher in vol, sure sign that someone has decided to pay the piper sooner rather than later with the rest of the crowd…if VIX gaps higher it would be intriguing…
I will be watching with extreme interest to see how the imminent dogfight over VIX price resolves. Without question the short vol cohort will, as they have done of late, view this move above ten as a declaration of open season. If VIX bounces strongly off a sharp spike down to close green today it probably means strong hands continue to accumulate long vol positions. A new low means this market is going a lot higher.
There is a very reliable trendline stretching from the end of the 2015-2016 correction that suggests will 13.00 be a potential point of reversal. A close above 13 and I would be very wary of an explosion in volatility.
Recent commentary by some quants has cited three VIX points up as the inflection point. Pethaps they are keeping powder dry for a co-ordinated assault at session end.
Selling half VIX March 10.00 stike calls for 2.80.
yes, took 50% as well. Can’t not take a double. Shorting IWM and DIA
Patience is a virtue! 🙂
Always Verne
The gap higher in VIX along with the market is noteworthy. I am not certain, but one way this could take place is savvy traders who want to be prepared for a reversal closing the short side of bullish put spreads.
I have been quite curious about the failure of all the excellent articles about the short vol situation to mention a single word about the role central banks have been playing in vol suppression. It may well be that the level of exposure they the cite in any unwind of the risk parity trade could be woefully understated.
I heard some commentary over the weekend that seems to shed some light on the VIX and its correlation to the SPX or lack thereof. Basically, the VIX is determined by market makers at the Chicago Mercantile Exchange while SPX is determined by market makers in New York. When VIX and SPX diverge it has to do with differing opinions in Chicago & New York of what the future holds for SPX.
Well, it seemed to make some sense to me.
Yep. It has been clear to me for quite some time that it is certainly NOT merely some immutable put call ratio calculation. What has really surprised me is how many traders actually believe that.
Appears micro wave 1 is into it’s 5th wave, starting with a big gap (exhaustion). Micro wave 2 is going to start very soon, and could take price as low as 2740 quick like. Which makes sense: someone is going to want to ring the cash register in a big way, soon. This is the hourly I’m using at the moment.
looks good Kevin
Great Call Kevin
Took some profit off the table and opened a speculative short. In profit and with a stop at break-even
Have for a little steam to be let out of this Market before we carry on with the next leg
Apologies for the big blob right in the middle!
The little pullback SPX has had so far doesn’t float my boat as a reasonable 2 here. But is HAS stopped at exactly the 23.6% of the overall (1) wave up. Next stops down are 2780.3 (38%), 2771.6 (50%), and 2763.6 (62%).
In theory, once this micro-2 is complete…with the micro-3 launching, momentum up may get even HOTTER for the next few days. Hard to imagine, but…”follow the wave count Luke!”.
Futures seem determined to gap us up at least 10 handles on Tuesday. Heck, the Dow should easily gap above 26,000. LOL! These sorts of blow off tops do tend to end in shooting star dojis so I would be careful. We could spend the whole week gapping up 200 pts for the Dow and 10 pts for Spooz, before finally filling one of the half dozen gaps from the last two weeks. The fact that there is little divergence in breadth or volatility tells me we will see absolutely insane highs before all this is over, and I personally think 3600 is on the low end unless it happens in the first half of 2018. The 3.618 Fib, 3 years from now, is not out of the question. The truly amazing thing Lara’s analysis shows is that there are virtually no divergences, even on the daily level! As Lara’s analysis of past bull markets has shown, it takes months for these things to develop before there is a top in price. That being said, we should begin to see larger moves to the downside followed by rapid reversals a la 1998 and 1999.
It is possible of course that this bull could end with no divergence at all.
That would be the first time in almost 100 years this market has done that…. but just because we haven’t seen it before does not mean it can’t happen.
I just think the probability of it happening is so low, I should not be expecting it.
3.618 isn’t a Fibonacci ratio. The next in the sequence after 2.618 is 4.236.
I’ve written a short article here on Fibonacci.
NYSE is closed today for Martin Luther King Day.
Analysis will resume tomorrow, when there’s something for me to analyse.
Lara,
Thanks for providing the longer term perspective and a target that might be doable given the velocity of the moves in markets. Good to have some price levels so we can plan our involvement in the markets. Last time someone put out a chart of bubbles, crypto was many orders of magnitude higher than internet bubble (which at the time was way higher than tulip bubble). All I can say is interesting times ahead in next 3-5 years.
You’re welcome.
I know that target looks ridiculous, and maybe it is.
But if this is a Grand Super Cycle degree wave coming to an end in the next 1-3 years, it should look ridiculous. In the magnitude of something none of us have ever experienced before. Because it should be a once in many generations event.
Thanks Lara for adding the monthly analysis and commentary. It adds perspective. While it is not necessary to do this monthly, it is certainly helpful to see periodically, such as quarterly. It is nice to know you are continually looking to add value for your members.
So now we are considering 3600. I remember when we broke out of 2150-2200 region in July of 2016. When you forecast 2900 many could not imagine it. The same reaction can be expected now to the possible move to 3600. This is one thing I appreciate about your work, you call it as you see it logically not emotionally. Looking forward to the next several years with you. Then I may retire and fade away into the sunset.
Lovely Rodney. I think I have a few years left doing this…
It’s now my 10th year, this 2018. I think I can go another 10 fairly easily 🙂
And my son is now nearing 17 and may be showing some slight interest in learning EW and TA….
If I can teach him, then he may continue it on.
Lara, you’ve gotta be kidding me with a 3600 target. Multiples would be the highest in history by over 20 percent at that price.
Not kidding.
It’s only if the first target is met, and price just keeps going on upwards.
The first target has to be met first.
From the 2009 low, I get 3037 for 2.618, and from the 2016 low 2991. I’m with you to that range.
2009 low to July 2011 high is 689.69 points .
Multiply that by 2.618 = 1805.61 and add that to the Feb 2016 low of 1810.10=3615.71
Exactly. Thank you Peter.
Is 3600 really any crazier than say, what we’ve seen since Trump was elected? We’re already closer to 3,600 than we are to the pre-election lows. Dow 36,000 and S&P 3,600 are not out of the question.
First!! No way??
Curses! Rats! Dag Nabbit! ETC.
(Good job Paresh)