
Downwards movement was expected, but the target at 2,749 was inadequate. The degree of labelling of this movement is moved up one degree today, and an alternate will consider it at up two degrees.
Summary: Every single bear market in the last almost 100 years was preceded by a minimum of 4 months divergence with price and the AD line. With no divergence yet let us assume the larger bull market remains intact.
The structure of cycle wave V is still incomplete. When pullbacks are deep and sharp, it is extremely difficult psychologically to use them as opportunities to join the trend. Use the channel on the hourly chart.
Price today has caught up with both the AD line and inverted VIX. There is no longer short nor mid term bearish divergence there. Price is also very close to a long term support line.
While price remains in the best fit yellow channel on the hourly chart, assume the current downwards trend remains intact. The next target is at 2,533.
If price breaks out above that trend line, that may be an early indicator that the pullback could be over and the upwards trend may then resume. The target would be at 2,965.
Always practice good risk management. Always trade with stops and invest only 1-5% of equity on any one trade.
The biggest picture, Grand Super Cycle analysis, is here.
Last historic analysis with monthly charts is here. Video is here.
An historic example of a cycle degree fifth wave is given at the end of the analysis here.
MAIN ELLIOTT WAVE COUNT
WEEKLY CHART
Click chart to enlarge.
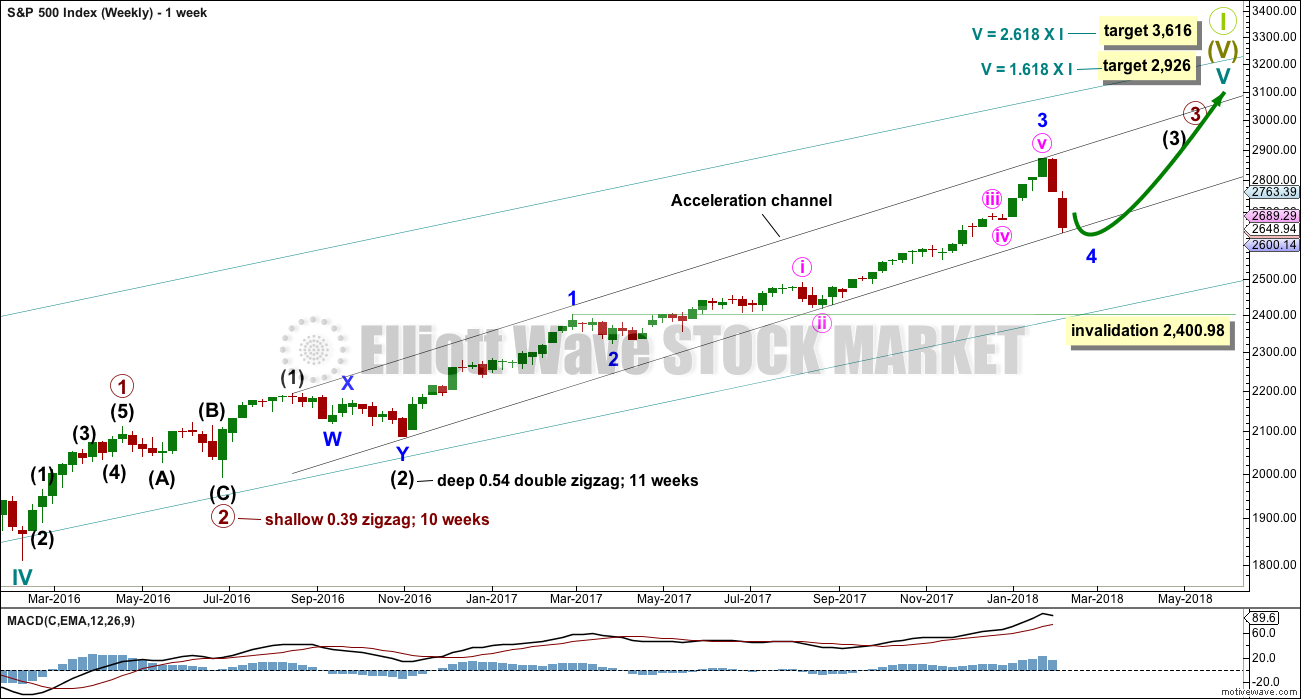
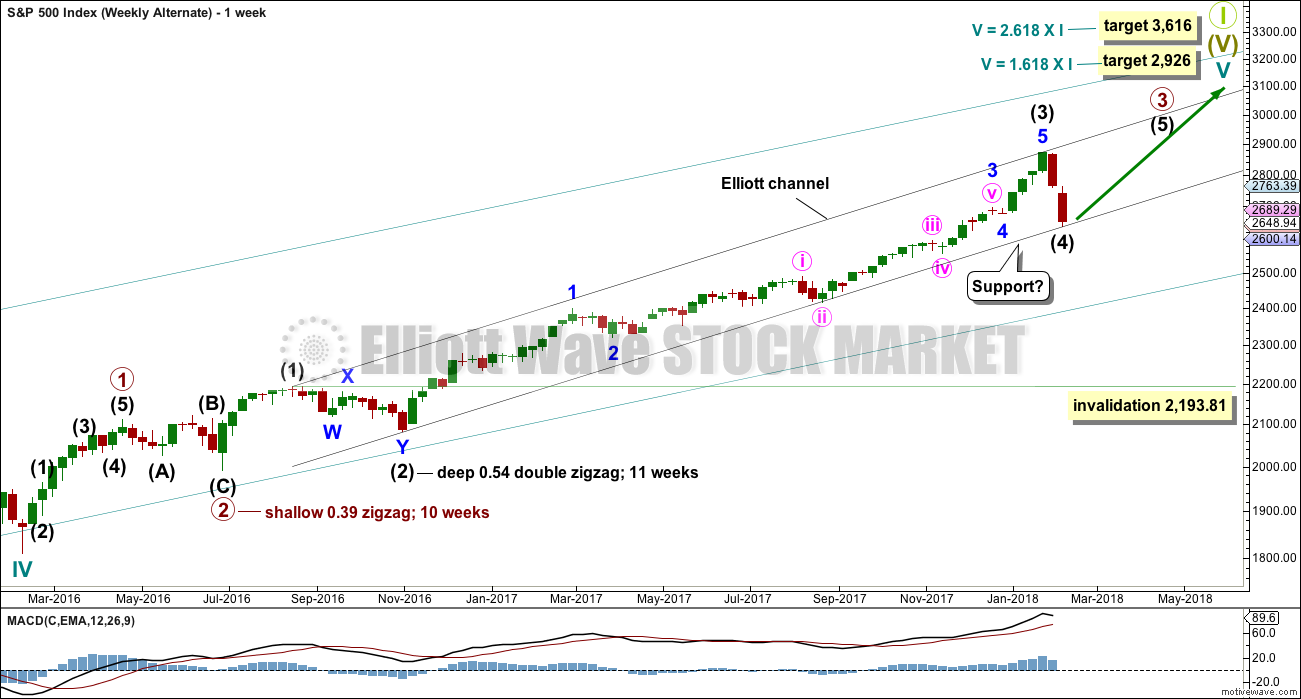
Cycle wave V must complete as a five structure, which should look clear at the weekly chart level. It may only be an impulse or ending diagonal. At this stage, it is clear it is an impulse.
Within cycle wave V, the third waves at all degrees may only subdivide as impulses.
Within cycle wave V, the corrections for primary wave 2 and intermediate wave (2) both show up clearly, both lasting several weeks. The respective corrections for intermediate wave (4) and primary wave 4 would most likely also last several weeks, so that they show up at weekly and monthly time frames. The right proportions between second and fourth wave corrections give a wave count the right look. This wave count expects to see two large multi week corrections coming up.
Cycle wave V has passed equality in length with cycle wave I, which would be the most common Fibonacci ratio for it to have exhibited. The next most common Fibonacci ratio would be 1.618 the length of cycle wave I. This target at 2,926 now looks too low. The next most common Fibonacci ratio would be 2.618 the length of cycle wave I at 3,616. This higher target is looking more likely at this stage.
Intermediate wave (3) has passed all of equality in length with intermediate wave (1), and 1.618 and 2.618 the length of intermediate wave (1). It is possible that intermediate wave (3) may not exhibit a Fibonacci ratio to intermediate wave (1). The target calculation for intermediate wave (3) to end may have to be done at minor degree; when minor waves 3 and 4 are complete, then a target may be calculated for intermediate wave (3) to end. That cannot be done yet.
The many small subdivisions within minor wave 3 may be seen in several different ways. The degree of labelling within the current pullback is moved up one degree today. The pullback may be minor wave 4. Minor wave 2 was a shallow 0.25 double zigzag lasting 4 weeks. Minor wave 4 may be a single zigzag, or it may also be a sideways flat, combination or triangle which may last longer. So far minor wave 4 is 0.43 the depth of minor wave 3, and so far there is a little alternation in depth.
If minor wave 4 ends this week at support, then it would look reasonably in proportion to minor wave 2.
The black acceleration channel is drawn about intermediate waves. It shows where downwards movement may find support. If this support holds, then it is possible that minor wave 4 could be over here or very soon tomorrow.
Minor wave 4 may not move into minor wave 1 price territory below 2,400.98.
DAILY CHART
Click chart to enlarge.
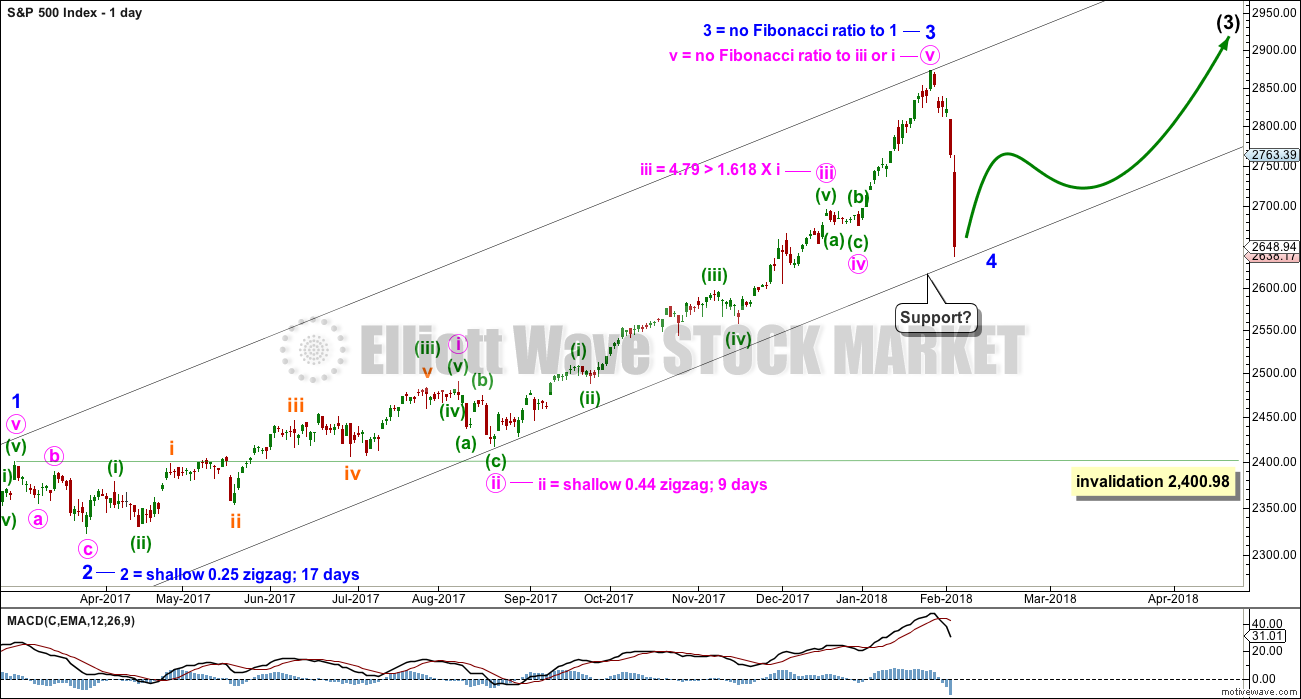
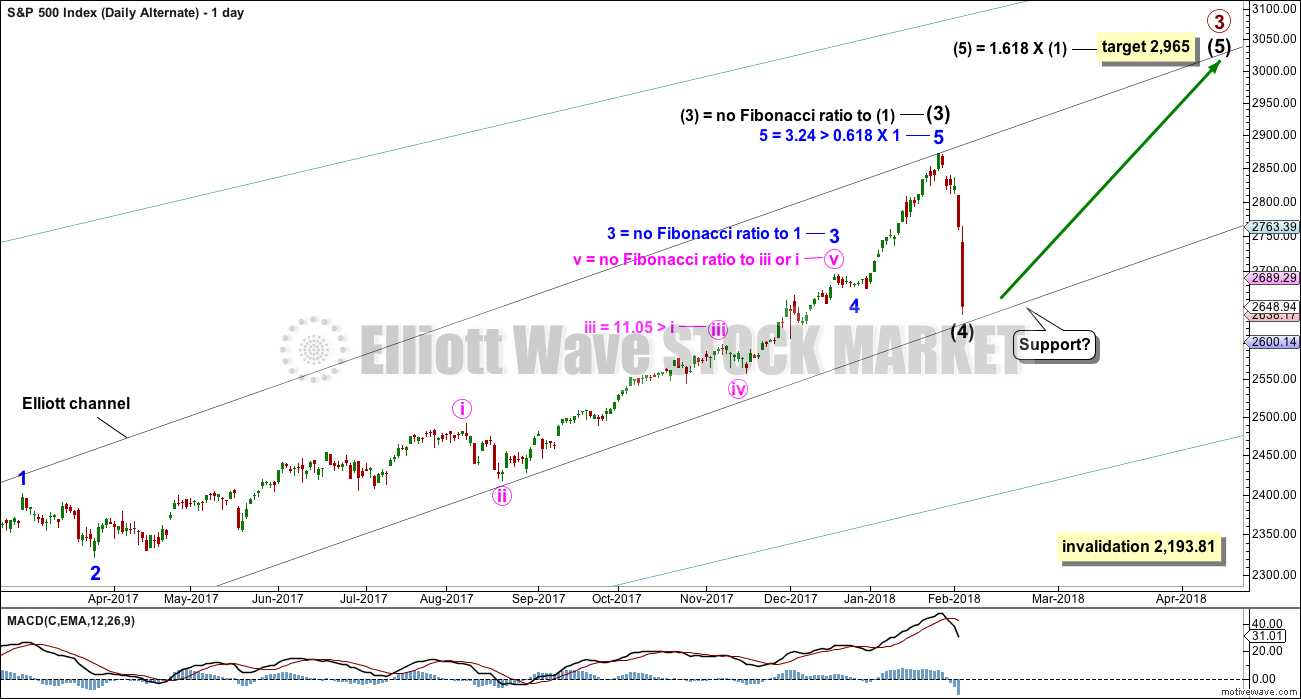
The black acceleration channel is copied over to this daily chart. There is still a little room below before minor wave 4 may find support there. If it breaks below this channel, then the next target for minor wave 4 to end may be about the 0.618 Fibonacci ratio of minor wave 3 at 2,533.
The S&P commonly will exhibit a Fibonacci ratio between two of its three actionary waves within an impulse, and very rarely between all three. The fact that this wave count has no Fibonacci ratio for minor wave 3 nor for minute wave v within minor wave 3 does not mean this wave count would therefore be wrong. This is entirely acceptable. There is a good Fibonacci ratio for minute wave iii.
So far downwards movement may only be either a zigzag, multiple zigzag or an impulse. Both a zigzag and an impulse are again considered on hourly charts below.
HOURLY CHART
Click chart to enlarge.
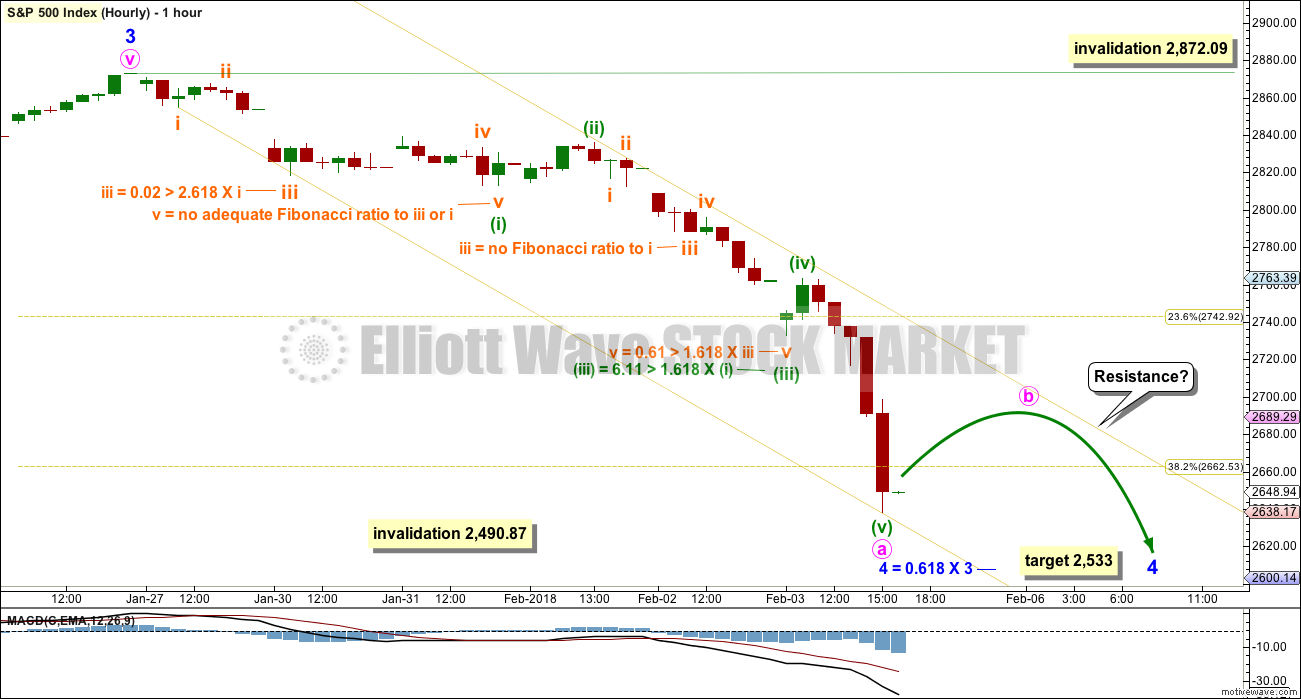
This first hourly chart considers an impulse lower may be complete here or very soon. This may be followed by a relatively shallow three up for minute wave b. Thereafter, minute wave 4 may continue lower to the 0.618 Fibonacci ratio of minor wave 3 at 2,533.
Within each of the impulses of minuette waves (i) and (iii), there is one excellent Fibonacci ratio between two of the the three actionary waves. This is normal for the S&P.
The yellow channel is a best fit about downwards movement of the last few days. Assume the current downwards trend remains intact while price remains within this channel. If price breaks above the upper edge of this channel, then it may be either a deeper bounce for minute wave b, or the alternate hourly chart below may be correct.
Minute wave b may not move beyond the start of minute wave a above 2,872.09.
ALTERNATE HOURLY CHART
Click chart to enlarge.
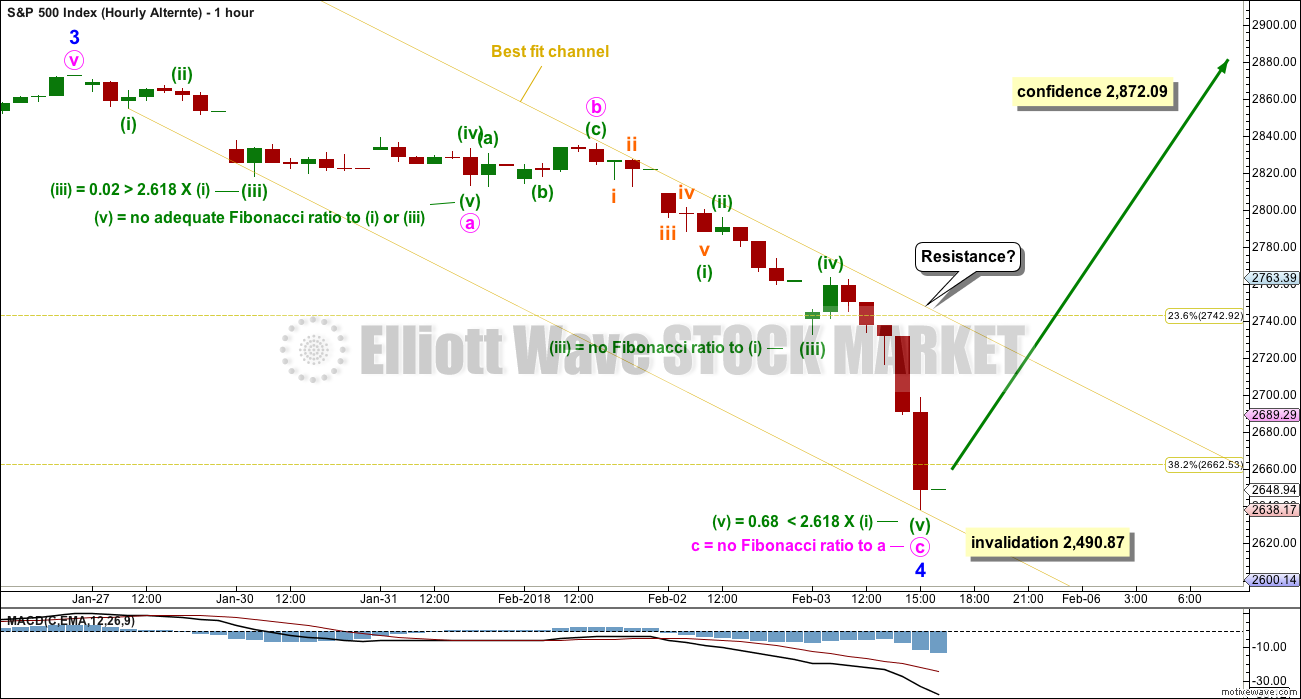
This alternate hourly chart considers the possibility that downwards movement may subdivide as a zigzag. The lack of a Fibonacci ratio between minute waves a and c is not a large problem for this wave count; A and C waves do not always exhibit Fibonacci ratios. There is an excellent Fibonacci ratio within each of minute waves c and a.
On balance, the Fibonacci analysis of these two wave counts cannot point to one being more likely than the other.
It is possible that a zigzag is complete at today’s low or very soon during tomorrow’s session. Look for support at the lower edge of the black channel on the daily chart.
A breach of the yellow best fit channel may add some confidence to this idea. A new all time high should add substantial confidence.
ALTERNATE WAVE COUNT
WEEKLY CHART
Click chart to enlarge.
Despite the brevity of this downwards movement, the size of it means the possibility that intermediate wave (4) has arrived must be considered.
Even though intermediate wave (2) lasted 11 weeks, if intermediate wave (4) is over here within just two weeks, it would still have about the right look on the weekly and daily charts due to its size.
The black channel is drawn in exactly the same way on all charts today. Here it is correctly termed an Elliott channel about the impulse of primary wave 3. In the first instance, expect intermediate wave (4) may find support about the lower edge. This would see it over here or very soon indeed.
But fourth waves are not always contained within a channel drawn using Elliott’s first technique. This is why Elliot developed a second technique to redraw the channel when the fourth wave breached it. While intermediate wave (4) does not have to end at support here, it would be fairly likely to do so.
DAILY CHART
Click chart to enlarge.
Fibonacci ratios are given on both this alternate daily chart and the main daily chart. There is not enough difference between them to discern one wave count as more likely than the other. They both have some close Fibonacci ratios.
There is a little room for price to fall before it perfectly finds support at the Elliott channel.
If intermediate wave (4) is over here, then a target for intermediate wave (5) may be calculated. Were intermediate wave (5) to only reach equality in length with intermediate wave (1) it would be truncated. The next Fibonacci ratio in the sequence is used to calculate a target. If intermediate wave (4) moves lower, then this target must also move correspondingly lower.
At the hourly chart level, this alternate idea works in exactly the same way as the main wave count. Both hourly charts work for this alternate, only the degree of labelling would be one degree higher.
TECHNICAL ANALYSIS
WEEKLY CHART
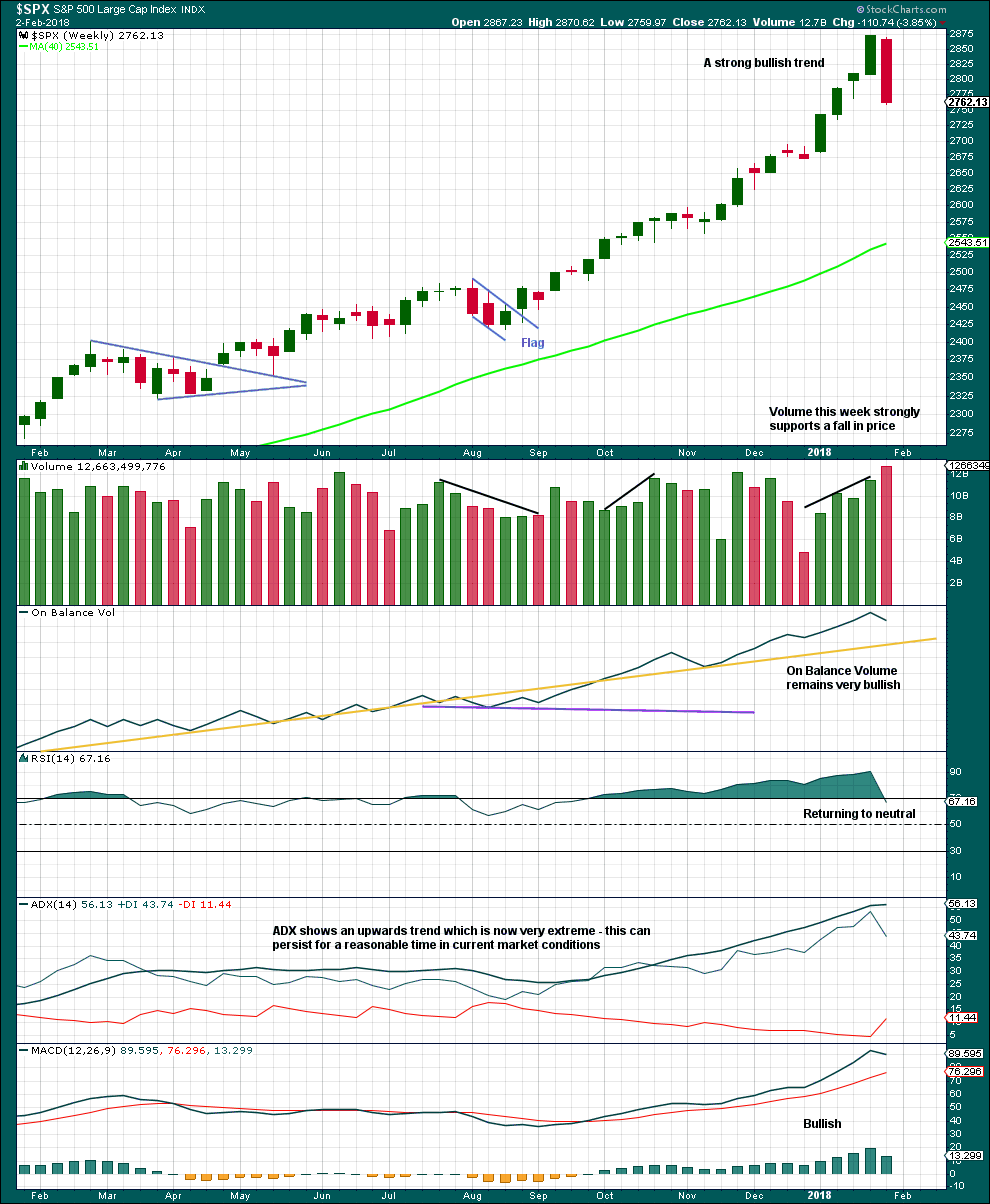
Click chart to enlarge. Chart courtesy of StockCharts.com.
This strong bearish weekly candlestick is not technically a bearish engulfing reversal pattern because the open this week gapped lower. However, the close this week well below last week’s open is very bearish. Support from volume is also very bearish.
DAILY CHART
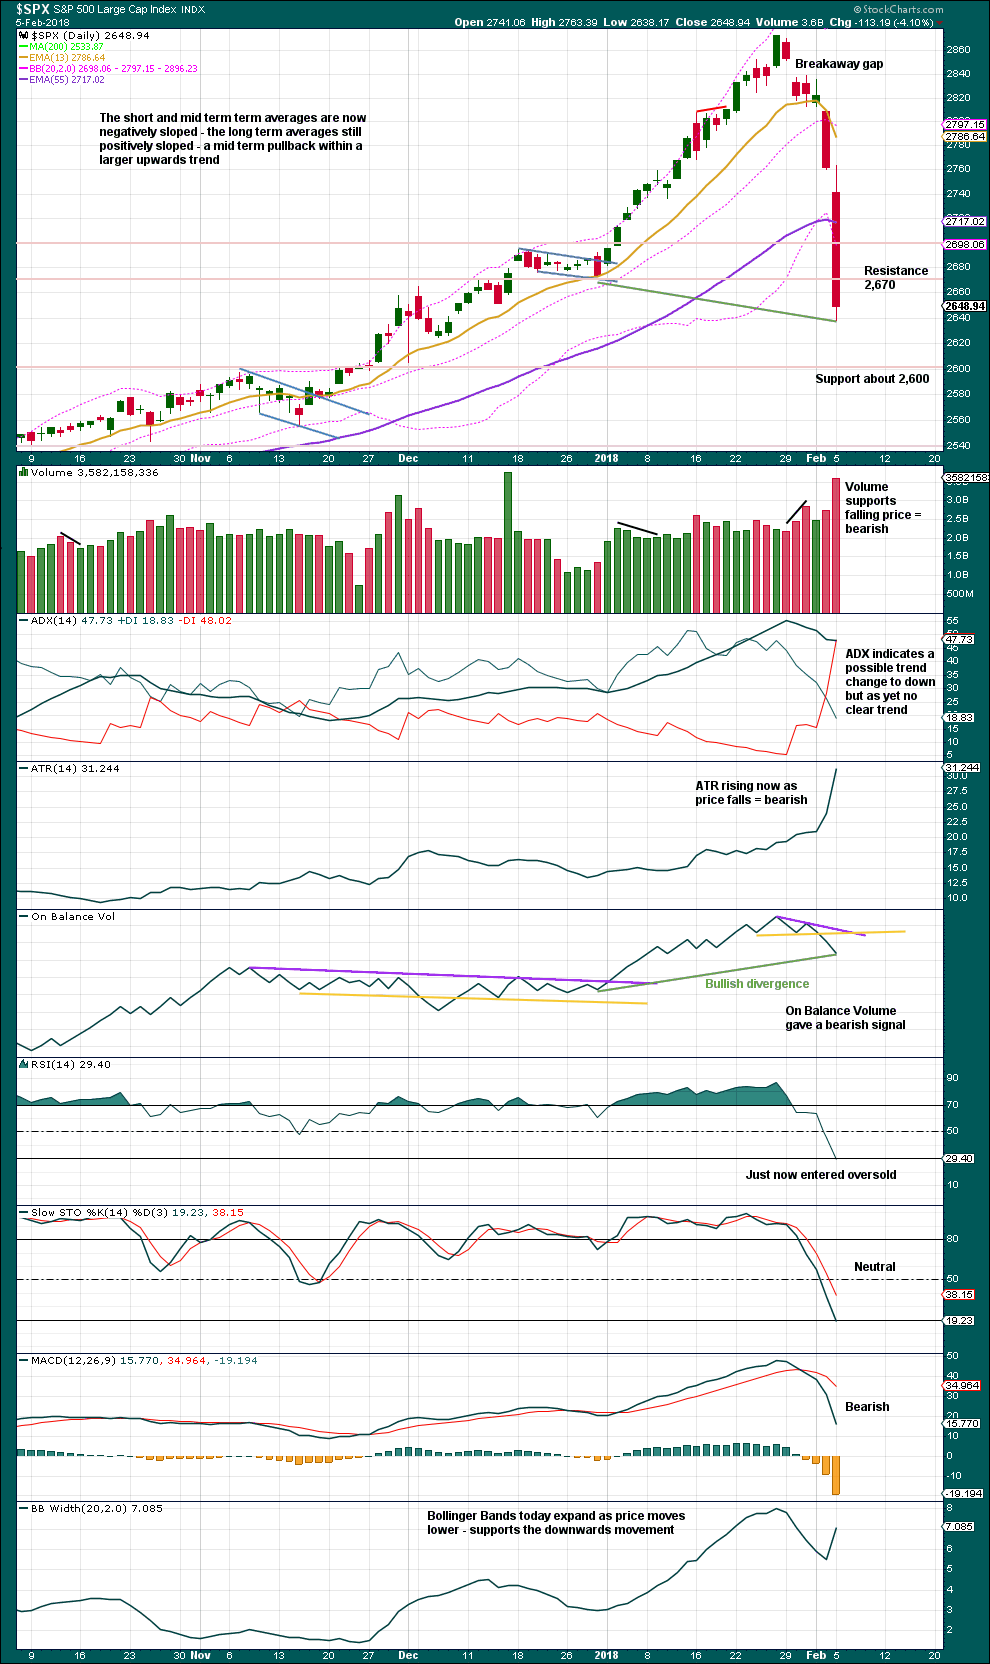
Click chart to enlarge. Chart courtesy of StockCharts.com.
Strong volume today may either be a signal that selling pressure will see more downwards movement tomorrow, or it could be a selling climax. Looking back over the last four years of pullbacks both scenarios are present.
Next support is about 2,600.
Little weight should be given to bullish divergence between price and On Balance Volume because it is not always very reliable.
The S&P tends to not remain with RSI oversold for very long when it moves strongly lower. With RSI moving today into oversold look for a low here or within a very few days. This does not preclude a further sharp fall in price though.
VOLATILITY – INVERTED VIX CHART
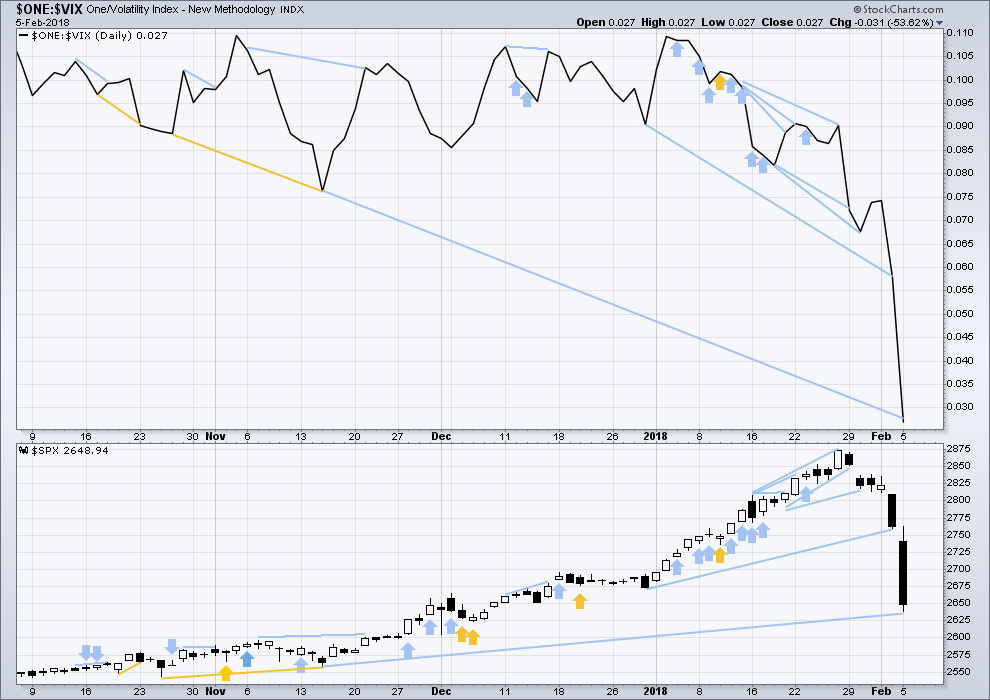
Click chart to enlarge. Chart courtesy of StockCharts.com.
So that colour blind members are included, bearish signals will be noted with blue and bullish signals with yellow.
Normally, volatility should decline as price moves higher and increase as price moves lower. This means that normally inverted VIX should move in the same direction as price.
Short and mid term divergence between price and inverted VIX has today disappeared. Price has caught up. The fall in price today now exhibits a normal increase in volatility.
There is longer term divergence, but this may be given little weight as it has proven to be unreliable over the last year or so.
BREADTH – AD LINE
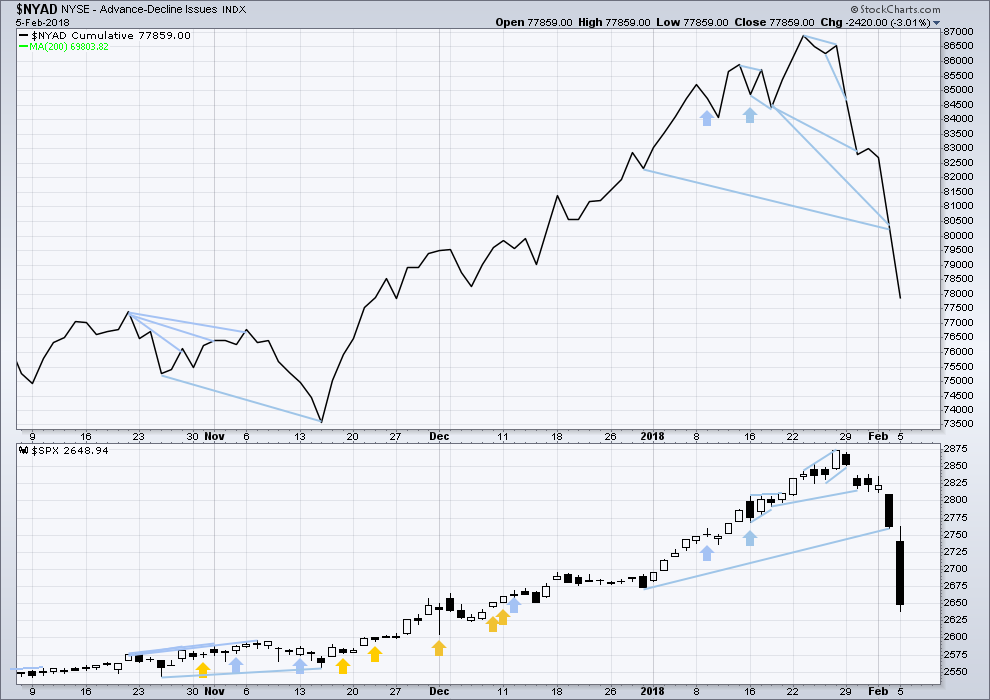
Click chart to enlarge. Chart courtesy of StockCharts.com.
There is normally 4-6 months divergence between price and market breadth prior to a full fledged bear market. This has been so for all major bear markets within the last 90 odd years. With no longer term divergence yet at this point, any decline in price should be expected to be a pullback within an ongoing bull market and not necessarily the start of a bear market.
All of small, mid and large caps last week made new all time highs. This market has good support from rising breadth.
Breadth should be read as a leading indicator.
There is no longer short nor mid term bearish divergence between price and the AD line. The new lows in price are matched by new lows in market breadth, and not exceeded.
There is very slight longer term divergence, but this is too small to be noted.
DOW THEORY
All indices have made new all time highs as recently as three weeks ago, confirming the ongoing bull market.
The following lows need to be exceeded for Dow Theory to confirm the end of the bull market and a change to a bear market:
DJIA: 17,883.56.
DJT: 7,029.41.
S&P500: 2,083.79.
Nasdaq: 5,034.41.
Charts showing each prior major swing low used for Dow Theory are here.
Published @ 10:52 p.m. EST.
IMO. as long as we are below 2763 — downtrend still in play. A close above that gives more credence to the Bulls.
Kevin, you love this. I bought 5000 of XIV at 5.60 when it started trading. Just got out at 8.23!!! I’m done for the quarter!!!
Hyuk! Talk about hit and run! No such resurrection in SVXY.
Nice one! 🙂
Nice. But I have no clue how it’s behaving anymore really, so I’d best stay away and not get burned!
Yes, that was me being a cocky pig….not trading advice.
Has anyone been wondering why UVXY did not explode when SVXY and XIV collapsed?
Yes, but it looks good after hours. All of these etns are pieces of garbage, but good for scalps. Wait until the public realizes what a joke there ETFs portfolios are!! They will be punished on wave 3 Down. And it’s coming, mark my words. All of the brokerage and robo advisor were down/delayed, I may actually keep my job another few years!!
Break from triangle was indeed sharp but to the upside so I was wrong about direction. Coupled with futures action, it does not look like a head fake so we probably have an interim bottom. Not jumping quite yet. Waiting for upper channel breach on a close.
My contingency order for NTFLX 260 puts executed this morning for a nice 75% gain. I missed that! Looking to re-load…. 🙂
Good Bounce going on… at the moment.
The big question is:
Reversal, or Dead Cat?! 🙂
Have a great evening all! Stay Frosty!
E wave of triangle completing?
One hour to confirm….
Not a triangle. B wave in progress. Corrective, hence all the overlapped action in general. “Bull trap” being set me suspects.
I think you’re right. It is just way too cute coming at session end like this.
Won’t that be someting if we see a nasty futures reversal?
Boy would that make a lot of traders mad! 🙂
There was a 3.4 billion sell side imbalance going into the close yesterday. Will we see something similar? I was really hoping we would get the move down before session end.
Traders could be starting to get nervous being in the market overnight.
That has been my problem for some time, lol! (unless I’m short futures via options!) 🙂
Verne, if you want to consider the end of cycle wave V and the start here of a huge bear market, then the problem of intermediate (4) and primary 4 must be resolved.
I’ve had a play with the idea here. There could be some nice Fibonacci ratios. And some not good ratios.
This is possible and I will consider all possibilities. We may have confidence in it only below 2,111.05. Because at that point downwards movement couldn’t be a fourth wave correction, it would be in primary 1 price territory. So the impulse would have to be over. And that would also necessitate a huge breach of the teal channel which is about all movement from the low in March 2009.
So that’s the price point for this very bearish idea. 2,111.05.
I do not like the poor proportions between corrections at intermediate and primary degree. But then the S&P just does not always give nice proportions. So this must be considered.
I also do not like the absence of divergence with the AD line and RSI.
If this is the end of the bull market then it would be the first time in almost 100 years that market breadth has not declined towards the end of it. I’m not happy with those odds.
I know it doesn’t have to happen with that divergence, but the balance of probability tells us it should be most likely to happen with divergence.
My concern is that in my judgement this is a valid idea but one which has an extremely low probability.
If I publish this on a daily basis, then will it sway members towards it, and does that mean they may miss out on buying opportunities in a bull market?
The trend remains the same, until proven otherwise. The bull market remains intact, until price tells us its over. That would need a breach of the teal channel and a new low below 2,111.05.
OK Mr. Market, let’s get that new low before the close shall we? 🙂
DJI definitely looks like some sort of contracting triangle formation so it could be coiling for a sprint…
The action in futures seems to me to be way too cute. One would assume that based on it one would want to go long overnight but things are never that obvious or easy are they? Let’s see if we get a move down into the close. If we do I suspect it will not complete until sometime tomorrow so I am not going to try and front-run the reversal.
Lara you are right on everything for years now because the trend is up. I do object on one thing, if i may. If we wait 2.111 to confirm a bear market then we will have missed a 25% + move. The best strategy at this highs is BETTER to miss the rest of the bull market and trade corrections because one them will eventually be start of bear market. No one cares to trade 2111 till 1800. there is more risk to trade long while s&p creates a top even if its for one more year. the last 3 days are my proof of concept since i do believe all of us were trying to catch a falling knife. Stop losses are fine but if you trade many times- with new stop losses as you provide the key levels- then there is no real stop loss. I will keep saying it and believe that you should prove your analysis with paper trading even with mid term or long term positions. other wise the analysis can always be changing scenarios or using alternate scenarios or anything that can fit to new data. respectfully
The risk to the upside by entering short positions here is infinite. If you want to take that strategy you are welcome to do so. You would be trading against a trend though which is generally not advised.
I am not going to be providing you with my trading account results. I rarely trade the S&P. When I have a position I tend to want to see the market go my way, and so I find it difficult to remain objective in my analysis. I’ve reduced the amount I trade this market (and Gold, Oil and Silver) for that reason.
Trading ability and analysis are two separate skills. As evidenced by this membership.
Plenty of members have been here over 5 years and use my analysis to assist them in their trading decisions, and overall profit.
Plenty of members come and go, some staying for a short time and complaining they cannot profit. From the exact same analysis.
This analysis WILL change. As the market changes. Expecting it to not change is expecting me to have the exact right wave count at the beginning of a move. Which is highly unlikely given the many possibilities open.
When the bear market does turn up I would expect it to end well below 666.79. And prior to a new low below 2,111, a strong breach of the teal channel would add confidence to a bearish wave count.
You appear to be unsatisfied with this membership. If you would like to cancel I am happy to refund the unused portion of your last membership. If this is what you want email me.
Thanks Lara!
I have learned over the years to follow your advice to assume the larger trend remains the same UNTIL PROVEN otherwise! 🙂
I try not to let my bearish leanings cloud my trading decisions but I do admit this plunge has me considering if we have seen a top.
I do think the odds favor a fourth wave of some kind but I would have it as prior to a final move up so that would make it a P4 and I know we don’t yet have a good EW fit for that idea. Price will tell all! 🙂
Joseph pointed out that ES did visit the area of the 200 day MA overnight so I am now very convinced that that area will provide very strong support on any C wave down.
Since ES hit that area overnight, I think we should expect this small b wave to get done today and the C wave down to get going prior to the close. That would be a great set-up if that is in fact what happens!
Did anyone have trouble executing trades yesterday?
There is some commenting on “missing” market makers.
We know the spreads were laughable but I did not have any trouble actually executing trades.
On the question of where we are in the EW count, odds are that whatever it is, bullish trades in the near future will be rewarded. Whatever the count, we are due for a bounce soon…
Main hourly chart updated:
The bottom line remains that while price remains within the yellow channel, assume price may continue lower.
The trend remains the same (at this time down) until proven otherwise.
Yep! Yep! Yep! I think that’s the ticket.
I am jumping in big time long on the next low. 🙂
At this point in time I do think that would be the wisest move.
However, we also need to be open to a low in place today. Let us see how this session closes. If it’s green and RSI moves higher, then thats a bullish signal.
Lara, how does your chart show a low of 2593 when my future chart went down to 2529 which is Lowe than your 2533 target?
Not the same market…. 🙂
It’s a bit early in the session to tell, but if today’s candlestick closes green and RSI makes a new low, then there would be single day divergence with price and RSI. Because price has made a new low today.
That has reliably (in the last few years) been a signal of a low in place. I will assume this signal may most likely work…. doesn’t have to work, but it does work more often than it fails.
IF that happens then this wave count would be correct.
“Triangle” may be contracting and somewhat bigger than originally thought….steady as she goes…
Looks like DAX also tracing some kind of triangle after a steep third wave decline.
TMV hanging tough. I am waiting for a tag of 200, or at least some move in that direction before reloading for short term trade. Remaining long in mid and long term accounts.
Will add to positions on move of 50 day above 200 day MA.
Someone pointed out to me (from Fasanara) that with the short VIX ETFs blowing up, one avenue they had of distorting price discovery and true risk assessment is being taken off the table. Oh I know they have other ways, but now they are more limited. Interesting!
DAX is down significantly. We are usually right behind them.
Keep an eye on futures. The bulls absolutely do not want to see them start printing red.
It would mean the banksters’ attempts to gin up some animals spirits has been a miserable failure, and look out below…!
Of course, much of the herd is dealing with the heart-ache of margin calls today so its hard to be “animal-spirited” under those circumstances…
At the last top, margin was at all-time highs….that is NUTS!!!
SVXY 130 puts with March expiration still trading today.
Offer is 116.00 per contract!
I should have followed my usual practice and held onto one just for kicks!! 🙂 🙂 🙂
The momentum down keeps increasing, ala the 3 successive trend lines in white.
I don’t see much of a triangle myself, at this point. Looks more likely a bottom (temporary, perhaps) in development. But some trend lines need to start getting cracked, or else goodnight Irene. There is a succession now of some slightly rising lows…
I designate some formations as triangular strictly for trading purposes. Very often they don’t conform to the formal definition of EW triangles but the sideways action and the resulting break is usually quite predictable.
Looking at a gunslinger trade on VIX.
If we get an impulse down completing today, VIX is going to take a huge dive into the close and in-the-money-options expiring at the open tomorrow could return some nice coin…. 🙂
We should be getting close to the end of the triangle formation. Not sure if we are at D or E but a break should come fairly soon methinks….
I love your play by play, the next leg down right?
I think so….
Every now an then, and I consider this entirely an artifact of algo ambushes, price will shoot from a triangle in the exact opposite of the expected direction, only to immediately reverse and then head in the direction previously expected, so one has to be alert for that subterfuge as well…
Watch the Thomas Peterffy (Interactive Brokers) Videos on the unwind of the Short VIX Trade… as I posted before.
https://www.cnbc.com/latest-video/
Thanks Joseph!
ES could be in a corrective B wave as it does not look like a triangle. Interesting!
I just took a look at near-dated puts and they are sky-high.
This is the problem with trading market declines. As VIX rises, option premiums become completely ridiculous, making it tough to execute profitable trades. This is why it so important to get positioned before all hell breaks loose if you are an options trader.
Although I am confident in more downside, the expensive option contracts are simply not worth the trade. I will be looking at some bear call spreads instead.
Triangles are one of the most predictable chart patterns there are. They are very predictable and a cinch to trade. We entered this one in a down trend, so chances are high we will exit to the downside. The move out of it is going to be sharp, as will the reversal once the move down completes. Stay awake!! 🙂
IF SPX tags its 200 day at 2535.39 I will be making the biggest long trade I have made in many years via SPY 250 calls. If I can pull it off I am taking six months off from any market activity and going to Tortola to drink some Pina Coladas! 🙂
To your post Verne:
Always the question… did the ES low overnight of 2,529 mean anything? (ES which is what the rest of the world is focused on in the late PM/AM).
I personally have seen that matter at times and be meaningless other times. So this time?
Wow! I did not realize it got that low!
That is real confirmation to me that we can expect the cash session to visit that area before the correction is over. I am now even more confident that that is where our bounce will come. Thanks for pointing that out Joseph!
At the end of the next impulse down, we will get an opportunity to short VIX for an easy triple at the very least. Look for the long upper wick to confirm the interim bottom. We simply have not had it.
The attempt to manipulate sentiment has now moved to the strategy of buying futures in the face of a declining cash session. I do not think we have even started to see any margin call induced capitulation. Will the strategy work?
Here is how to tell.
If you see futures start to tank before the close you will have your answer.
We are going to go down 1000.00 DJI points if that happens and it is going to stick until we hit a real interim bottom. probably at the 200 day SMA
According to this guy from interactive Brokers…
The unwind of the short vix trade is a multi-day to multi week event.
Basically options sold (either way) need to be covered. Many margin calls will trigger the covering.
When CNBC posts that video it would be worth a view… for those that understand this better than I.
It’s not just the ETN’s…
Absolutely!! Few people think about what the quants all “synthetic shorts” of volatility and the risk parity trade. A lot of folk are going to drag their feet hoping to survive the margin call with a strong market rebound. If the margin call wiped them out, they have nothing to loose by waiting.
Looks like we are now in some kind of fourth wave triangle. If that is right, another impulse down on deck. I expect a furious rally after an interim low is in. It is going to go high enough to mislead bulls and bears alike I suspect.
So we are expecting a B wave up now, with an ABC structure, eh???? 2700 is just about the 38% fibo back up from todays low to the ATH. Same place the market bounced up to and turned yesterday. A likely area for a market decision and turn. Next up are 2732.5 (50%) and then 2766 (62%), should 2700 fall.
Fidelity shut down there site. They have done this before during heavy drops. If they can’t scale there site they should pay back everyone who couldn’t trade.
Rodney I hope you got out in time.
I was talking to a friend who is broker with Schwab this morning and he told me he spent the last few days making calls to inform clients of margin calls. He said it has not been a pleasant experience. I suspect based on the sentiments reading we had there a lot of folk in that position. Not good! 🙁
news (XIV) VelocityShares Daily Inverse VIX Short-Term ETN
When are they going to announce liquidation? Still halted pending news. What are they waiting for?
Kudos to Chris who stated clearly and definitively on this forum 4 or so months ago that XIV would go so low it would be liquidated when the next massive VIX spike occurred. I didn’t understand and I didn’t believe it. What I still don’t understand is why/how XIV held firm yesterday during the day session even as the VIX was going parabolic, and only collapsed in the after hours market. Why wasn’t the VIX futures markets going nuts to the upside during the late day session, and hence XIV tanking in the final hour yesterday? Very odd. At any rate…bye bye! And so far, no giant ripple effect through the market.
Simple. They re-balance DAILY!
Thanks Kevin, our clients are super stoked they avoided that and were on the other side. Verne, I’m out of all long VIX exposure and shorts. Looking to re-load on the bounce. Just bought a surf trip to Mexico in May and taking clients out for a lush dinner event!!!
Sweet! Way to go Chris. Appreciated having someone around who did not think I had taken complete leave of my senses.
Thinking about heading down to my island for some R&R as well. John Carter and some of his team are going to be at Branson’s place if they get done with hurricane repairs on time.
Wam Bam!
I hope everyone’s nest eggs are okay in this debacle. I managed to avoid being in XIV overnight, though I was in it for a few minutes yesterday! Whew.
Time to watch and wait I think. If this is about over, there is NO RUSH to get long! It’s not going up anywhere near the speed it came down! So I’m going to chill and enjoy the show. I want to see CLEAR and COMPELLING evidence of a new 5 wave up launched and running, THEN I will commit, bigly. That may take several days, perhaps even weeks. This is hard for me but in one sense I’ve been waiting all year for this kind of pullback so I can commit on the large side with relatively low risk, and I dont’ want to do that 5% too early!!!! Lol!! (Except it would not be funny.)
Best of luck to all today.
Close call for me too. I had a STB XIV yesterday, but price dropped away and I canceled it.
Of course, there is the fact that SPX is ONLY back at the beginning of December price. That’s only TWO MONTHS of gains, lost. It’s nothing in one sense, and helps put this correction into proper perspective.
Bit of a nightmare here even with stops. The joys when you leverage
Back to building the business and the sidelines until this settles
Good luck all xx
Does ES at 2533 last midnight = Laura’s “Thereafter, minute wave 4 may continue lower to the 0.618 Fibonacci ratio of minor wave 3 at 2,533.”
NO… for Lara it has to happen during normal trading hours.
So all her targets and counts still in play and valid…
Thanks
Lowry’s are saying this is a correction.
If the top is minor 3, then on the ES weekly continuation chart, price has retraced so far to .618 of minor 3
If the top is intermediate (3), then price has retraced to just below 0.382 of (3).
I fully undestand they have to keep saying that to maintain credibility as they have long insisted that an absence of A/D divergence precluded onset of a bear market. They could be right. My suspicion js that most traders looking at what is going on, whatever their prior expectations, are now open to other possibillities. I think it is very dangerous to try and tell Mr Market what he can and cannot do. I have traded literally bundreds of VIX penetrations above its upper B band and did the same thing yesterday. Mr. Market did not care bow many times in the past I had successfully made that trade, he told me in no uncertain terms that I was wrong, so I exited. I think placing stock in what the market has done in the past could be failing to recognize that we have never had a market quite like tbis one. How could we as traders NOT see tbis??!!
/ES Hit 2533.25 as I started to read this … now at 2538
DJIA at it worst point overnight, had it opened, would have been down 1,330… right now down 618.
VIX high 46.42 now 45.05
UVXY 36.20
VXX 60.74
XIV and SVXY halted… probably ZERO.
Anyone know what trading assets make up these ETN’s and how would all that unwind along with how it affects the markets?
Joseph
It is all over the map now DOW only down 68 points earlier was 390.. waiting and watching
Down 68 is really down 445. Right now DOW would open down 540… you not factoring in Fair Value adjustment.
Overnight was down 1,330 Total correction 13%+ if
Holy Crap! Buy Gold and Silver + miners!
Joseph,
Interesting enough I am not seeing the love you expect GOLD and SILVER would get in this panic meltdown…something is not adding up here.
Now that XIV and SVXY have blown Up and we get another flush today,
I am hoping, wishing that everything that has stopped working the last several years… will start working again. All old line signals back to normal!
If Not, I am done for good!
And yes… it was looking good last night and late this morning it faded.
The banksters are buying. Let’s see if their hubris is warranted. We could be starting to see a turn in sentiment, at least for tbose paying attention.
Verne,
I was reading another report and they stated the following in context of VIX spike
1. Based on historical data, these spikes do not last long over 95% of the time.
2. Approximately 80% or more times when such a spike occurs , market bounces within a few days.
3. Approximately 60% or more times when such a spike occurs , after a week or two, market starts climbing up.
Take it with a grain of salt but with new FED Chair coming in, there will be a drive to take markets higher to show control.
Does anybody think the banksters are behaving any different than they did on election night, 2016?
Whatever your conclusion, there are only two possibilities- this price action is taking place WITH, their permission, or WITHOUT it! 🙂
Don’t bring 2016 Election night back as I have been burnt real bad when I went to bed expecting a big payday and only to find it gone…
I remember. My thesis is that they will try, if they can, to prevent serious market declines, therefore when serious market declines occur, they do so in spite of central banks’ attempts to halt them. The name of the game for me has always been trying to identify at when they lost their ability to effectively intervene in market direction. I do not think we are quite there yet, but I think we are getting close.
Yes
Does this = Laura’s “Thereafter, minute wave 4 may continue lower to the 0.618 Fibonacci ratio of minor wave 3 at 2,533.”
Low of 2529.
First?
Not unless yer got ears like mine, Doc!
Looks that way, Bo. Ignore dat pesky wabbit!