Yesterday’s analysis expected the correction was still incomplete. Another sideways day, which moved price slightly lower, fits expectations overall.
Summary: A correction looks to be incomplete, so it may continue for a few more days. Targets for it to end are 2,796 or 2,749, with the higher target preferred. For the short term, look for a small bounce or some sideways movement tomorrow for a small B wave.
The larger trend remains upwards and corrections still offer an opportunity to join the trend.
Always practice good risk management. Always trade with stops and invest only 1-5% of equity on any one trade.
The biggest picture, Grand Super Cycle analysis, is here.
Last historic analysis with monthly charts is here. Video is here.
An historic example of a cycle degree fifth wave is given at the end of the analysis here.
MAIN ELLIOTT WAVE COUNT
WEEKLY CHART
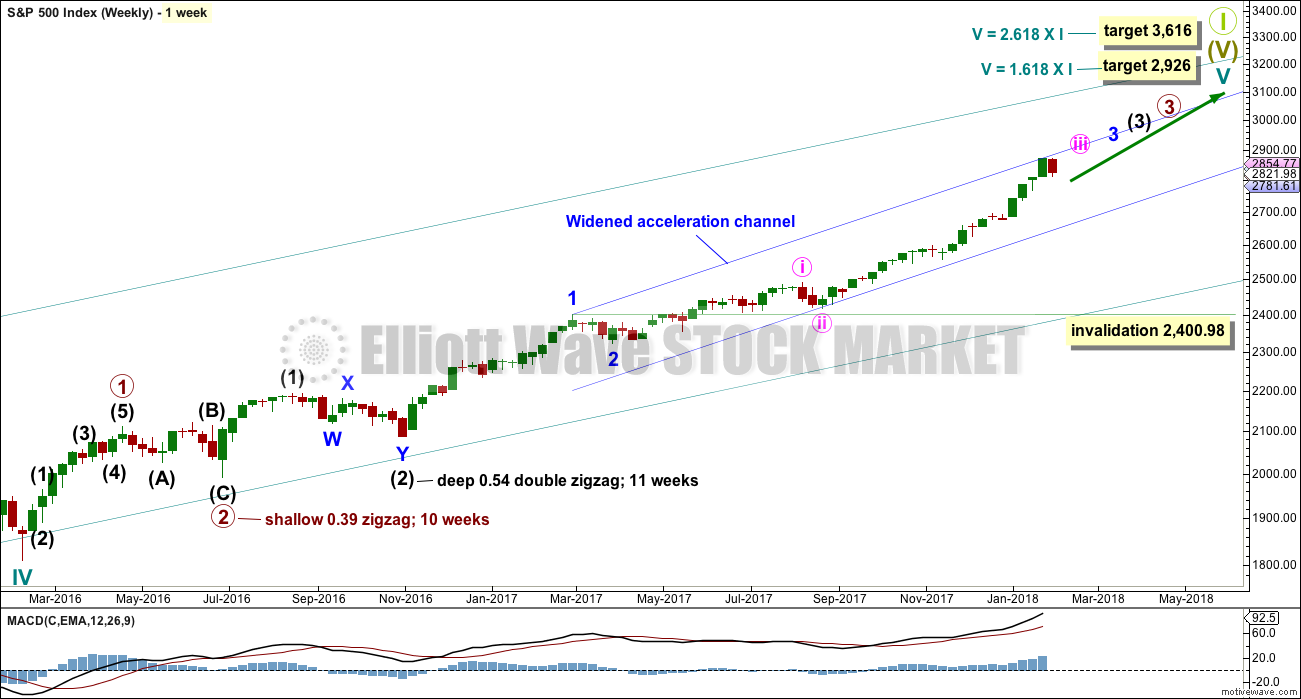
Cycle wave V must complete as a five structure, which should look clear at the weekly chart level. It may only be an impulse or ending diagonal. At this stage, it is clear it is an impulse.
Within cycle wave V, the third waves at all degrees may only subdivide as impulses.
Within cycle wave V, the corrections for primary wave 2 and intermediate wave (2) both show up clearly, both lasting several weeks. The respective corrections for intermediate wave (4) and primary wave 4 should also last several weeks, so that they show up at weekly and monthly time frames. The right proportions between second and fourth wave corrections give a wave count the right look. This wave count expects to see two large multi week corrections coming up.
Cycle wave V has passed equality in length with cycle wave I, which would be the most common Fibonacci ratio for it to have exhibited. The next most common Fibonacci ratio would be 1.618 the length of cycle wave I. This target at 2,926 now looks too low. The next most common Fibonacci ratio would be 2.618 the length of cycle wave I at 3,616. This higher target is looking more likely at this stage.
Intermediate wave (3) has passed all of equality in length with intermediate wave (1), and 1.618 and 2.618 the length of intermediate wave (1). It is possible that intermediate wave (3) may not exhibit a Fibonacci ratio to intermediate wave (1). The target calculation for intermediate wave (3) to end may have to be done at minor degree; when minor waves 3 and 4 are complete, then a target may be calculated for intermediate wave (3) to end. That cannot be done yet.
When minor wave 3 is complete, then the following multi week correction for minor wave 4 may not move into minor wave 1 price territory below 2,400.98. Minor wave 4 should last about four weeks to be in proportion to minor wave 2. It may last about a Fibonacci three, five or even eight weeks if it is a time consuming sideways correction like a triangle or combination. An Elliott channel may be drawn about the impulse of intermediate wave (3) when minor wave 3 is complete, and minor wave 4 may end about the lower edge of that channel.
At this stage, a widened acceleration channel is drawn now in blue about the impulse of intermediate wave (3). This is drawn in the same way as an Elliott channel using Elliott’s first technique, and then the lower edge is pulled down to contain all this recent upwards movement.
A third wave up at four degrees may be completing. This should be expected to show some internal strength and extreme indicators, which is exactly what is happening. Members are advised to review the prior example given of a cycle degree fifth wave here. The purpose of publishing this example is to illustrate how indicators may remain extreme and overbought for long periods of time when this market has a strong bullish trend. If the current wave count is correct, then the equivalent point to this historic example would be towards the end of the section delineated by the dates November 1994 to May 1996. In other words, the upwards trend for this fifth wave may only have recently passed half way and there may be a very long way up to go yet.
DAILY CHART
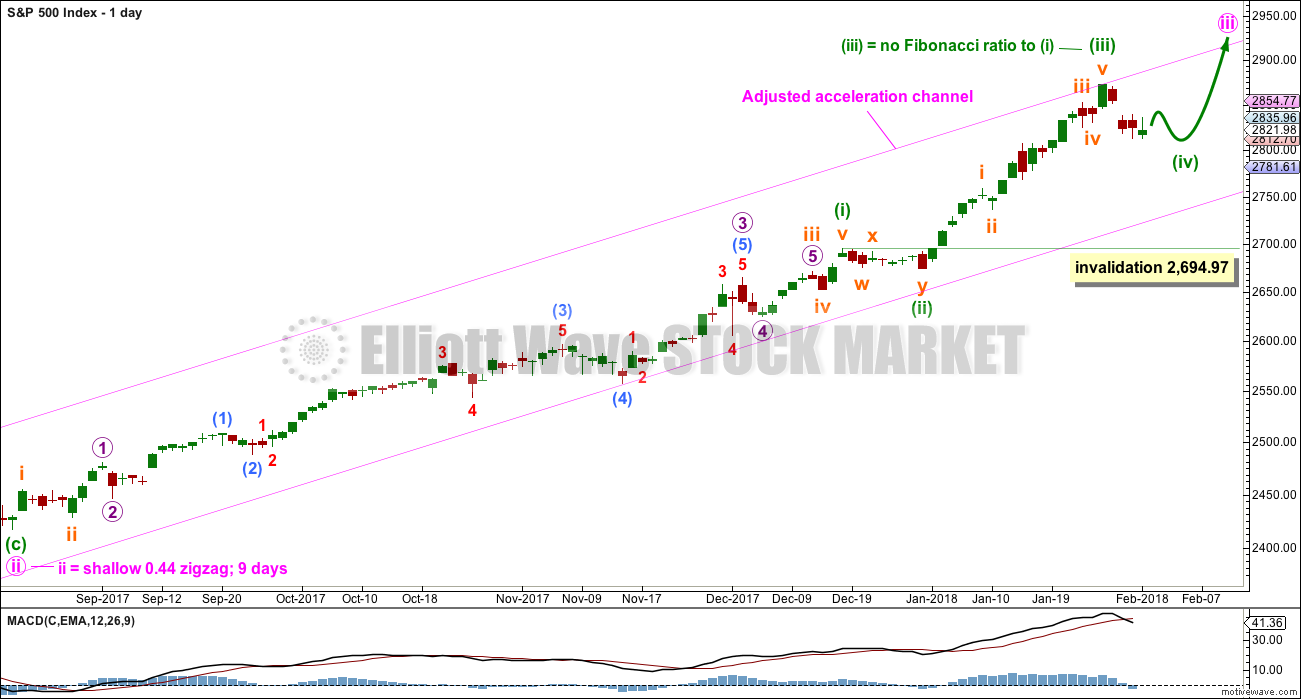
Keep redrawing the acceleration channel as price continues higher: draw the first line from the end of minute wave i to the last high, then place a parallel copy lower down to contain all this upwards movement. When minute wave iii is complete, this would be an adjusted Elliott channel and the lower edge may provide support for minute wave iv.
Minuette wave (ii) subdivides as a combination and lasted only eight sessions, about only one and a half weeks. Minuette wave (iv) may be a zigzag, which tend to be quicker structures than combinations; a Fibonacci five days will be the first expectation, but at this stage it has lasted four days and may be only about half way through. It may last a Fibonacci eight days in total.
Minuette wave (i) was a long extension. Minuette wave (iii) may have ended at the last high and if so would be shorter than minuette wave (i). This limits minuette wave (v) to no longer than equality in length with minuette wave (iii) so that minuette wave (iii) is not the shortest actionary wave.
Minuette wave (iv) may not move into minuette wave (i) price territory below 2,694.97.
Minute wave iii has passed equality in length with minute wave i, and has passed 1.618 and 2.618 the length of minute wave i. A target for minute wave iii to end must now be calculated at minuette degree. That cannot be done until minuette wave (iv) has ended.
HOURLY CHART
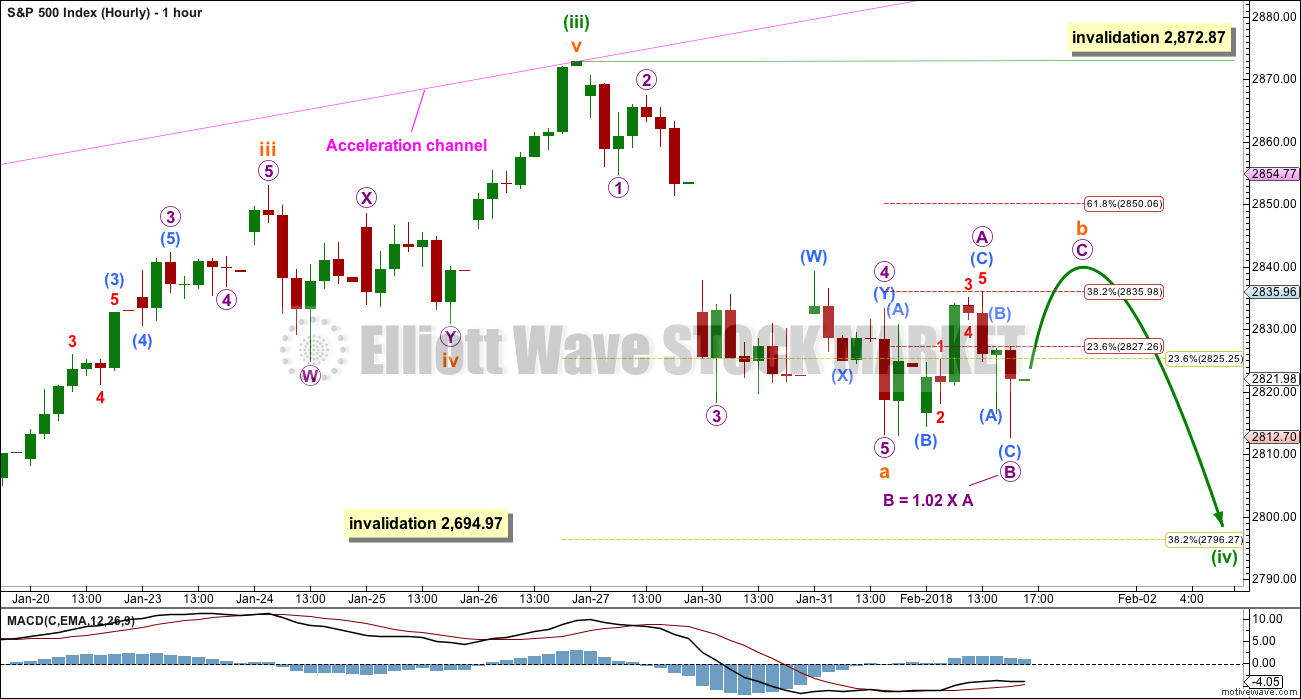
A five down may now be complete. If this is correct, then minuette wave (iv) may be unfolding as a zigzag. Within the zigzag, subminuette wave b may not move beyond the start of subminuette wave a above 2,872.87.
Subminuette wave b may be any corrective structure. It may end about the 0.382 Fibonacci ratio of subminuette wave a if the gap is a breakaway gap, or it may end about the 0.618 Fibonacci ratio of subminuette wave a if the gap turns out to be a pattern gap.
At this stage, resistance at the gap is holding. If it continues, then subminuette wave b may be relatively shallow. Subminuette wave b so far fits as a regular flat correction. It may end tomorrow.
When subminuette wave b is complete, then subminuette wave c downwards may take price down to the 0.382 Fibonacci ratio of minuette wave (iii) at 2,796.
ALTERNATE HOURLY CHART
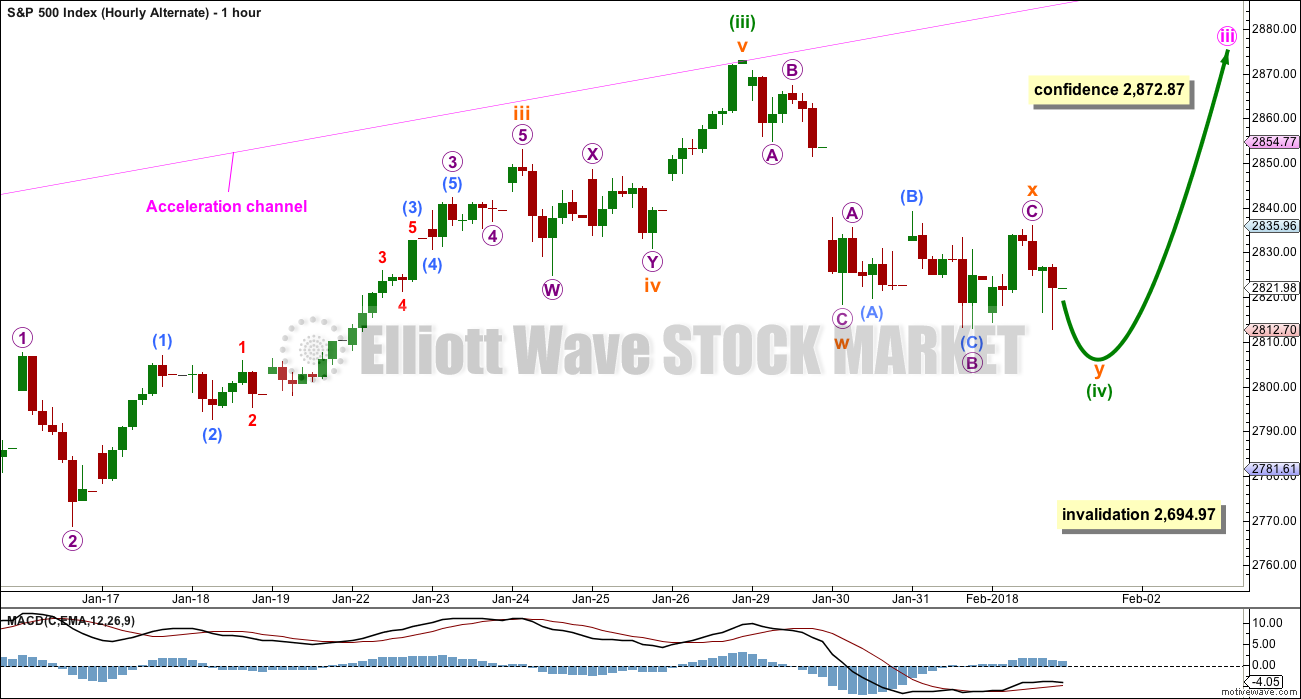
It is still possible that minuette wave (iv) is unfolding as a double zigzag, but today it is a little more difficult to see it complete. It is possible that the second zigzag in the double for subminuette wave y was over at today’s low, but then it would have barely deepened the correction. The purpose of a second zigzag is to deepen the correction when the first zigzag does not move price deep enough.
A double zigzag would have a more typical look if subminuette wave y moved lower tomorrow.
TECHNICAL ANALYSIS
WEEKLY CHART
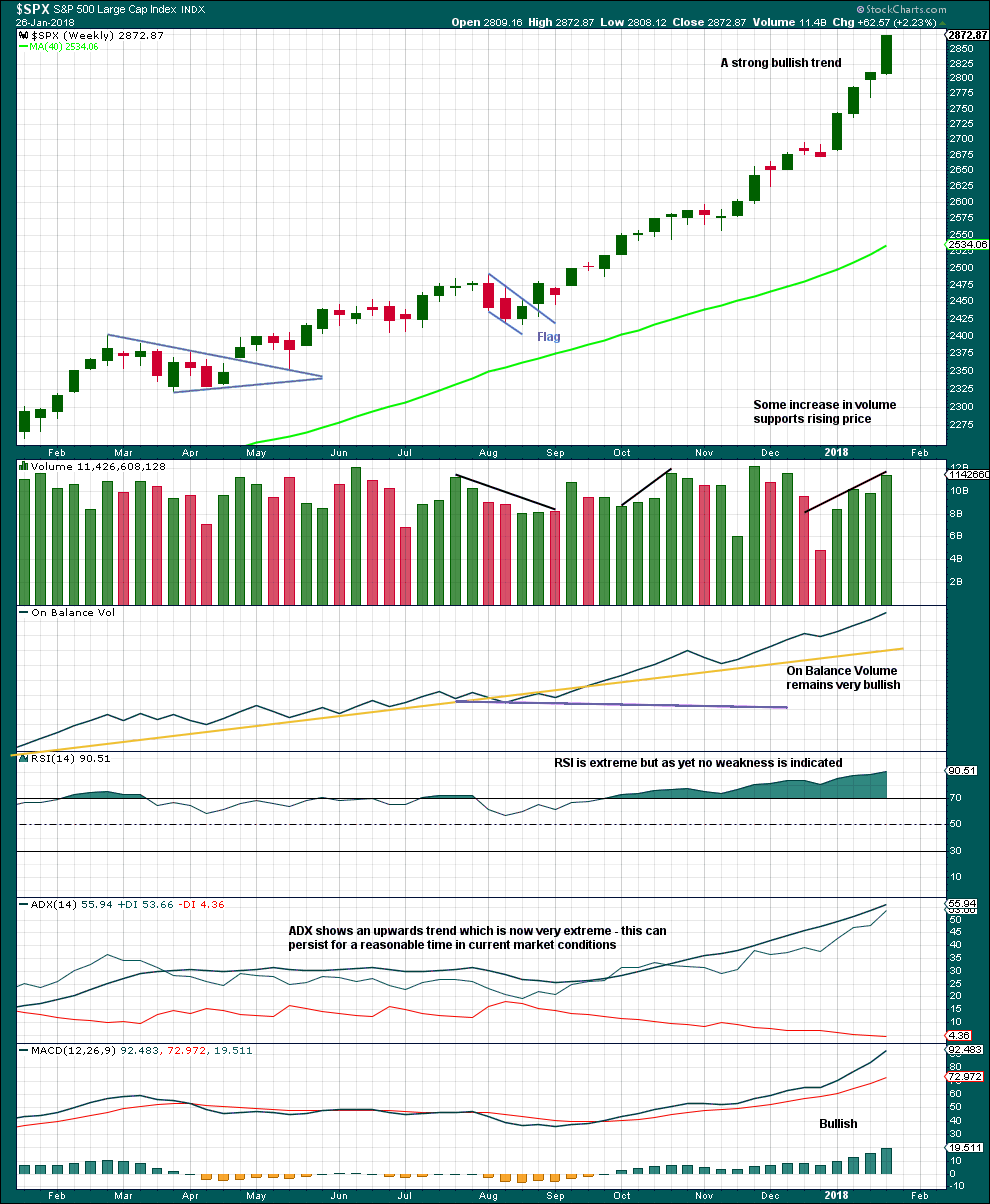
Click chart to enlarge. Chart courtesy of StockCharts.com.
This upwards trend is extreme and stretched, but there is still no evidence of weakness at the weekly time frame.
There is no divergence to indicate any weakness yet between price and RSI.
As a third wave at multiple degrees comes to an end, it would be reasonable to see indicators at extreme levels.
A correction will come, but it looks like it may not be here yet.
DAILY CHART
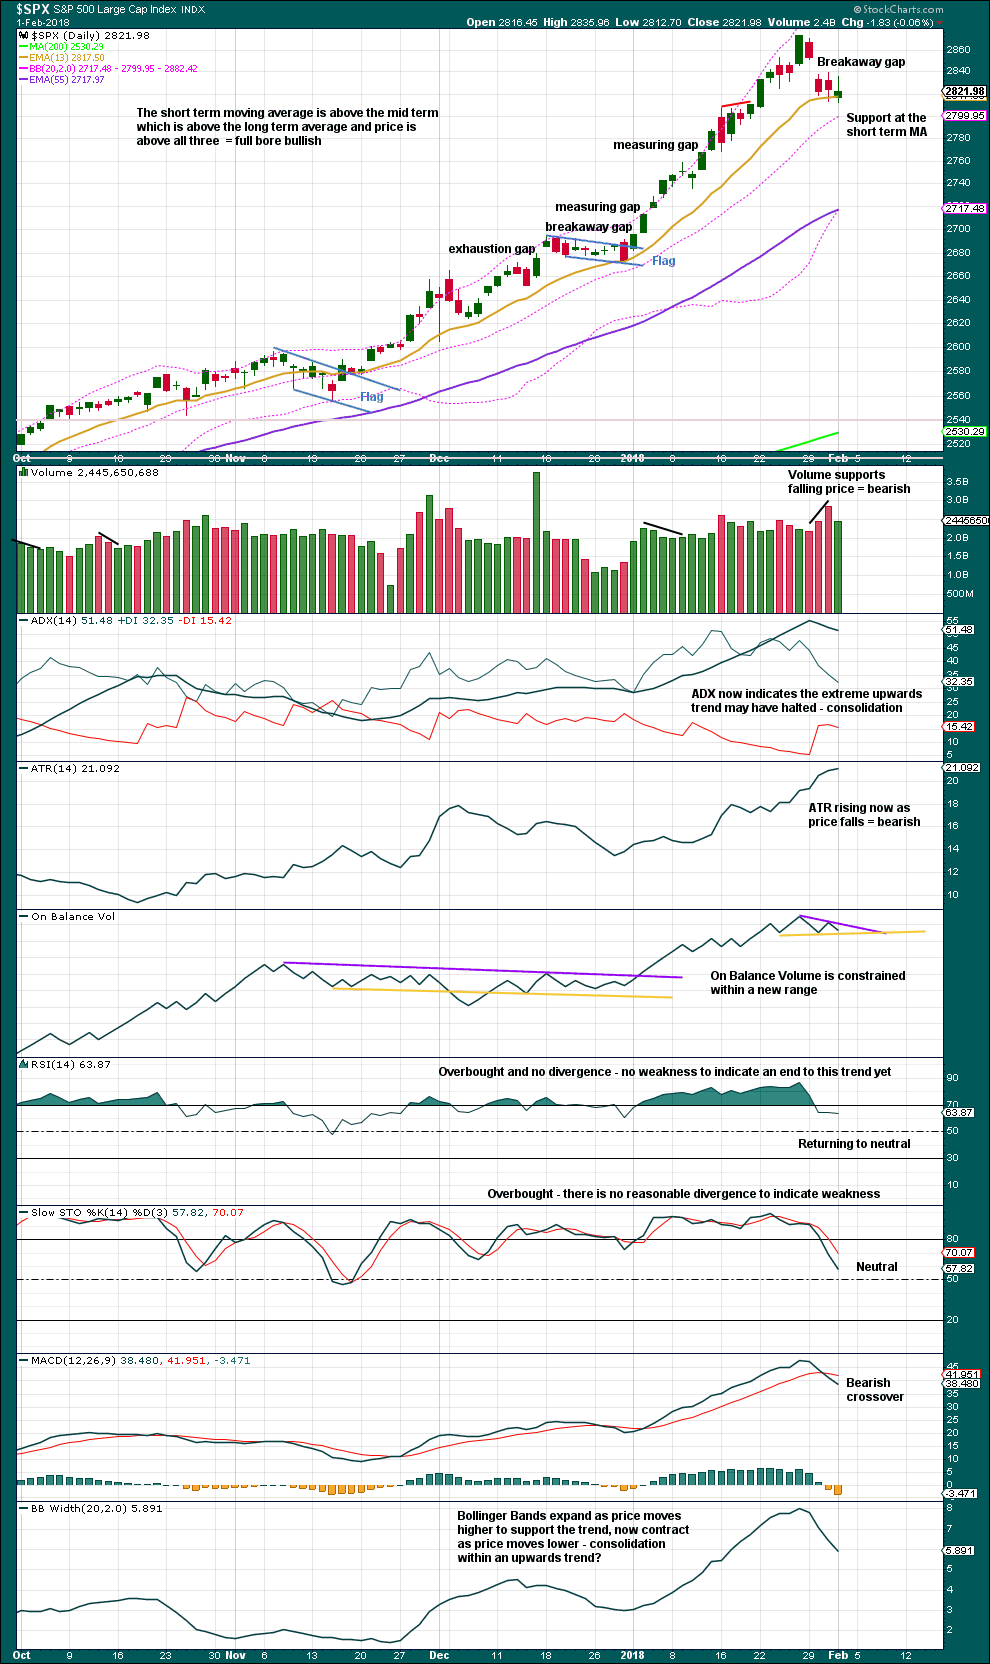
Click chart to enlarge. Chart courtesy of StockCharts.com.
The gap may be assumed to be a breakaway gap, until proven otherwise. If it is closed by a high at or above 2,851.48, then it would be indicated as a pattern or common gap.
Price moved lower today and the balance of volume is down. Volume was weaker which may be read as slightly bullish.
On Balance Volume now has a new range. A breakout here would provide a weak signal.
VOLATILITY – INVERTED VIX CHART
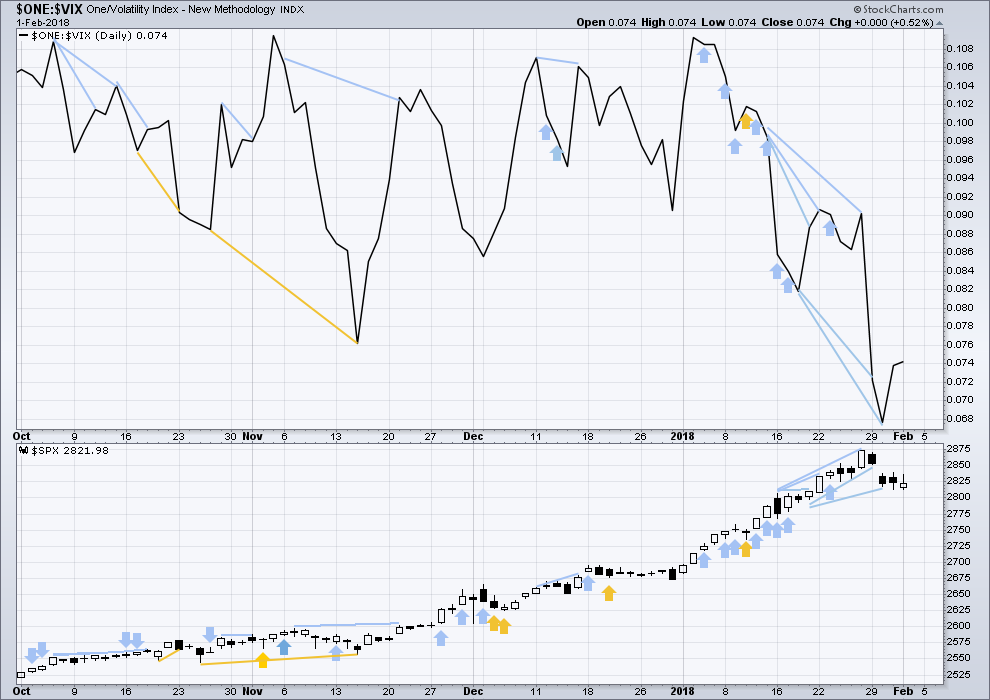
Click chart to enlarge. Chart courtesy of StockCharts.com.
So that colour blind members are included, bearish signals will be noted with blue and bullish signals with yellow.
Normally, volatility should decline as price moves higher and increase as price moves lower. This means that normally inverted VIX should move in the same direction as price.
Volatility still remains much stronger than downwards movement in price suggests. This may be still read as bearish.
BREADTH – AD LINE
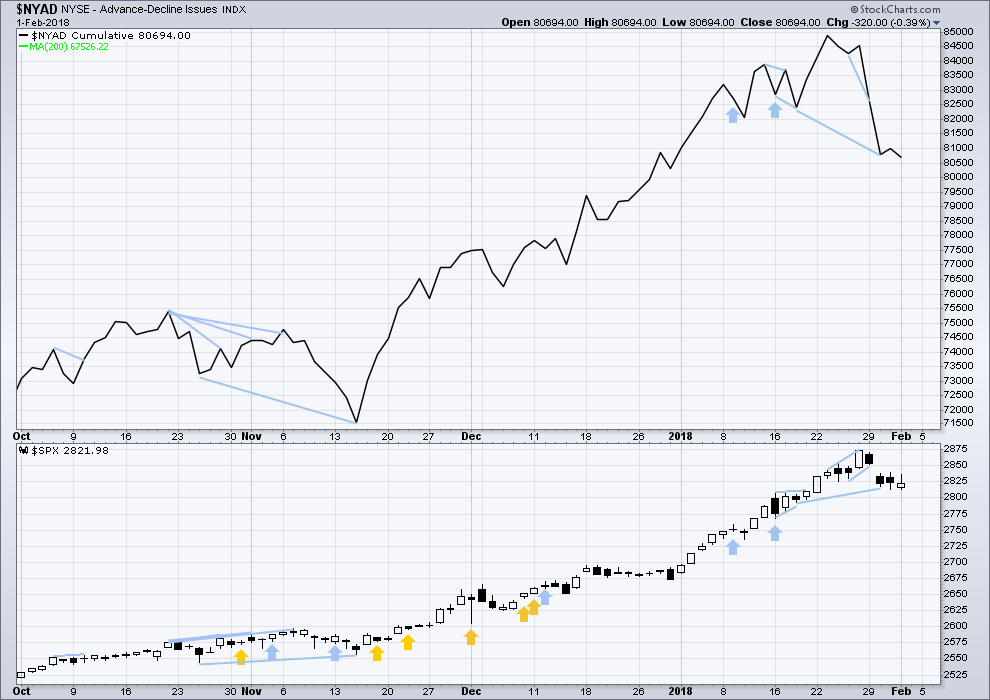
Click chart to enlarge. Chart courtesy of StockCharts.com.
There is normally 4-6 months divergence between price and market breadth prior to a full fledged bear market. This has been so for all major bear markets within the last 90 odd years. With no longer term divergence yet at this point, any decline in price should be expected to be a pullback within an ongoing bull market and not necessarily the start of a bear market.
All of small, mid and large caps last week made new all time highs. This market has good support from rising breadth.
Breadth should be read as a leading indicator.
Breadth has made a new swing low below the 18th of January. This is a bearish signal. This divergence still remains, so it still supports the main hourly Elliott wave count.
Both price and the AD line made slight new lows today. The new low in price is supported by a decline in market breadth. This is slightly bearish.
DOW THEORY
The S&P500, DJIA and Nasdaq last week made new all time highs. Only DJT did not make a new all time high and has moved lower. This divergence is slightly bearish; DJT may be leading by beginning a correction first.
The following lows need to be exceeded for Dow Theory to confirm the end of the bull market and a change to a bear market:
DJIA: 17,883.56.
DJT: 7,029.41.
S&P500: 2,083.79.
Nasdaq: 5,034.41.
Charts showing each prior major swing low used for Dow Theory are here.
Published @ 08:53 p.m. EST.

So DOW down 665.75… rounded to 666!
I wonder the significance of that number as that is what the S&P closed at 666 in Mar of 2009. The bottom close in 2009.
Lots of sixes in the DJI ATH as well….curious! 🙂
Higher high in VIX means third wave still underway. We need a spike higher to conclude the third wave followed by a lower high to mark completion of the fifth. Time to open stink bids on VIX puts.
Should have listened to the VIX closing above it’s trendline on Monday and thrown out a Hail Mary short. Move turned out to be quite significant after all. I told myself leading up to it that I would short if it closed above the line, but then chickened out when it actually happened. Oh well.
my revised RUT count. Price holding at moment at a key 62% retrace. Invalidation is down around 1517 (white line just above the blue).
BTW, NDX tagged and is dancing around it’s head and shoulders measured move price of 6770.
Bottom in. Right off the fibo cluster. And RUT right at it’s EW invalidation point. I could be wrong (again)…
Just keeps dropping. Wow.
Lol! “Wrong again, Batman!”.
That 2749.5 fibo looks very likely now.
It takes some real elliott wave trust to see/be able to count a large complete 5-3-5 zig-zag 4, and go long close to the low just after it forms.
Not me, man. Not on Friday afternoon.
Hopefully Monday might give us a sweet entry point to go long.
I can’t find a target calculation using ratios between subminuette a and c that coincides with a Fibonacci ratio. So I’ll just use the ratio between a and c, and firstly assume the most common of equality.
The channel though is very good. If price breaks above the upper edge then assume the pullback is over and the upwards trend is resuming.
While price remains within the channel assume the pullback is still continuing. That’s the bottom line this morning.
Notice the 0.618 Fibonacci ratio below at 2,749. If price keeps falling through my target at 2,776, then 2,749 would be the next target.
Lara, isn’t this a 3rd wave? massive momentum!!
It certainly could be. With such a strong bearish weekly candlestick and strong volume this week I’m going to have to consider this may be minute iv, not just minuette (iv), and that this may be an impulse down for an A wave.
But also, C waves can look like and behave like third waves.
I’m going back over the last corrections within this bull market all the way down to intermediate (2) on the hourly chart to look at how they ended.
There were a couple which ended with very strong C waves that looked like third waves, and if I recall correctly had us fooled into thinking the correction must continue because strength. Yet it didn’t.
That’s happened a few times. I don’t want to keep making those same mistakes. So I’ll have alternates.
Quite true. I wonder how heavily we should weigh the extreme sentiment that preceeded this decline…?
I’d be expecting very extreme sentiment, to fluctuate at and just below extreme, as cycle V comes to an end.
Moving towards the end of intermediate (3) we have to start to see corrections start to show some increase in market volatility, and slightly relieve extreme sentiment as they unfold.
In other words, I won’t be expecting right here and now that extreme bullishness means we have to see a deeper and longer lasting consolidation, something like intermediate (3) quite yet. It still needs to develop.
My next significant fibo cluster is right at the Jan 16 low, around 2768-2769. Just above that is a single 50% at 2773.
This is getting nasty!
Buy Gold!
I waited months for this! Putting a short on and off trying to catch it.
The one time I didn’t put the short on… a move big enough to actually make a decent profit occurs!
Again, Now anything I put on will go against me. I just know it! I should have put it on last week. $&^%
Unbelievable! No intraday bounce at all!
It is VERY early my friend, why worry? 😉
Hi Chris:
Take a look at Franceso Filia’s latest alert. If you have not got it yet I can post a link.
Post it please.
I don’t have it yet, please do if you don’t mind. I’m frankly a little shocked the Banksters are sitting on hands, and while I do expect a bounce, Monday could be an utter bloodbath if retail sells.
Francesco’s latest.
http://www.fasanara.com/chartbook-02022018
Nothing new, but great report. Thanks for sharing. We are certainly on the brink.
Yep! I thought it so interesting, knowing those guys, that they pushed it out today…
WIll some buyers emerge before the week closes? Lots of things on sale! I note the RUT can’t go much lower without doing a count invalidation; possible, but I suspect a RUT low is in, and frankly I suspect the overall SPX 4 wave is over too. But the proof is in the price action, and it’s being very stubborn so far after this first bounce.
Some might suggest this is the start of a larger decline. While certainly possible, there’s a lot of EW action to the upside called for by our count still. I believe the EW call before I believe the bear/”everything is overvalued” call. But we’ll see!
VIX poke above B band with slightly lower high classic end of fifth wave signal.
We will not really know if this is wave one of a new down-trend or if the correction is over for a bit. Key things to watch are the overhead gaps. Well, that does it for me folk.
Have an awesome weekend everybody!
That’s better! Got my 5 bagger on DIA 259 puts expiring tomorrow. BOO-YAH!! 🙂
Fantastic!! Took triples in VIX reloads, and covered IWM and DIA short almost at the low!! This looks like downtrend beginning, and I don’t see the banksters buying the last few days?!?
Going surfing.
😉
A sluggish VIX keeps put option contracts muted. Let’s hope we see it catch up with the price action…
Doesn’t a muted VIX imply an approaching bottom?
SPX is approaching the point where X=Y, also a major 62 fib. 2789.5 to 2786 range. I’m guessing that’s going to be the bottom, but let’s see.
A spike is actually a better signal. I know it does seem counter-intuitive… 🙂
A first bounce off the 2788.3 fibo, but not very strong! There needs to be a real push up to reasonably confirm this as a bottom. It’s weak…
With a strong temptation to load up on UPRO very soon, I have to mention that I at least harbor some serious correction concerns should the US initiate military operations against NK. I would expect a market devastation if that happens. This is my one major concern re: taking maximal advantage of this tremendous pullback.
Is there seriously any danger of that? Let’s be honest, neither side wants a nuclear catastrophe.
Is 2802- 2796 the spot? So right here?
Looks like it should be, have closed half my shorts from Monday and have put the rest at half way between the opening price and the low.
Longterm account is still fully long but not quite yet comfortable adding to it. Maybe a missed oppurtunity but will wait until after the weekend and see what the price action says
For me, no. I don’t see a bottom formed yet. I want to see (ideally) a stop and turn at a fibo, then some kind of bullish action (a strongly rising 5 minute bar at least) before starting to throw the long bombs.
Also keep in mind the head/shoulders in NDX. Measuring rule says NDX should go down to about 6775. It’s only about 1/2 way there. It may not of course but….something else to keep an eye on.
Thanks Kevin
Lets see what the remainder of the session provides!!
Looking forward to the final wave up 🙂
Lots and lots of fibonacci retracement levels available for a turn, lol!!! Three different fibo retrace projections overlaid here. The white line is where W=Y.
Something very strange is going on with VIX. Either the complacency has morphed into outright recklessness, or that print is “delayed”. VIX should be higher
Not a bad idea to cash in profits on short trades at the open as we could see a sharp reversal. If VIX moves above 15 and holds, lots more downside ahead…
2796.1 touched in futures and then a small bounce
Maybe the lower Target is the one?
Wait for cash market to open as that will tell you the tale.
Wow no wabbit still 😉
Move over…Doc!