
A correction was expected to continue. Sideways movement in a small range to complete an outside day fits this expectation.
Summary: A correction looks to be incomplete, so it may continue for a few more days. Targets for it to end are 2,796 or 2,749, with the higher target preferred. For the short term, look for a bounce or some sideways movement tomorrow for a small B wave.
The larger trend remains upwards and corrections still offer an opportunity to join the trend.
Always practice good risk management. Always trade with stops and invest only 1-5% of equity on any one trade.
The biggest picture, Grand Super Cycle analysis, is here.
Last historic analysis with monthly charts is here. Video is here.
An historic example of a cycle degree fifth wave is given at the end of the analysis here.
MAIN ELLIOTT WAVE COUNT
WEEKLY CHART
Click chart to enlarge.
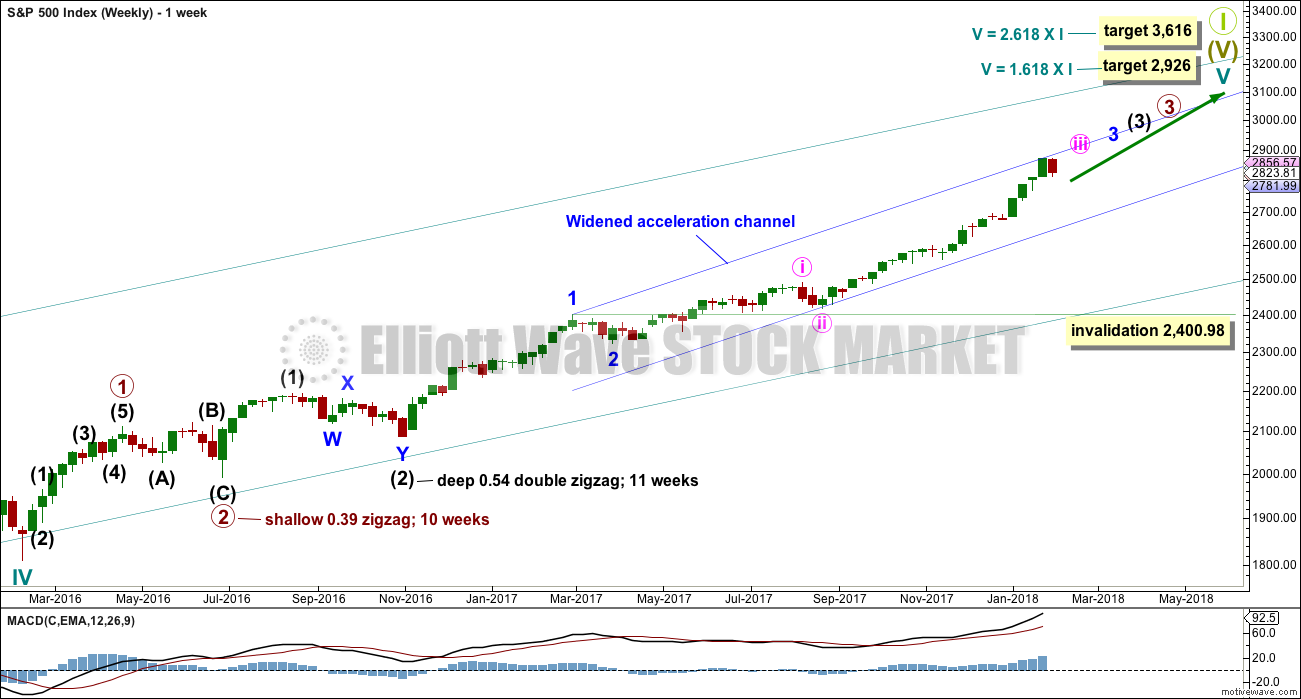
Cycle wave V must complete as a five structure, which should look clear at the weekly chart level. It may only be an impulse or ending diagonal. At this stage, it is clear it is an impulse.
Within cycle wave V, the third waves at all degrees may only subdivide as impulses.
Within cycle wave V, the corrections for primary wave 2 and intermediate wave (2) both show up clearly, both lasting several weeks. The respective corrections for intermediate wave (4) and primary wave 4 should also last several weeks, so that they show up at weekly and monthly time frames. The right proportions between second and fourth wave corrections give a wave count the right look. This wave count expects to see two large multi week corrections coming up.
Cycle wave V has passed equality in length with cycle wave I, which would be the most common Fibonacci ratio for it to have exhibited. The next most common Fibonacci ratio would be 1.618 the length of cycle wave I. This target at 2,926 now looks too low. The next most common Fibonacci ratio would be 2.618 the length of cycle wave I at 3,616. This higher target is looking more likely at this stage.
Intermediate wave (3) has passed all of equality in length with intermediate wave (1), and 1.618 and 2.618 the length of intermediate wave (1). It is possible that intermediate wave (3) may not exhibit a Fibonacci ratio to intermediate wave (1). The target calculation for intermediate wave (3) to end may have to be done at minor degree; when minor waves 3 and 4 are complete, then a target may be calculated for intermediate wave (3) to end. That cannot be done yet.
When minor wave 3 is complete, then the following multi week correction for minor wave 4 may not move into minor wave 1 price territory below 2,400.98. Minor wave 4 should last about four weeks to be in proportion to minor wave 2. It may last about a Fibonacci three, five or even eight weeks if it is a time consuming sideways correction like a triangle or combination. An Elliott channel may be drawn about the impulse of intermediate wave (3) when minor wave 3 is complete, and minor wave 4 may end about the lower edge of that channel.
At this stage, a widened acceleration channel is drawn now in blue about the impulse of intermediate wave (3). This is drawn in the same way as an Elliott channel using Elliott’s first technique.
A third wave up at four degrees may be completing. This should be expected to show some internal strength and extreme indicators, which is exactly what is happening. Members are advised to review the prior example given of a cycle degree fifth wave here. The purpose of publishing this example is to illustrate how indicators may remain extreme and overbought for long periods of time when this market has a strong bullish trend. If the current wave count is correct, then the equivalent point to this historic example would be towards the end of the section delineated by the dates November 1994 to May 1996. In other words, the upwards trend for this fifth wave may only have recently passed half way and there may be a very long way up to go yet.
DAILY CHART
Click chart to enlarge.
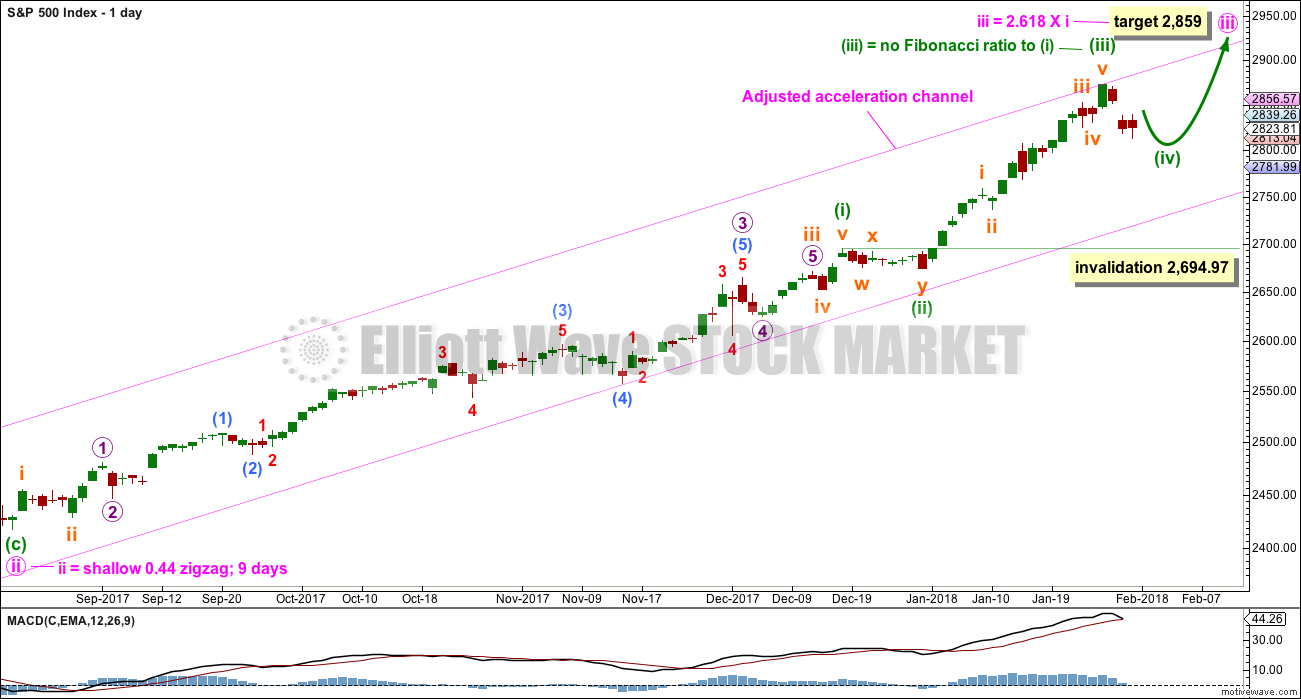
Keep redrawing the acceleration channel as price continues higher: draw the first line from the end of minute wave i to the last high, then place a parallel copy lower down to contain all this upwards movement. When minute wave iii is complete, this would be an adjusted Elliott channel and the lower edge may provide support for minute wave iv.
Minuette wave (ii) subdivides as a combination and lasted only eight sessions, about only one and a half weeks. Minuette wave (iv) may be a zigzag, which tend to be quicker structures than combinations; a Fibonacci five days will be the first expectation, but at this stage it has lasted three days and may be only about half way through. It may last a Fibonacci eight days in total.
Minuette wave (i) was a long extension. Minuette wave (iii) may have ended at the last high and if so would be shorter than minuette wave (i). This limits minuette wave (v) to no longer than equality in length with minuette wave (iii) so that minuette wave (iii) is not the shortest actionary wave.
Minuette wave (iv) may not move into minuette wave (i) price territory below 2,694.97.
Minute wave iii has passed equality in length with minute wave i, and has passed 1.618 the length of minute wave i. The next Fibonacci ratio in the sequence is used to calculate a target. This would still allow minuette wave (v) within it to be shorter than minuette wave (iii), so all Elliott wave rules could be met.
HOURLY CHART
Click chart to enlarge.
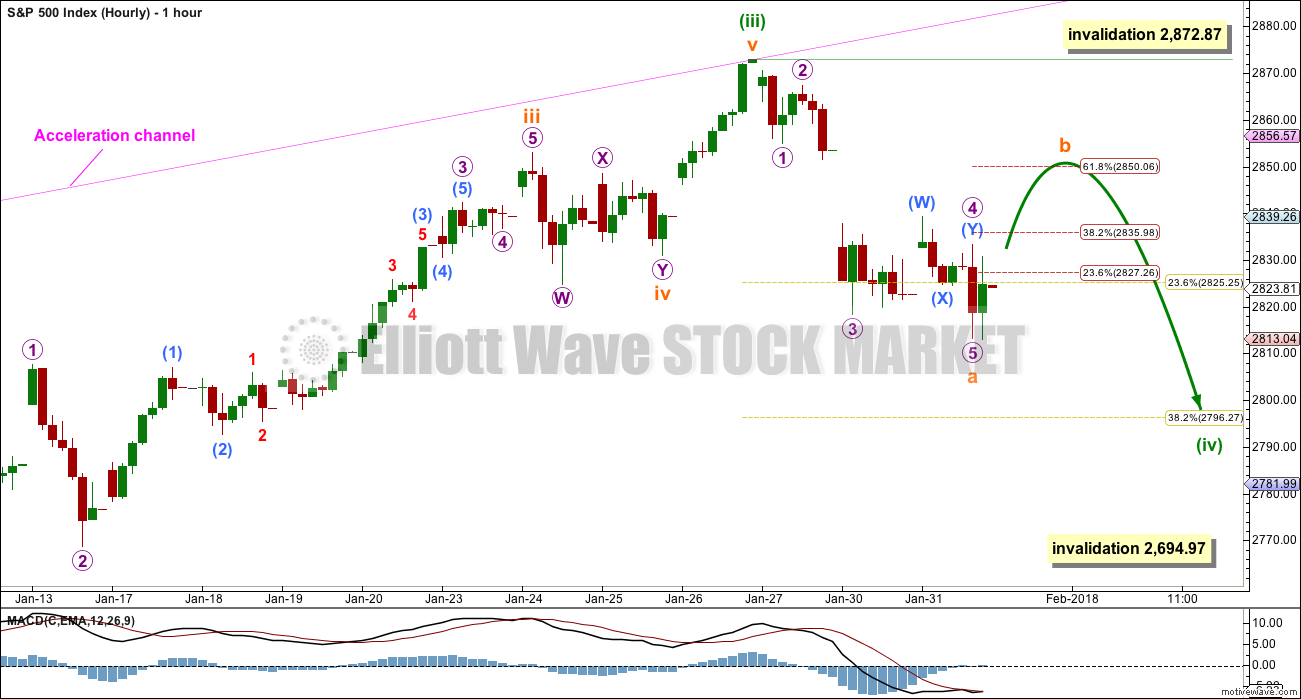
A five down may now be complete. If this is correct, then minuette wave (iv) may be unfolding as a zigzag. Within the zigzag, subminuette wave b may not move beyond the start of subminuette wave a above 2,872.87.
Subminuette wave b may be any corrective structure. It may end about the 0.382 Fibonacci ratio of subminuette wave a if the gap is a breakaway gap, or it may end about the 0.618 Fibonacci ratio of subminuette wave a if the gap turns out to be a pattern gap.
When subminuette wave b is complete, then another five down for subminuette wave c would complete a zigzag for minuette wave (iv).
ALTERNATE HOURLY CHART
Click chart to enlarge.
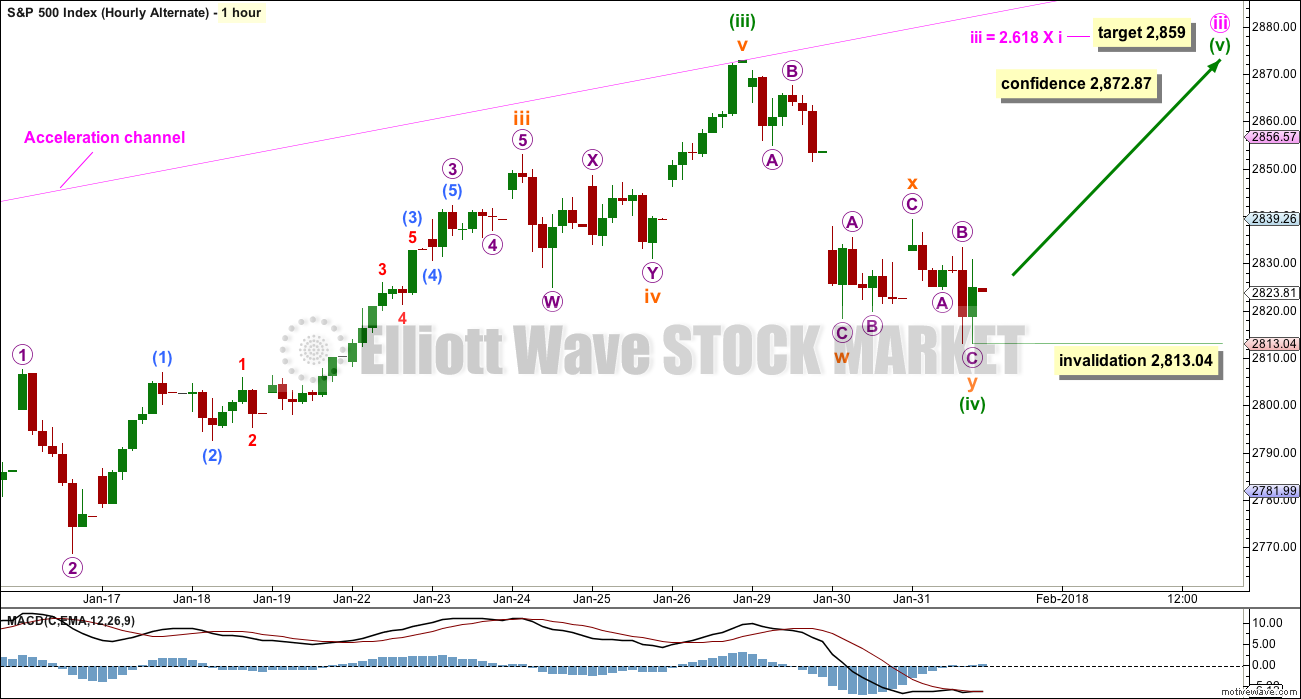
Downwards movement will actually fit better as a completed double zigzag. It is possible today that minuette wave (iv) could be over as a quick double zigzag lasting only a Fibonacci three days. This would have good alternation with the combination of minuette wave (ii) and the proportions would also be good.
A new high above 2,872.87 may be taken as confidence that the correction is over and was brief and shallow. Within minuette wave (v), no second wave correction may move beyond the start of its first wave below 2,813.04.
TECHNICAL ANALYSIS
WEEKLY CHART
Click chart to enlarge. Chart courtesy of StockCharts.com.
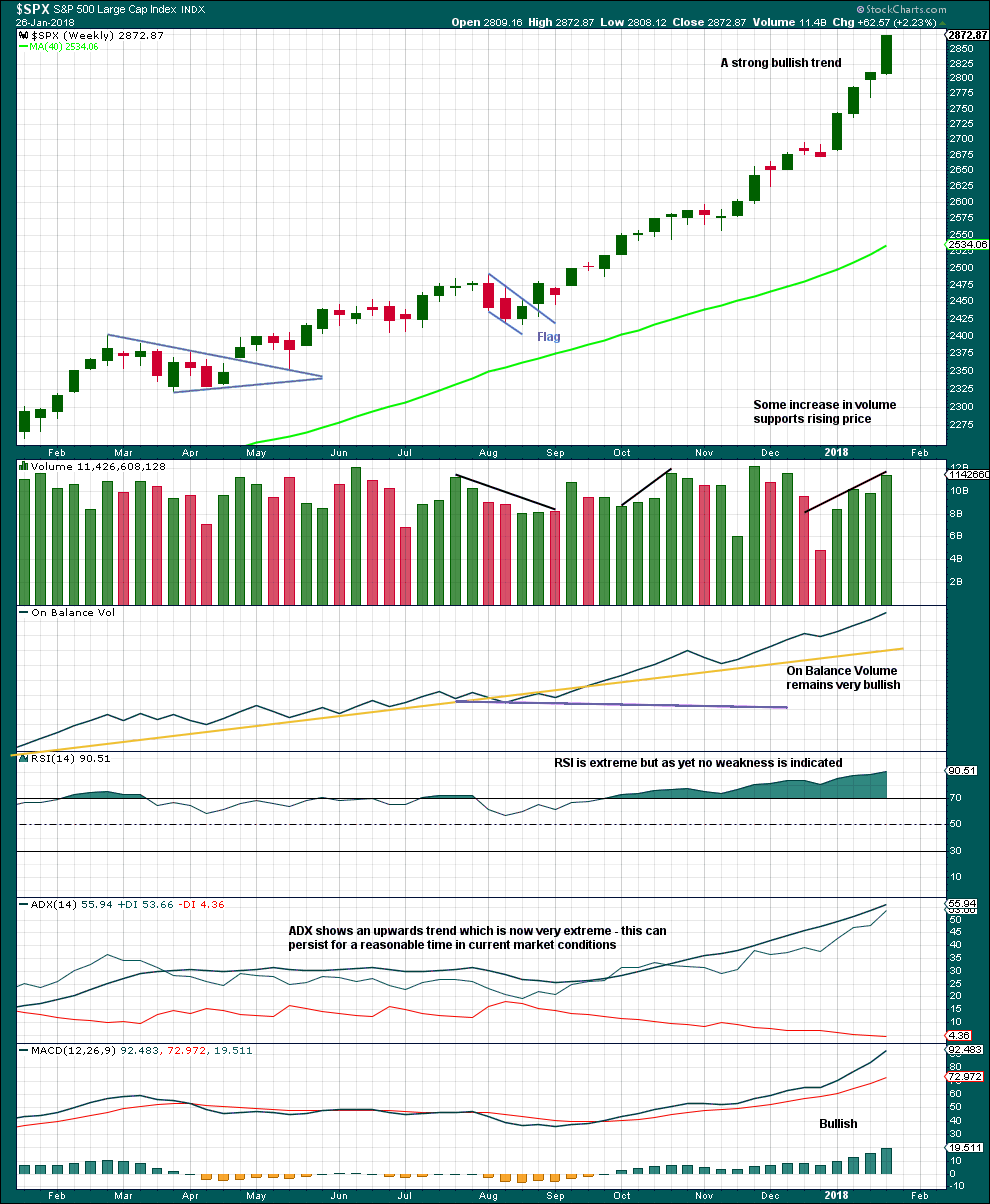
This upwards trend is extreme and stretched, but there is still no evidence of weakness at the weekly time frame.
There is no divergence to indicate any weakness yet between price and RSI.
As a third wave at multiple degrees comes to an end, it would be reasonable to see indicators at extreme levels.
A correction will come, but it looks like it may not be here yet.
DAILY CHART
Click chart to enlarge. Chart courtesy of StockCharts.com.
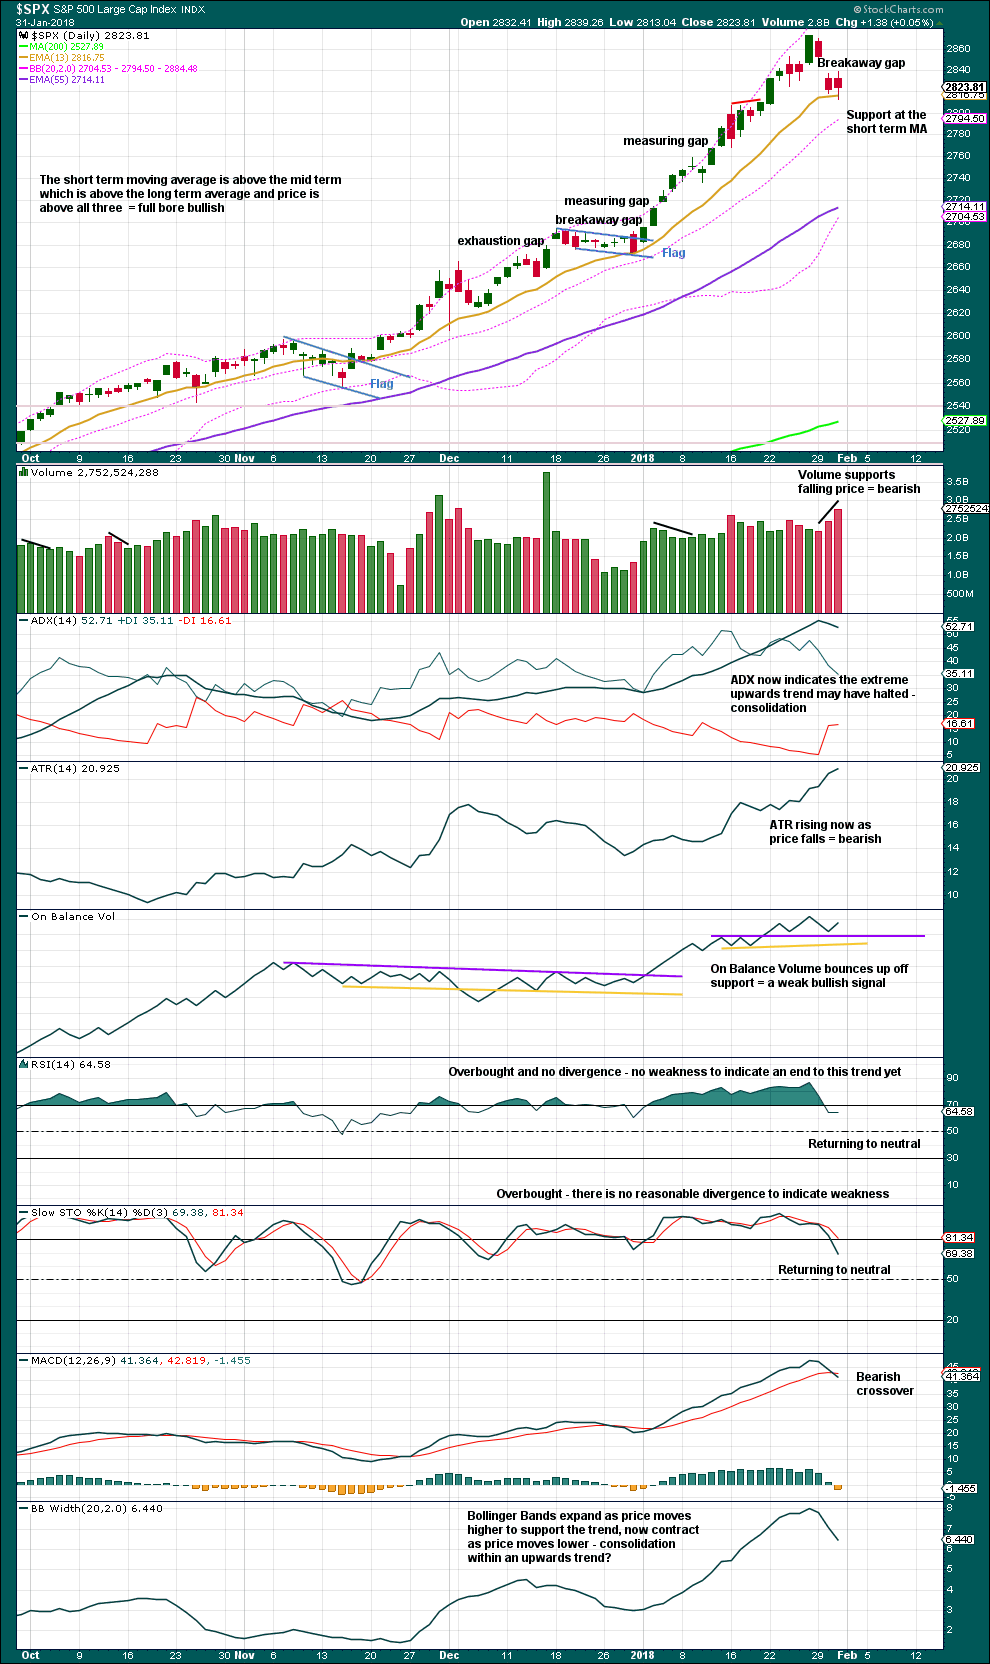
The gap may be assumed to be a breakaway gap, until proven otherwise. If it is closed by a high at or above 2,851.48, then it would be indicated as a pattern or common gap.
Volume, ADX and MACD today support the main hourly Elliott wave count.
The bullish signal from On Balance Volume is weak because the trend line has been breached then tested only once thereafter. This weak signal offers weak support to the alternate Elliott wave count.
VOLATILITY – INVERTED VIX CHART
Click chart to enlarge. Chart courtesy of StockCharts.com.
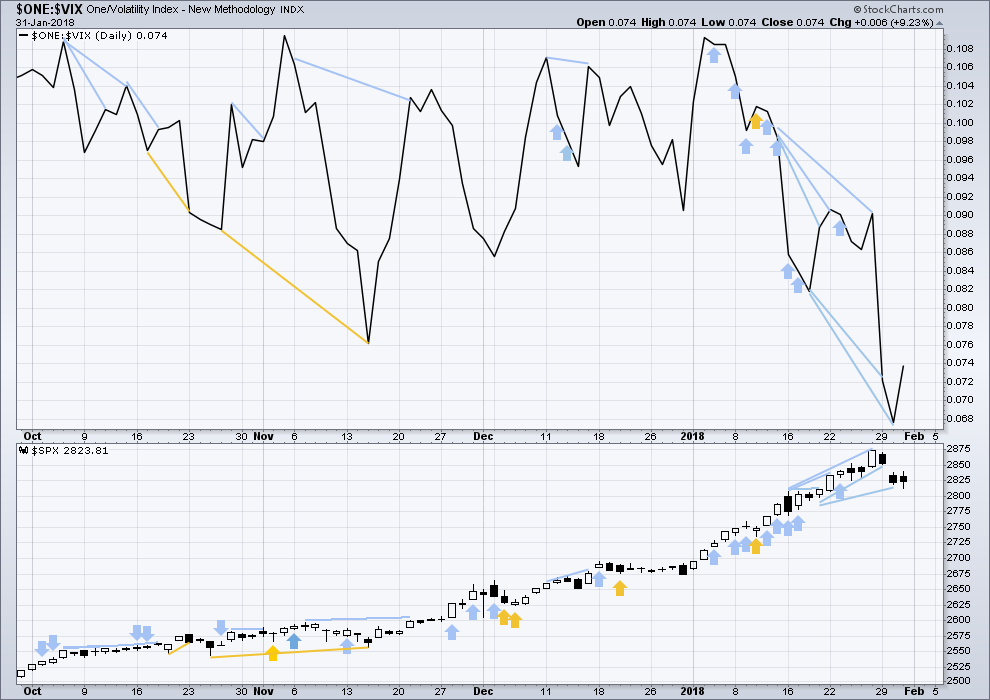
So that colour blind members are included, bearish signals will be noted with blue and bullish signals with yellow.
Normally, volatility should decline as price moves higher and increase as price moves lower. This means that normally inverted VIX should move in the same direction as price.
Volatility still remains much stronger than downwards movement in price suggests. This may be still read as bearish, supporting the main Elliott wave count.
BREADTH – AD LINE
Click chart to enlarge. Chart courtesy of StockCharts.com.
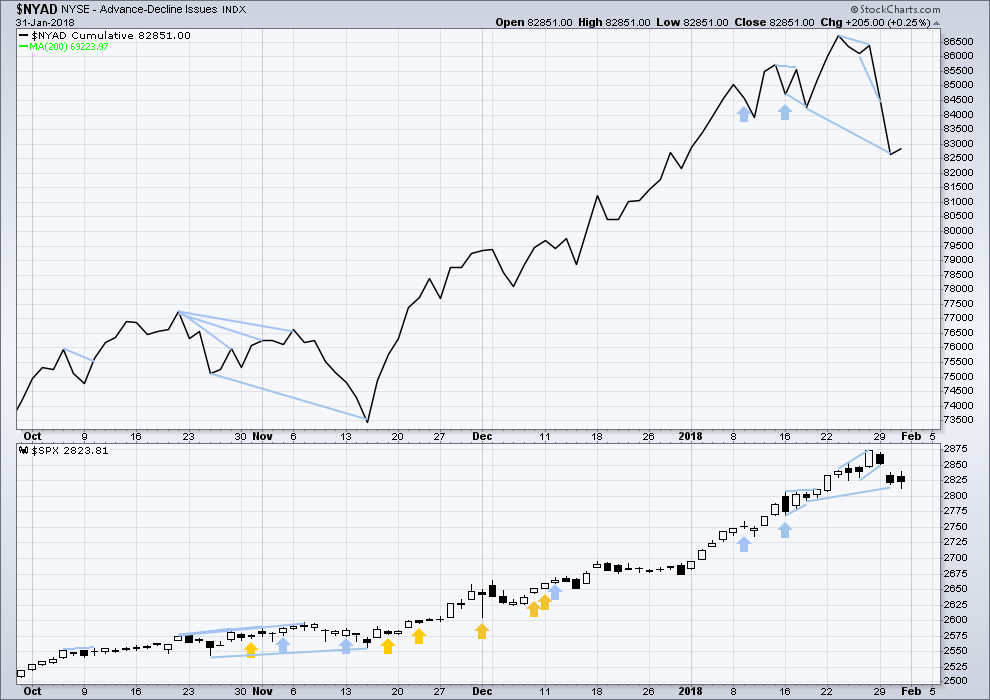
There is normally 4-6 months divergence between price and market breadth prior to a full fledged bear market. This has been so for all major bear markets within the last 90 odd years. With no longer term divergence yet at this point, any decline in price should be expected to be a pullback within an ongoing bull market and not necessarily the start of a bear market.
All of small, mid and large caps last week made new all time highs. This market has good support from rising breadth.
Breadth should be read as a leading indicator.
Breadth has made a new swing low below the 18th of January. This is a bearish signal. This divergence still remains, so it still supports the main hourly Elliott wave count.
DOW THEORY
The S&P500, DJIA and Nasdaq last week made new all time highs. Only DJT did not make a new all time high and has moved lower. This divergence is slightly bearish; DJT may be leading by beginning a correction first.
The following lows need to be exceeded for Dow Theory to confirm the end of the bull market and a change to a bear market:
DJIA: 17,883.56.
DJT: 7,029.41.
S&P500: 2,083.79.
Nasdaq: 5,034.41.
Charts showing each prior major swing low used for Dow Theory are here.
Published @ 07:11 p.m. EST.
Looks like we are printing some kind of triangle. Running? Barrier?
One thing is certain-a sharp move’s a coming with an equally sharp reversal so get ready. I love triangles! Have a great evening all!
Yep or an expanded flat for subminuette b
Hmm, what does it mean that we made a new low so soon?
Correction not over, and potential for lower lows in the immediate future? Wild day. Though I actually think the bottom of the 4 is in…we’ll see.
So here’s SPX back in the 2820 range but unlike Jan 30, when the VIX was above 15, now the VIX is in the low 13’s. Sounds oddly bullish to me.
NDX price has tagged that head and shoulder neck line. Lions and tigers and bears oh my!
Main hourly updated:
subminuette b upwards?
the problem here of course is a zigzag subdivides 5-3-5, exactly the same as the start of an impulse
so this upwards move could be either an A wave of a zigzag, or a first wave of an impulse
Back in the green on NFLX puts thanks to lowering cost basis defense of original trade. Learned that about conviction trades from the great Bryan Bottarelli! 🙂
Spread on VIX calls starting to widen.
Market makers are expecting a big move….
Selling remaining SPY 282 strike puts for 1.05….
Verne, how are you tuned in to all these killer guys? Did you run a fund? I’ve known Bryan for nearly 10 years, great options trader!!
Been in the trenches with some of the best Chris…for which I am profoundly grateful!
Bryan just came back after taking some time off after the sad passing of his partner and another great, Adam Lass….
SEC paperwork for funds is a killer! 🙂
Yes the paperwork is huge, you should see our docs for both our funds. It’s like a damn real estate closing.
🙂
O.K. Here is a forum quiz.
What recent development puts the pumping scheme of the banksters squarely in the cross-hairs?
is this a trick question?
Not really. I was thinking…”Interest Rates!” 🙂
Gunslinger trade on SPY 282.0 puts expiring tomorrow for 0.55
DO NOT try this at home! he! he!
Opening sell to close order on half of SPY 282 strike puts for limit price of 0.75…
Filled at 0.80 on half SPY 282 puts; holding remaining half for more downside…
Sideways trading action entered after impulsive move down. Break from this range should be down. Lotsa noise but that is my take…..
You may be right. In which case, this 4 wave is extending. There’s certainly LOTS of room to the downside for it to play out without violating any EW rules; the top of the corresponding 1 is way way below. That all said, I’m still suspicious the 4 wave might be behind us now. VIX/XIV seems to be say it is, and price action is looking more and more impulsive to the up side.
Head fake! 😀
More 4 wave churn? Or…new 5 wave launching? We’ll see…
Sure not looking any pullback in TMV any time soon. Some attributing to so called hawkish talk from the FED, which is amusing since there is not a thing they can do to control rising rates, and they will have no choice but to follow the market.
Holding bullish put spread but I think I am going to have to pony up for shares and not plan on share assignment from short puts. Rolling spread to April.
Wide spread on VIX 10.00 strike calls at 2.80/3.50.
Hopefully VIX moves a bit lower for stink bid fill….
My! My! Look at all the giddy little bullocks! He! He! 🙂
XLF has been generally extremely strong and arguable finance does extremely well in the modified tax and regulatory conditions going forward. It’s pulled back with this general market correction, and bounced and “sat on” a major 50% fibo, which provides a very strong and close invalidation/stop. I’m taking a small pile myself right here, I like the risk/reward a lot.
There’s a nice Head and Shoulders pattern very much in play in NDX. This is 20 minute bars. Watch out if that neck line get penetrated to the downside!
Nice Kevin! Good lookin out.
I thought I would share some good news with my friends here. Some of you may remember I have a growth on my larynx that needs to be watched closely. Yesterday I made the long day trip to a major medical school / hospital for a check up. When you live in ‘NoWhere’sville’ you have to travel a long distance to see one of the country’s top ENT, Head & Neck surgeons. In any event, I had a very good checkup and the growth appears to be regressing / healing. I must continue living the healthy life style which isn’t always the most fun way. But, the results are good news that I wanted to share with my friends here on this site.
So today, I am off for an overnight wilderness celebration. It is winter in my neck of the world. There are many, many feet of snow in the mountains that I do not wish to encounter. So instead of the mountains I will be heading to a very remote deep river canyon with whitewater etc. I will be all alone and dozens of miles from any human. Just what I like.
So I won’t be back till late tomorrow. Have a great day trading and otherwise. See you this weekend. Be sure to keep an eye out for that pesky wabbit.
Oh yeah, I like the action on my XIV longs. My long term account is also long 100%.
Thats great news Rodney!!
Enjoy your me time in the Canyon and happy trading!!
Have fun and stay safe, particularly alone in the wilderness! And congrats on the bill of health. Health is everything!!! Maybe even this market will start getting healthy while you’re gone.
ps: your chart call yesterday morning was spot on, keep those coming please!
That is wonderful news, thank you for sharing with us Rodney. Yes, health is everything.
May your solitude in nature restore you.
Open wide and say…AaaaH! Doc!
I’m never very comfortable with bottoms in corrections that don’t land right at a fibonacci retracement. This one hasn’t, and to me, adds evidence to the “more down” proposition. Lots of fine turning points available below!! The blues are the 38% and 62% once, the gold is a major 50%, the red is a 76.4% one. We’ll see if this current bottom holds.
On the contrary, a move lower in VIX along with the market would suugest a c wave
underway…very bullish!
ES looks to have finished a fourth wave correction.
The very worse thing that could now happen for bullish traders is for VIX to chase any market move higher…
Opening in long term account big bull put spread on TZA on sell signal from Russell.
Selling 9.0/10.0 credit spread at offer.
Opening stink bid on March VIX 10.00 strike calls for 3.00 even.
I think the TWS signal from a few weeks back still in play as we have had nothing remotely resembling capitulation…but we willl sooner or later…better to be pte- positioned.
Lowered cost basis on NFLX short. Still underwater…so far…the stock is worth less thsn zero…
Increasing GE short…
While volatility is clearly not being sold as aggressively as previous VIX visits above its B bands, neither is it being bought. The complacency of the herd remains absolutely stunning, even in the face of the VIX move off its recent lows. There is NO FEAR in this market. I find that a wee bit scary! 🙂
Looking for entry on TMV today…
I will be very careful opening a new short position as expecting snap back to be fast and furious…Waiting patiently now..
Certainly that!! Though maybe not over yet
I think perhaps the target of 2859 on the daily main (and the alternate hourly) is a typo? It’s below the ATH already established (2873-ish)
sorry, no, not a typo
I should have removed it now its reached and the structure is incomplete
Number uno again!!!
FB looking good after hours..