
Last analysis noted that bearish divergence between price and the AD line indicated a correction was not over. Sideways movement was expected, but price has moved lower.
Summary: A correction looks to be incomplete, so it may continue for a few more days. Targets for it to end are 2,796 or 2,749, with the higher target preferred.
The larger trend remains upwards and corrections still offer an opportunity to join the trend.
Always practice good risk management. Always trade with stops and invest only 1-5% of equity on any one trade.
The biggest picture, Grand Super Cycle analysis, is here.
Last historic analysis with monthly charts is here. Video is here.
An historic example of a cycle degree fifth wave is given at the end of the analysis here.
MAIN ELLIOTT WAVE COUNT
WEEKLY CHART
Click chart to enlarge.
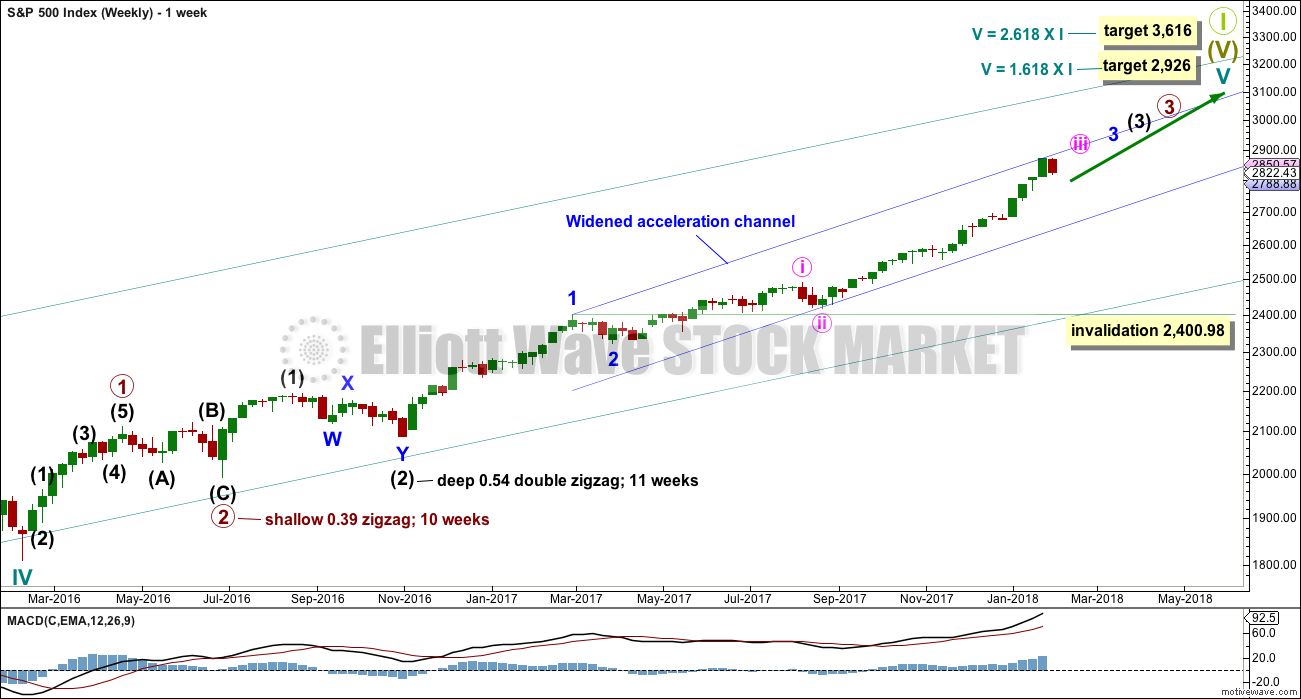
Cycle wave V must complete as a five structure, which should look clear at the weekly chart level. It may only be an impulse or ending diagonal. At this stage, it is clear it is an impulse.
Within cycle wave V, the third waves at all degrees may only subdivide as impulses.
Within cycle wave V, the corrections for primary wave 2 and intermediate wave (2) both show up clearly, both lasting several weeks. The respective corrections for intermediate wave (4) and primary wave 4 should also last several weeks, so that they show up at weekly and monthly time frames. The right proportions between second and fourth wave corrections give a wave count the right look. This wave count expects to see two large multi week corrections coming up.
Cycle wave V has passed equality in length with cycle wave I, which would be the most common Fibonacci ratio for it to have exhibited. The next most common Fibonacci ratio would be 1.618 the length of cycle wave I. This target at 2,926 now looks too low. The next most common Fibonacci ratio would be 2.618 the length of cycle wave I at 3,616. This higher target is looking more likely at this stage.
Intermediate wave (3) has passed all of equality in length with intermediate wave (1), and 1.618 and 2.618 the length of intermediate wave (1). It is possible that intermediate wave (3) may not exhibit a Fibonacci ratio to intermediate wave (1). The target calculation for intermediate wave (3) to end may have to be done at minor degree; when minor waves 3 and 4 are complete, then a target may be calculated for intermediate wave (3) to end. That cannot be done yet.
When minor wave 3 is complete, then the following multi week correction for minor wave 4 may not move into minor wave 1 price territory below 2,400.98. Minor wave 4 should last about four weeks to be in proportion to minor wave 2. It may last about a Fibonacci three, five or even eight weeks if it is a time consuming sideways correction like a triangle or combination. An Elliott channel may be drawn about the impulse of intermediate wave (3) when minor wave 3 is complete, and minor wave 4 may end about the lower edge of that channel.
At this stage, a widened acceleration channel is drawn now in blue about the impulse of intermediate wave (3). This is drawn in the same way as an Elliott channel using Elliott’s first technique.
A third wave up at four degrees may be completing. This should be expected to show some internal strength and extreme indicators, which is exactly what is happening. Members are advised to review the prior example given of a cycle degree fifth wave here. The purpose of publishing this example is to illustrate how indicators may remain extreme and overbought for long periods of time when this market has a strong bullish trend. If the current wave count is correct, then the equivalent point to this historic example would be towards the end of the section delineated by the dates November 1994 to May 1996. In other words, the upwards trend for this fifth wave may only have recently passed half way and there may be a very long way up to go yet.
DAILY CHART
Click chart to enlarge.
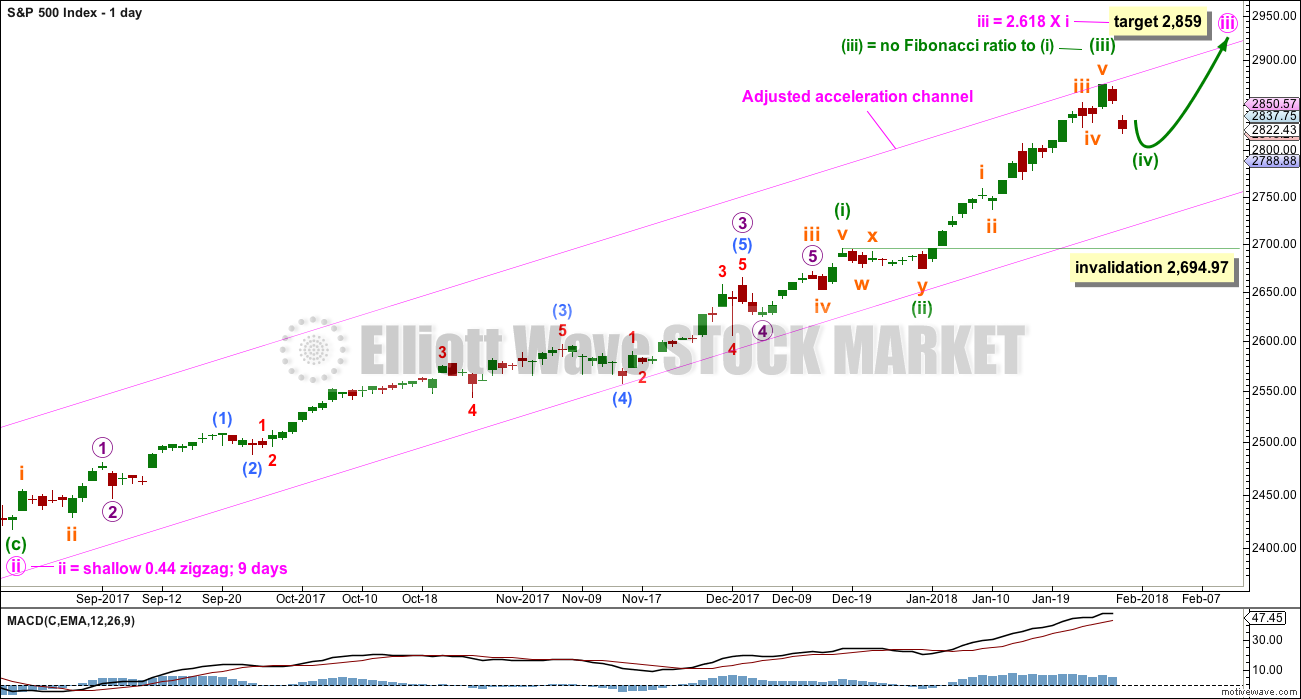
Keep redrawing the acceleration channel as price continues higher: draw the first line from the end of minute wave i to the last high, then place a parallel copy lower down to contain all this upwards movement. When minute wave iii is complete, this would be an adjusted Elliott channel and the lower edge may provide support for minute wave iv.
Minuette wave (ii) subdivides as a combination and lasted only eight sessions, about only one and a half weeks. Minuette wave (iv) may be a zigzag, which tend to be quicker structures than combinations; a Fibonacci five days will be the first expectation, but it may be over within less than one week. Today, it looks like minuette wave (iv) may have arrived earlier than expected.
Minuette wave (i) was a long extension. Minuette wave (iii) may have ended at the last high and if so would be shorter than minuette wave (i). This limits minuette wave (v) to no longer than equality in length with minuette wave (iii) so that minuette wave (iii) is not the shortest actionary wave.
Minuette wave (iv) may not move into minuette wave (i) price territory below 2,694.97.
Minute wave iii has passed equality in length with minute wave i, and has passed 1.618 the length of minute wave i. The next Fibonacci ratio in the sequence is used to calculate a target. This would still allow minuette wave (v) within it to be shorter than minuette wave (iii), so all Elliott wave rules could be met.
HOURLY CHART
Click chart to enlarge.
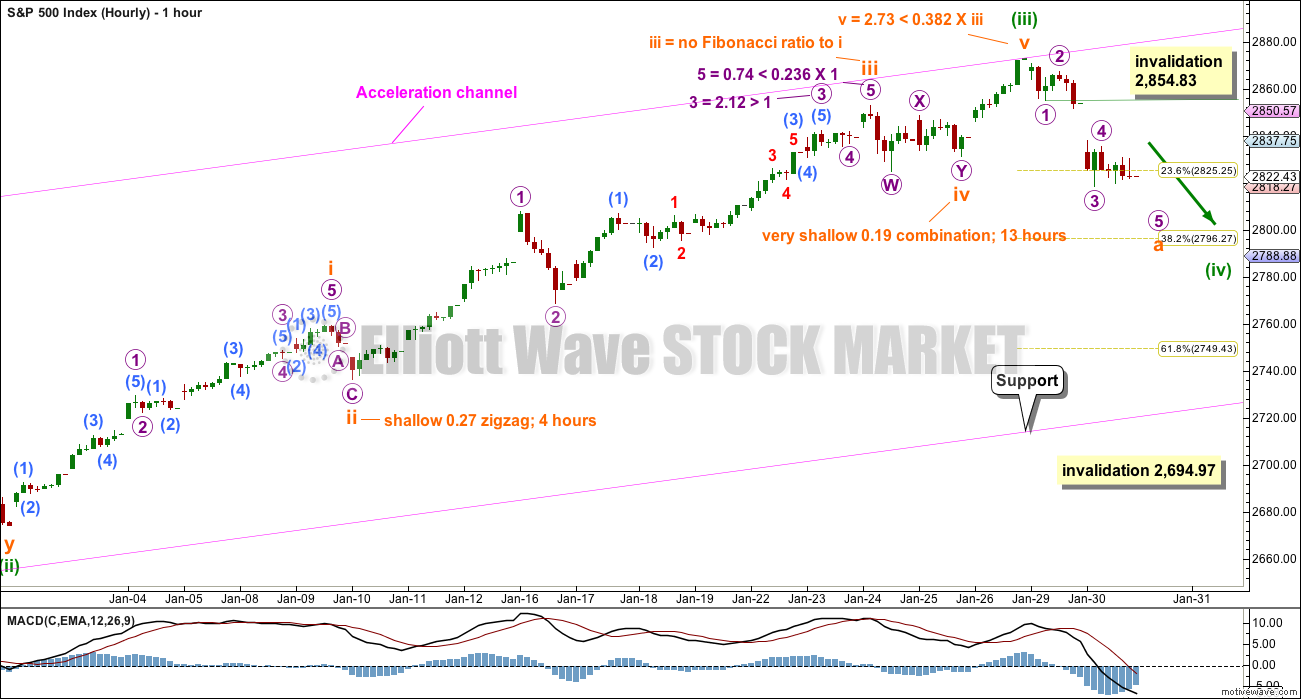
At this stage, it looks like a five down may be completing. With the larger trend still assumed to be upwards, if a five down unfolds, then that may not be a complete correction. Corrections subdivide as threes, not fives.
A five down may be only subminuette wave a within a zigzag for minuette wave (iv).
Within the first five down, micro wave 4 may not move into micro wave 1 price territory above 2,854.83. A new high above 2,854.83 prior to any new low below 2,818.27 would invalidate this main hourly wave count in favour of the alternate below.
Micro wave 5 would be very likely to make at least a slight new low below the end of micro wave 3 at 2,818.27 to avoid a truncation. As soon as price makes a new low below 2,818.27, then a five down may be complete at any stage. At that point, the invalidation point must move higher to the last all time high at 2,872.87. Subminuette wave a may be complete and subminuette wave b may not move beyond its start.
Minuette wave (ii) lasted eight days and was a complicated multiple (these tend to be more time consuming structures). So far minuette wave (iv) may have lasted only two days. It may continue for another three at least to total a Fibonacci five.
ALTERNATE HOURLY CHART
Click chart to enlarge.
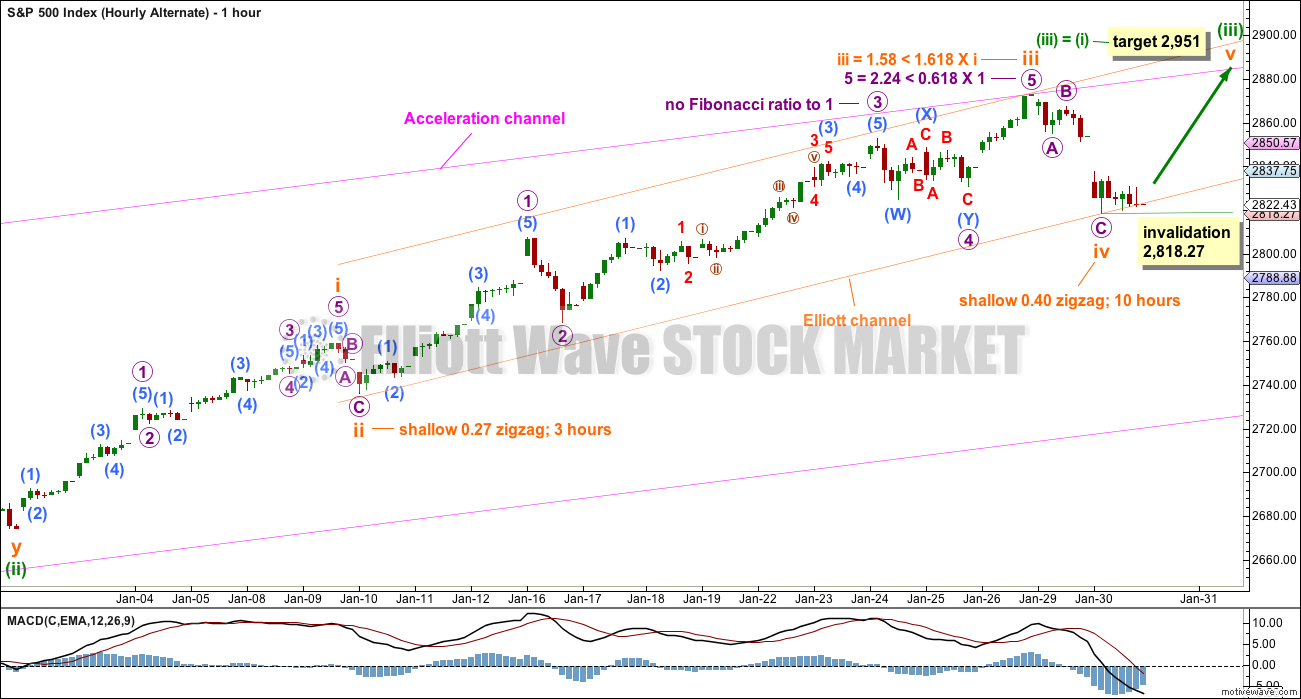
It is also possible that only a zigzag downwards may be complete. This alternate will remain viable while price remains above 2,818.27. A new high above 2,854.83 would add confidence to it. At that point, the correction may have been over and may have been again very brief and shallow.
TECHNICAL ANALYSIS
WEEKLY CHART
Click chart to enlarge. Chart courtesy of StockCharts.com.
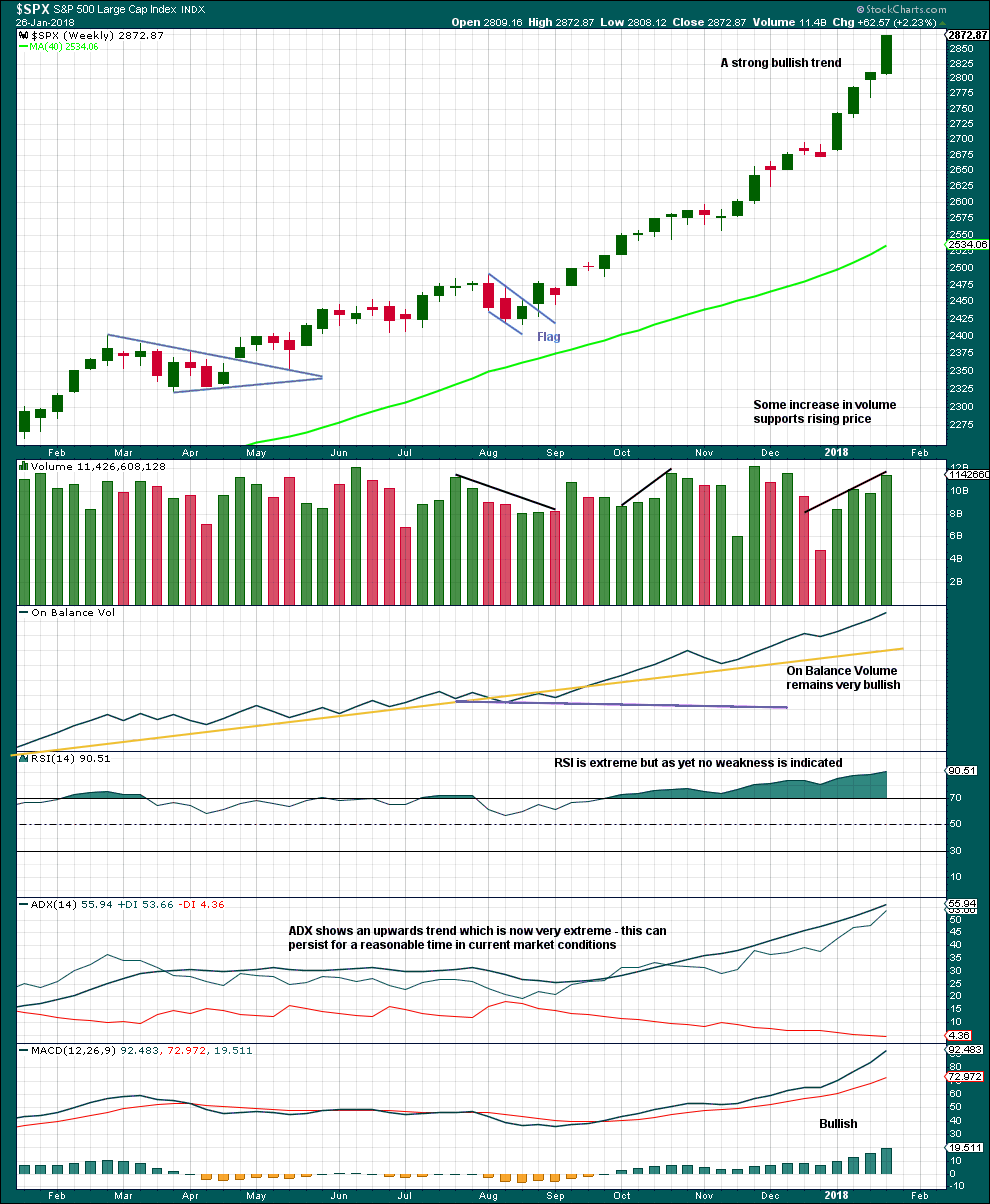
This upwards trend is extreme and stretched, but there is still no evidence of weakness at the weekly time frame.
There is no divergence to indicate any weakness yet between price and RSI.
As a third wave at multiple degrees comes to an end, it would be reasonable to see indicators at extreme levels.
A correction will come, but it looks like it may not be here yet.
DAILY CHART
Click chart to enlarge. Chart courtesy of StockCharts.com.
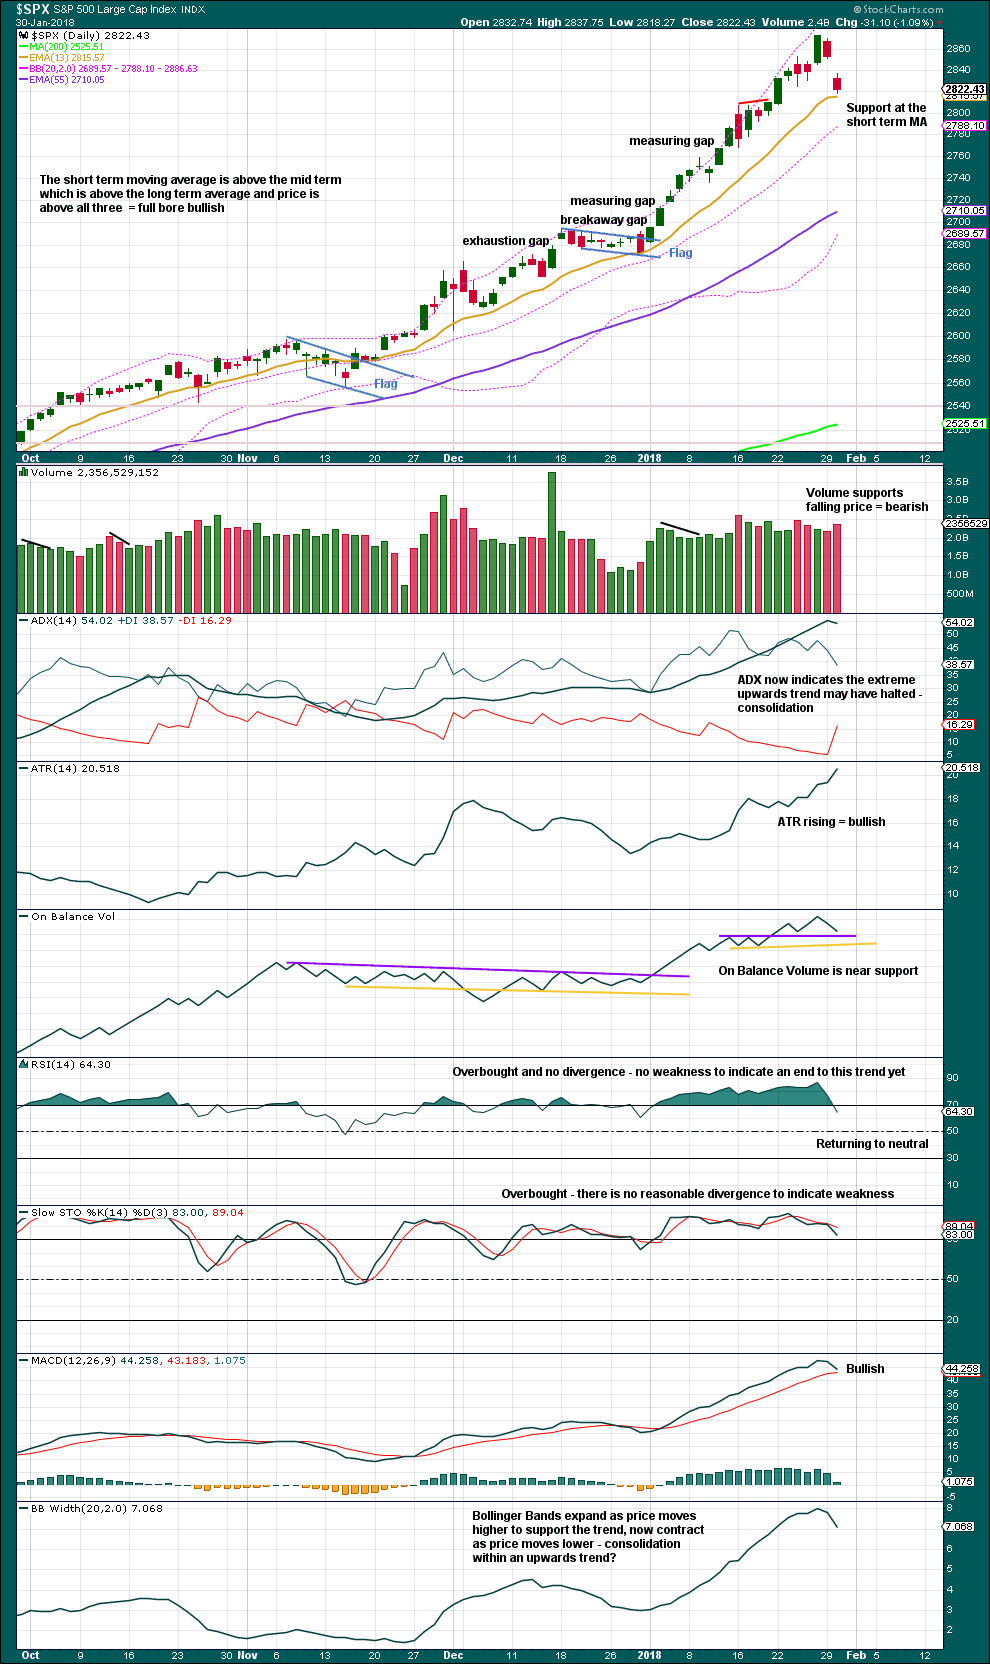
Volume, Bollinger Bands and ADX today all support the main hourly wave count.
VOLATILITY – INVERTED VIX CHART
Click chart to enlarge. Chart courtesy of StockCharts.com.
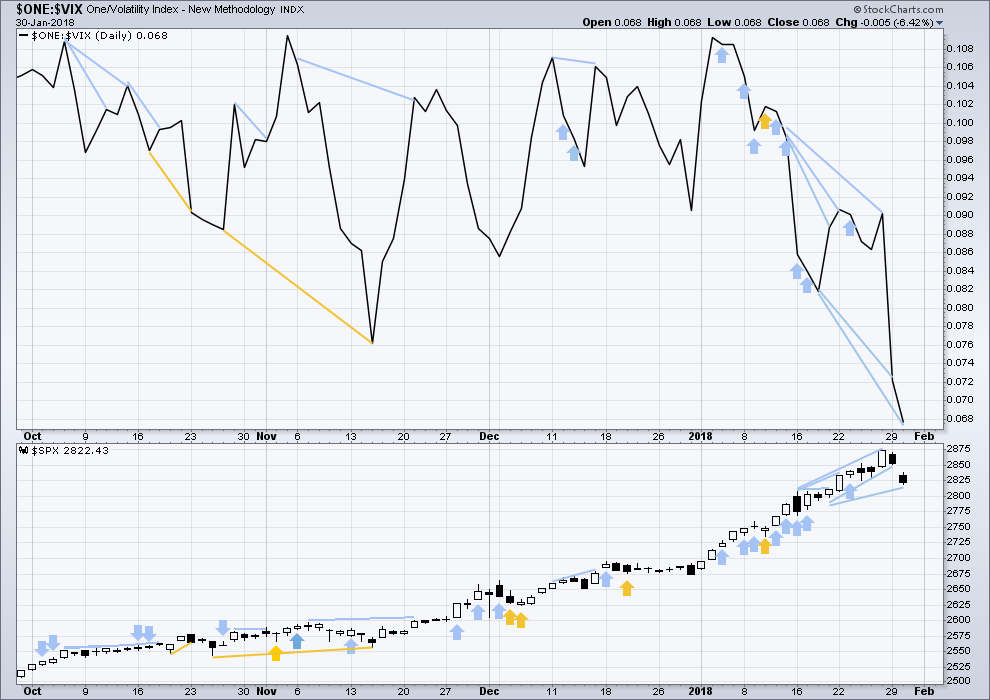
So that colour blind members are included, bearish signals will be noted with blue and bullish signals with yellow.
Normally, volatility should decline as price moves higher and increase as price moves lower. This means that normally inverted VIX should move in the same direction as price.
Divergence with VIX and price will at this stage be read as a leading indicator, in the same way as the AD line is interpreted.
Price is moving lower and volatility is strongly increasing. Volatility is now stronger than the last recent swing low for inverted VIX. This is interpreted as a bearish signal today.
BREADTH – AD LINE
Click chart to enlarge. Chart courtesy of StockCharts.com.
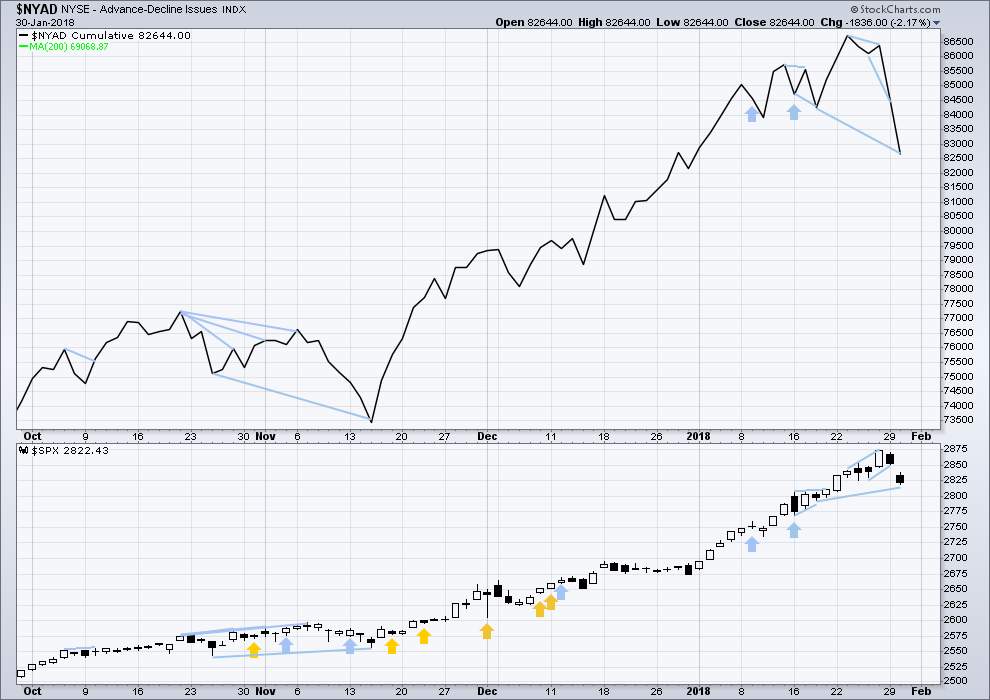
There is normally 4-6 months divergence between price and market breadth prior to a full fledged bear market. This has been so for all major bear markets within the last 90 odd years. With no longer term divergence yet at this point, any decline in price should be expected to be a pullback within an ongoing bull market and not necessarily the start of a bear market.
All of small, mid and large caps last week made new all time highs. This market has good support from rising breadth.
Breadth should be read as a leading indicator.
Breadth today has made a new swing low below the 18th of January. This is a bearish signal. This supports the main hourly Elliott wave count.
DOW THEORY
The S&P500, DJIA and Nasdaq last week made new all time highs. Only DJT did not make a new all time high and has moved lower. This divergence is slightly bearish; DJT may be leading by beginning a correction first.
The following lows need to be exceeded for Dow Theory to confirm the end of the bull market and a change to a bear market:
DJIA: 17,883.56.
DJT: 7,029.41.
S&P500: 2,083.79.
Nasdaq: 5,034.41.
Charts showing each prior major swing low used for Dow Theory are here.
Published @ 07:30 p.m. EST.
Lara,
Just a thought… perhaps unlikely because of the proportions, but is it possible that we may have a W-X-Y for (iv) complete at today’s low?
A 3-3-3 or the (iv)? That was a possibility that crossed through my mind as well. Would be interesting to hear Lara’s take on it. This market has surprised us to the upside more often than not.
The main hourly is the one this morning. Now for subminuette b upwards / sideways
If my analysis of that five down is correct then subminuette b may not move beyond its start.
A few more days of sideways chop now, another leisurely opportunity to join the trend.
Yep! Very sneaky finish to that fifth huh? 🙂
VIX suggesting downside not quite done yet.
ROTFL!
I just went to check out Tim Knight’s market summary and he comes on screen wearing a wig like Janet Yellen!
What a hoot!!!!
I don’t believe it. SPY 282 calls now bid at 0.39!! SOLD!! 🙂
Can you believe the stunts these market makers pull???!!!!
Thanks for the reply yesterday Verne
Most welcome Peter. If you ever want more info on the trade e-mail me and I will shoot you details. Essentially, those guys expect a lot more volatility in the futures market and think that is where you are going to make the most explosive gains. They were right! 🙂
Great Verne. Do we swap email addresses here or leave it to Lara?
Sold 282 SPY puts from straddle for 0.45.
282 calls will expire worthless so took a roughly 50% haircut on that one… 🙂
VIX and VIX futures retreating after our the post-fed action. We didn’t really tag the downside target for the hourly alternate but the length looks reasonable. The close here will be especially important for interpreting a signal from on-balance-volume. I maintain that OBV has been one of the best indicators for charting upward movements. A positive day would indicate support at Lara’s line.
The fact that this move came post-Fed makes me suspicious. There is nothing the market learned today that it didn’t already know. I would anticipate a reversion to where we were before the meeting. These types of algo shenanigans don’t usually amount to much unless there is actual news. We shall see.
This really too funny!
Doing everything in their power to keep traders from piling on into the close.
It could get ugly over-night, lol!
Was there dovish blather from the FED today? TMV moving down and it makes me wonder. Here’s hoping we tag the 200 day MA the next day or two with a subsequent bounce. If it does….I’m in!!
If vol is returning to any semblance of normalcy, something I have not seen for a few years now, another impulse down for a possible fifth wave should give a slightly lower VIX high as the wave completes….
Rolling to DIA 260 strikes for a buck apiece…
Whoa! Puts sold at 1.50 with a 1.44/1.51 spread!
Yikes! Somebody’s getting a bit nervous it would seem…
Well we got a 5-down on the hourly it seems like. Is that the A of a longer term A-B-C correction? Is this a multi-week hangup we’ve got going on now?
Starting to look that way…
Agreed. At least several days, a week and a half to two?
DIA 261 puts bid at 1.30 and moving higher….
Underwater on small straddle, but a big downside move before the close could change that in one big hurry…! 🙂
DIA 261 puts bid at 1.05
Opening STC order for limit of 1.50 good for the day.
We had a corrective bounce and the trade now is “sell the rips”….
Despite the rise in VIX, there is still tremendous complacency in this market.
What, exactly, is it going to take to get the herd to recognize the downside potential I wonder? 🙂
Looks to me like a larger triangle of some sort still in play. If so, the breakout will be to the downside as I originally speculated….adding to Diamond puts, holding straddle….
I think the meandering today is owing to expiration of weekly options and the market makers don’t want a big move either way. I suspect this is going to continue into the close and then we see a big move when they think everyone has given up. I think I am going to trade an option straddle on SPY at 282 just for fun… 😀
282 call is 87 and 282 put is 31 ask price.
Entered for 1.08 per straddle so let’s see what transpires before the close. Looks like market makers expecting upward movement…
I wonder if this is one big bear flag forming in SPX? If so, it’s going to get very ugly soon!! I doubt it but…paranoia can be healthy!!
We are either going to get a C wave down to complete an a,b,c, or we are setting up for a sweet third wave decline. I am starting to think we have a cat and mouse game that is once again going to really get going in the futures market. If the meandering continues into the close, I will be loading another double vertical via ES……
This is looking a bit like a 3 down, 3 up, and now a 5 down overall 4 wave down. Chart…
The 5 wave down completed, and now it’s off to the upside races???
Selling VIX 15 strike puts for 2.50.
Opening bull put credit spread on UVXY. Feb 9 expiration 8.50/9.50 puts for credit of 0.15, with intention to be assigned UVXY shares at 9.50 if price below at expiration. Cost basis 9.35 if assigned.
Buying DIA 261 puts expiring Fri for 0.75
I like it. Re-entered UVXY at 11.25, and bought March 14 Calls VIX, held Aprils yesterday.
Does this work for the move up so far this morning? SPX 5 minute chart.
Acknowledging we don’t trade on hope…I hope not. I’d prefer the alternate hourly to take price up and away. But it is increasingly looking more dim for the long team here, and your 5 wave down model might end up being spot on.
I am just trying to find what the risk to the downside might be as of now. Being the devil’s advocate so to speak. My hopes are yours as well since I completed my partial long XIV to a fully long XIV this morning around 127 to give me a net average of 125.03.
Looking for VIX daily and $NYMO to close within daily BBs. That would give me an SPX buy signal.
Gotta go now. I have a lot of miles to drive today.
Makes sense. I was seeing a larger triangle and expected a downside break but I think you got it right dude…. 🙂
At any rate, we both agree – “more cowbell!!”…er… I mean downside! 😉
“I’ve got a fever…!”
Here’s my more bullish model (basically the hourly alternate).
This one is arguably more in line with the recurring market behavior we’ve experience for the last year. I like Lara’s suggestion: keep taking the long play, it’ll work every time except the last! It’s an interesting perspective.
TMV moving back to test 200 day. Preparing a full spread of photon torpedoes… 🙂
Triangles are what I like to call “Bread and Butter” trades. They are generally very predictable and I just LOVE ’em!
We are in one now I think. To trade them successfully, you have to get the direction of the break right…
While it’s trendy to be bearish (that’s a pun I guess) I’ll note that time after time in these kinds of set ups we’ve had strong bull move surprises in the last year. And the market is setting up so far this evening for a significant gap up open. Back to the bull races under the alternate hourly? We’ll see.
Pre-market looks to start on a positive note. I have been watching how the same news gets recycled to manipulate the stocks. For example, since last two weeks same news about Apple iPhone X has been circulating and weaker hands are selling into the strong with each sell off. Worst part is the fact that each year around this time FUD will spread and people will panic to it by dumping the stock. Earnings for FAANG start today and should be the indicator of things to come. Earnings good from FAANG could mean recent shorts will get squeezed hard.
Anyone home?
lol you win first today apparently
Am I turd Doc?!