
Last analysis warned that divergence between price and the AD line was bearish, thus a correction may come sooner than expected. Downwards movement to start the new trading week fits this description.
Summary: Another small correction looks to have arrived. It may be over at today’s low, or it may continue sideways for another couple of days or so. Bearish divergence again between price and the AD line supports the view that the correction which began today is not over. This supports the alternate hourly Elliott wave count.
The next target is at 2,951. The long term preferred target is at 3,616.
This looks like a third wave that is still incomplete. It may have just passed the middle strongest portion, so look for volatility to increase as a series of fourth waves unfold.
Always practice good risk management. Always trade with stops and invest only 1-5% of equity on any one trade.
The biggest picture, Grand Super Cycle analysis, is here.
Last historic analysis with monthly charts is here. Video is here.
An historic example of a cycle degree fifth wave is given at the end of the analysis here.
MAIN ELLIOTT WAVE COUNT
WEEKLY CHART
Click chart to enlarge.
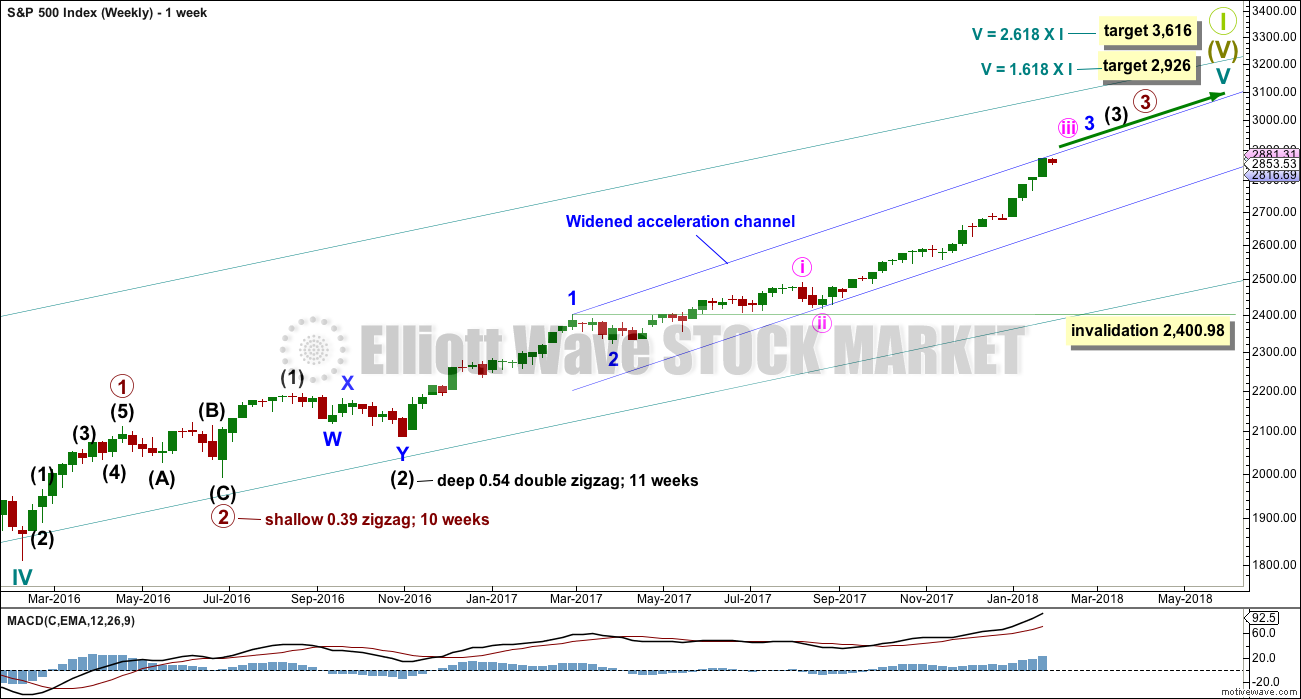
Cycle wave V must complete as a five structure, which should look clear at the weekly chart level. It may only be an impulse or ending diagonal. At this stage, it is clear it is an impulse.
Within cycle wave V, the third waves at all degrees may only subdivide as impulses.
Within cycle wave V, the corrections for primary wave 2 and intermediate wave (2) both show up clearly, both lasting several weeks. The respective corrections for intermediate wave (4) and primary wave 4 should also last several weeks, so that they show up at weekly and monthly time frames. The right proportions between second and fourth wave corrections give a wave count the right look. This wave count expects to see two large multi week corrections coming up.
Cycle wave V has passed equality in length with cycle wave I, which would be the most common Fibonacci ratio for it to have exhibited. The next most common Fibonacci ratio would be 1.618 the length of cycle wave I. This target at 2,926 now looks too low. The next most common Fibonacci ratio would be 2.618 the length of cycle wave I at 3,616. This higher target is looking more likely at this stage.
Intermediate wave (3) has passed all of equality in length with intermediate wave (1), and 1.618 and 2.618 the length of intermediate wave (1). It is possible that intermediate wave (3) may not exhibit a Fibonacci ratio to intermediate wave (1). The target calculation for intermediate wave (3) to end may have to be done at minor degree; when minor waves 3 and 4 are complete, then a target may be calculated for intermediate wave (3) to end. That cannot be done yet.
When minor wave 3 is complete, then the following multi week correction for minor wave 4 may not move into minor wave 1 price territory below 2,400.98. Minor wave 4 should last about four weeks to be in proportion to minor wave 2. It may last about a Fibonacci three, five or even eight weeks if it is a time consuming sideways correction like a triangle or combination. An Elliott channel may be drawn about the impulse of intermediate wave (3) when minor wave 3 is complete, and minor wave 4 may end about the lower edge of that channel.
At this stage, a widened acceleration channel is drawn now in blue about the impulse of intermediate wave (3). This is drawn in the same way as an Elliott channel using Elliott’s first technique.
A third wave up at four degrees may be completing. This should be expected to show some internal strength and extreme indicators, which is exactly what is happening. Members are advised to review the prior example given of a cycle degree fifth wave here. The purpose of publishing this example is to illustrate how indicators may remain extreme and overbought for long periods of time when this market has a strong bullish trend. If the current wave count is correct, then the equivalent point to this historic example would be towards the end of the section delineated by the dates November 1994 to May 1996. In other words, the upwards trend for this fifth wave may only have recently passed half way and there may be a very long way up to go yet.
DAILY CHART
Click chart to enlarge.
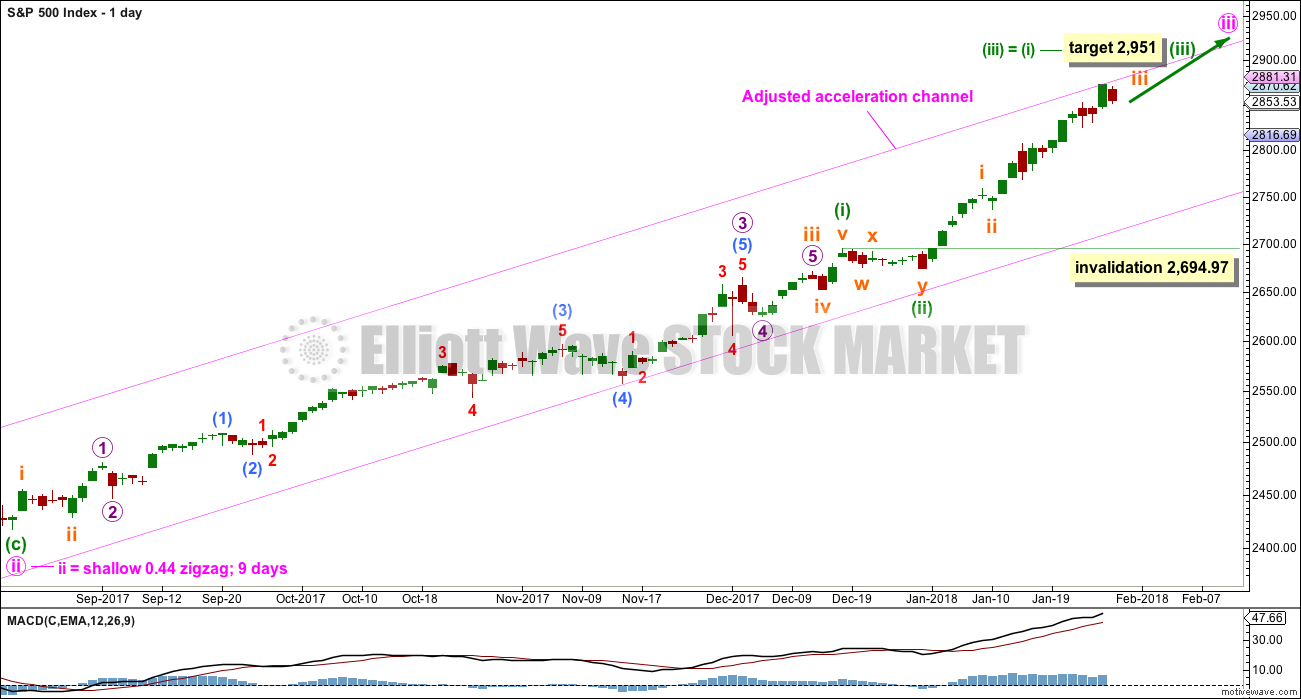
Keep redrawing the acceleration channel as price continues higher: draw the first line from the end of minute wave i to the last high, then place a parallel copy lower down to contain all this upwards movement. When minute wave iii is complete, this would be an adjusted Elliott channel and the lower edge may provide support for minute wave iv.
The focus for the short term will be on identifying the next multi week interruption to the upwards trend.
A target for minuette wave (iii) fits only with the second higher target on the weekly chart.
Minuette wave (ii) subdivides as a combination and lasted only eight sessions, about only one and a half weeks. Minuette wave (iv) may be a zigzag, which tend to be quicker structures than combinations; a Fibonacci five days will be the first expectation, but it may be over within less than one week.
Because minuette wave (i) was a long extension, minuette wave (iii) may be shorter or only about equal in length. If minuette wave (iii) is about equal in length with minuette wave (i), then they would both be long extensions. Only two actionary waves within an impulse may be extended. If both minuette waves (i) and (iii) are extended, then minuette wave (v) may not extend.
Minuette wave (iv), when it arrives, may not move into minuette wave (i) price territory below 2,694.97.
HOURLY CHART
Click chart to enlarge.
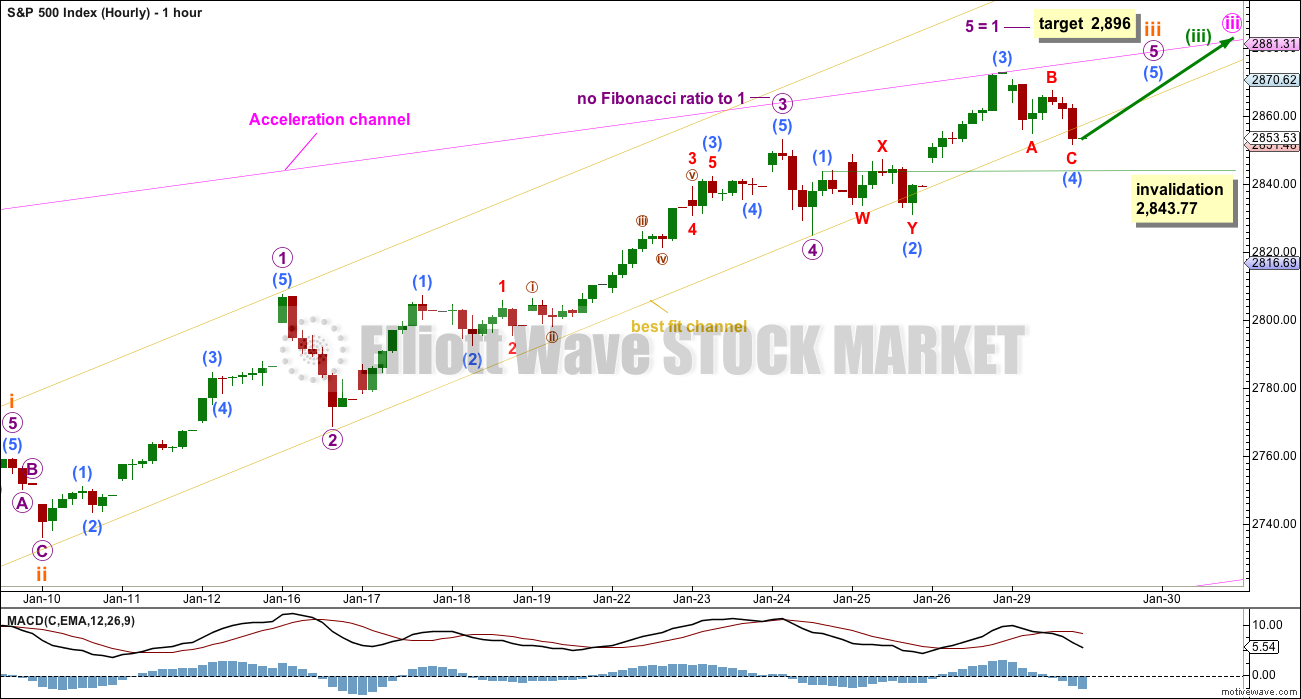
Always assume that the trend remains the same until proven otherwise. At this stage, there is no technical evidence for a trend change; we should assume the trend remains upwards.
Subminuette wave iii is extending. Subminuette wave iii passed equality in length with subminuette wave i at 2,821.59. The next Fibonacci ratio in the sequence to calculate a target would be 1.618 the length of subminuette wave i at 2,874, but price is now very close to this point and the structure of micro wave 5 is incomplete.
A new target for subminuette wave iii to end is calculated at micro degree. Micro wave 3 is a little longer than micro wave 1, so micro wave 5 is not limited; the core Elliott wave rule stating micro wave 3 may not be the shortest actionary wave is met. Because micro wave 3 does not exhibit a Fibonacci ratio to micro wave 1, it would be more likely that micro wave 5 may exhibit a Fibonacci ratio to either of micro waves 1 or 3, and equality in length with micro wave 1 is the most common Fibonacci ratio.
Micro wave 5 must complete as a five wave structure. It is unfolding as the more common impulse. Within the impulse, submicro wave (4) may not move into submicro wave (1) price territory below 2,843.77.
Submicro wave (4) may be over as a zigzag, exhibiting alternation with the combination of submicro wave (2). However, there is not enough upwards movement at the end of Monday’s session to indicate submicro wave (4) is over. It may continue a little lower when markets open tomorrow.
A new low below 2,843.77 would see this main hourly wave count invalidated and the alternate hourly wave count below should then be used.
Weak volume for Monday’s downwards movement supports this main hourly wave count today.
ALTERNATE HOURLY CHART
Click chart to enlarge.
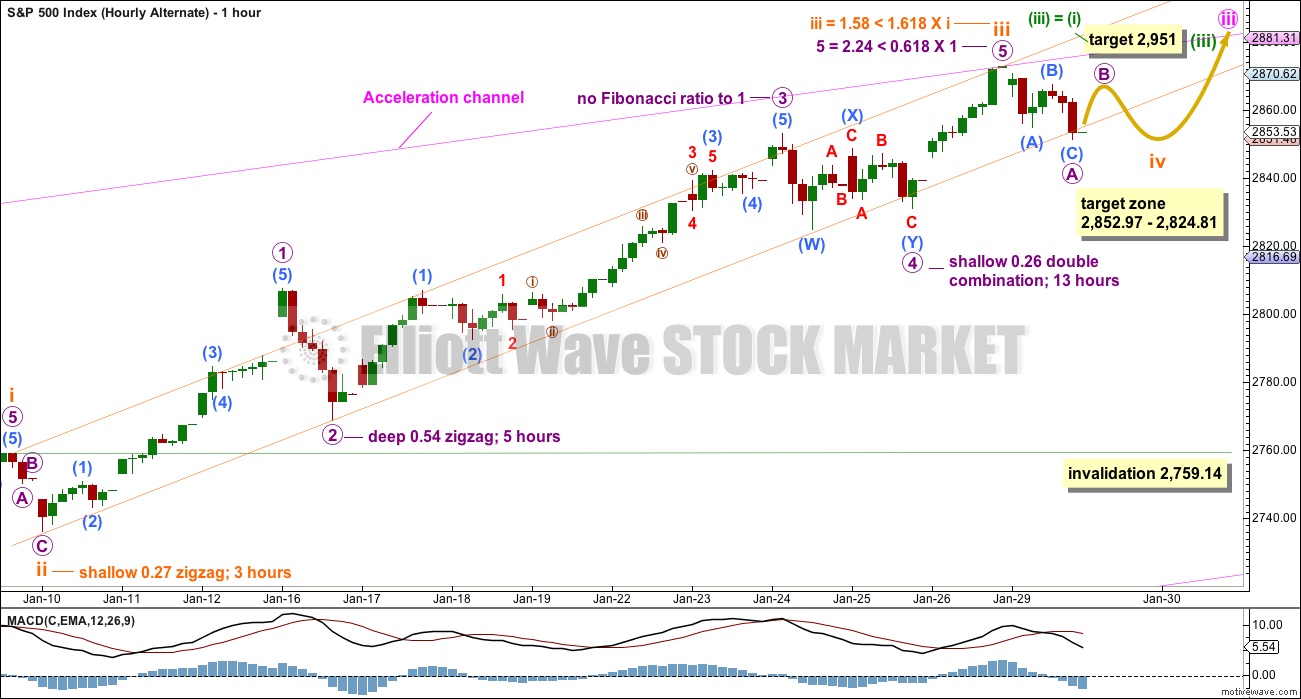
If micro wave 4 is seen as a double combination rather than a zigzag, then it may have ended later at the last small swing low.
This is an alternate wave count for two reasons:
1. Assume the trend remains the same until proven otherwise.
2. On the five minute chart, the structure of submicro waves (X) and (Y) is not as good as how this movement is seen on the main hourly chart.
However, if price makes a new low below 2,843.77 confidence may be had in this alternate wave count.
This wave count expects only a shallow brief interruption to the upwards trend though. Subminuette wave iv may end within the price territory of the fourth wave of one lesser degree.
Subminuette wave ii was very brief. Subminuette wave iv may be longer lasting if it is a more complicated time consuming combination, triangle or flat correction. All of these structures begin with micro wave A subdividing as a three, which may be a complete zigzag. Subminuette wave iv would be expected to be only a couple of days or so at the most. It may not move into subminuette wave i price territory below 2,759.14.
Subminuette wave iv may continue further sideways and may breach the orange Elliott channel. Fourth waves are not always contained within Elliott channels, and the S&P does have a tendency to breach bull channels by sideways movement, only to then continue on upwards. If subminuette wave iv does breach the channel, then the channel should be redrawn using Elliott’s second technique.
There is bearish divergence again between price and the AD line, which supports this wave count.
TECHNICAL ANALYSIS
WEEKLY CHART
Click chart to enlarge. Chart courtesy of StockCharts.com.
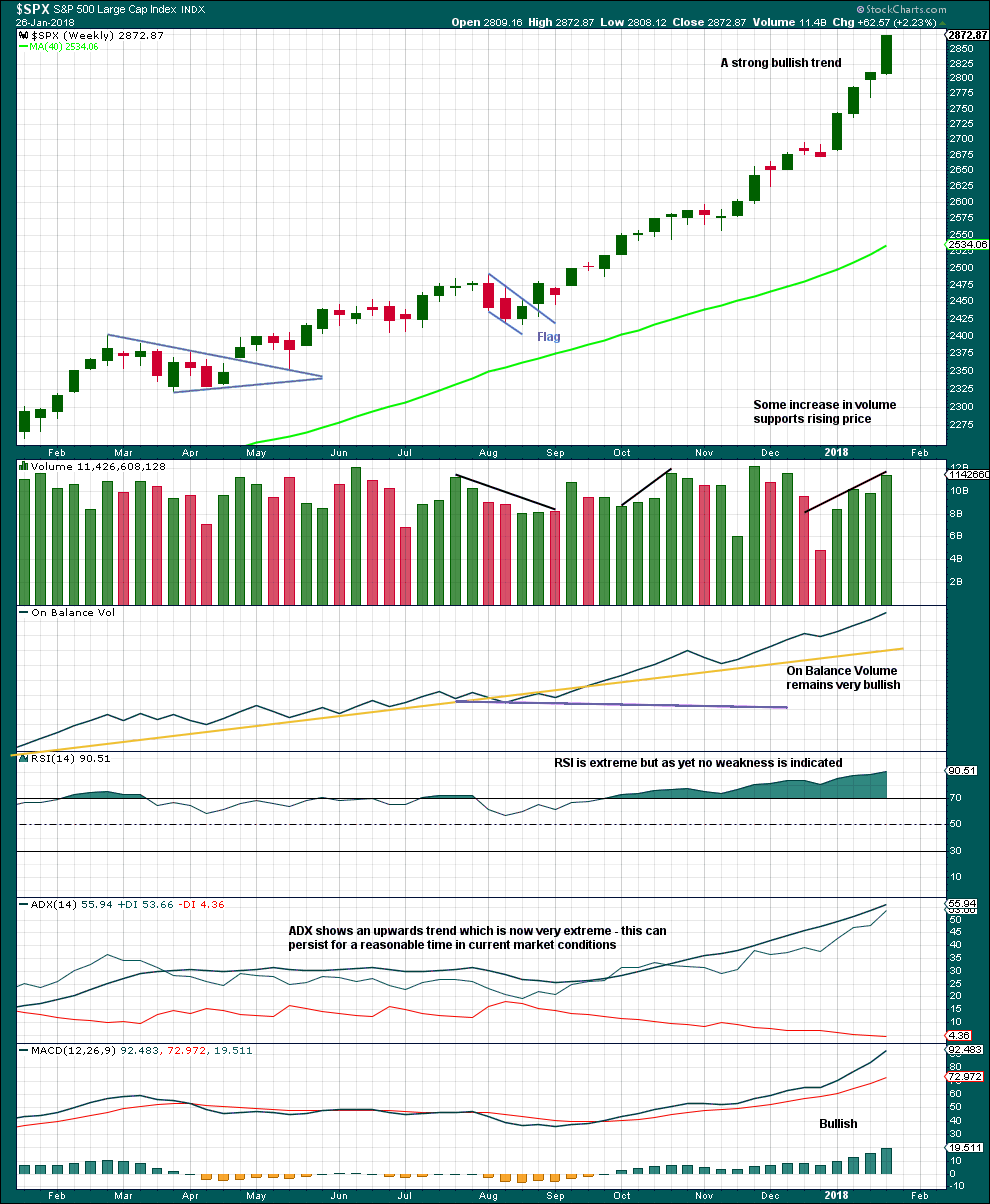
This upwards trend is extreme and stretched, but there is still no evidence of weakness at the weekly time frame.
There is no divergence to indicate any weakness yet between price and RSI.
As a third wave at multiple degrees comes to an end, it would be reasonable to see indicators at extreme levels.
A correction will come, but it looks like it may not be here yet.
DAILY CHART
Click chart to enlarge. Chart courtesy of StockCharts.com.
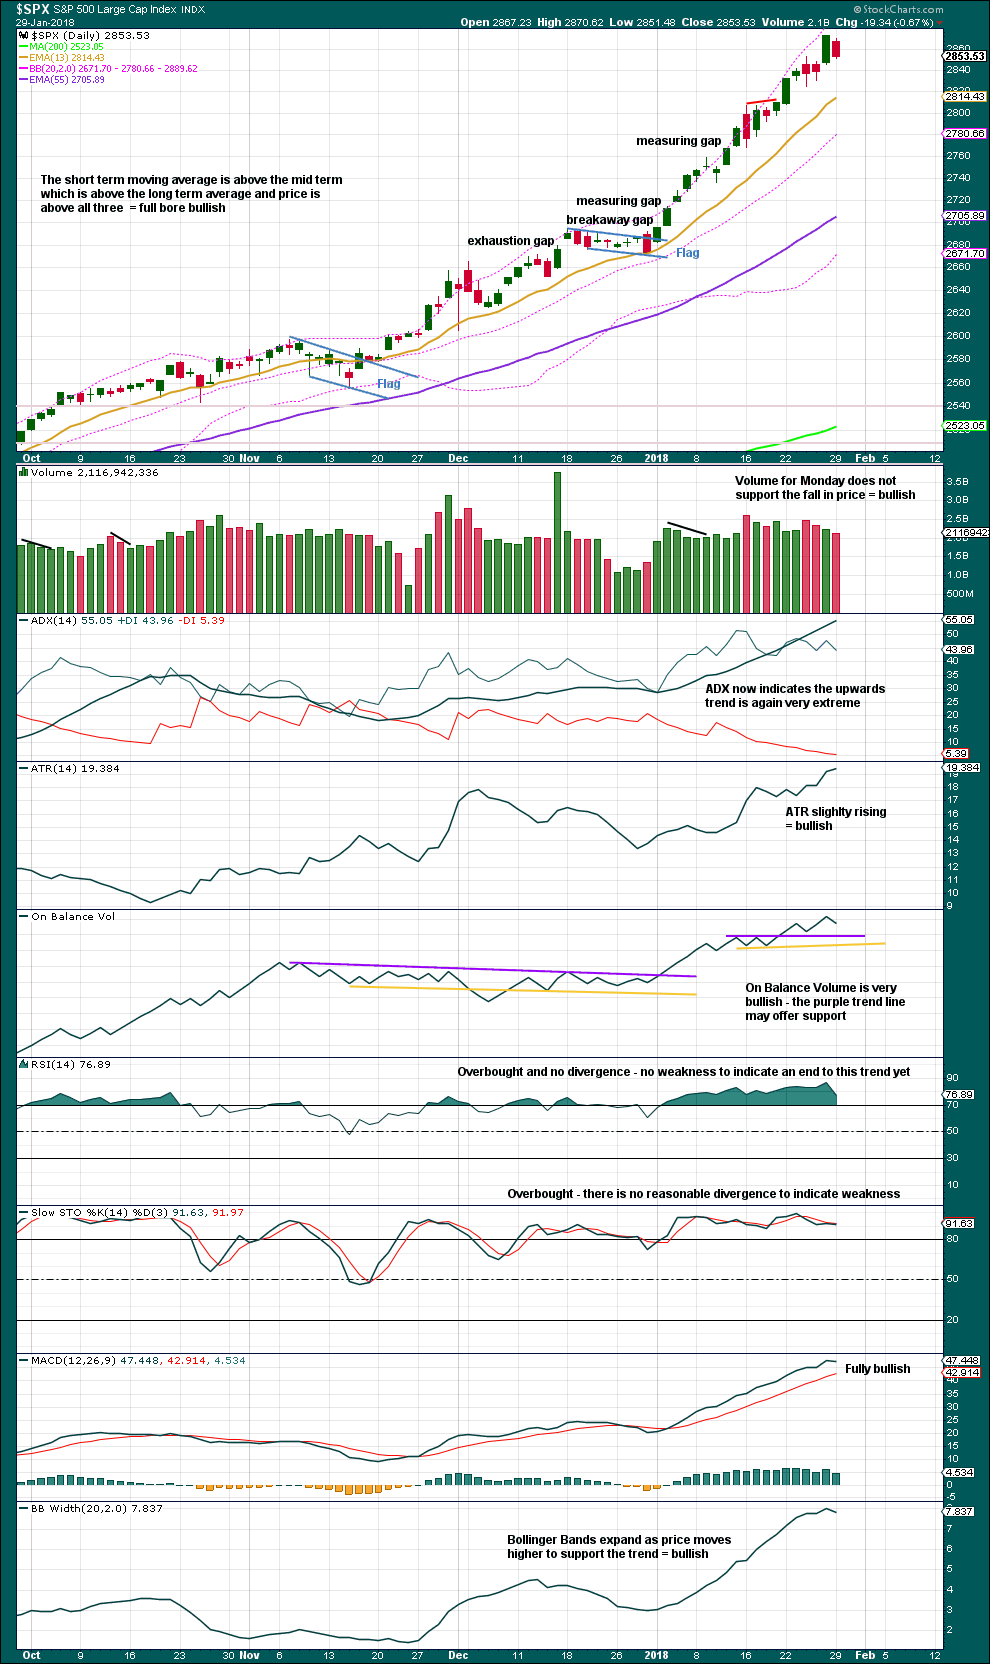
There is still no reasonable divergence to indicate weakness. This trend is extreme and overbought, but that can remain for long periods of time when this market has a strong bullish trend.
Monday’s session does not complete a Harami candlestick pattern. The real body for Monday is too large, and the real body for Friday is not long enough. A Harami pattern is an unusually long first candlestick, followed by a spinning top candlestick with the real body inside the first candlestick real body.
VOLATILITY – INVERTED VIX CHART
Click chart to enlarge. Chart courtesy of StockCharts.com.
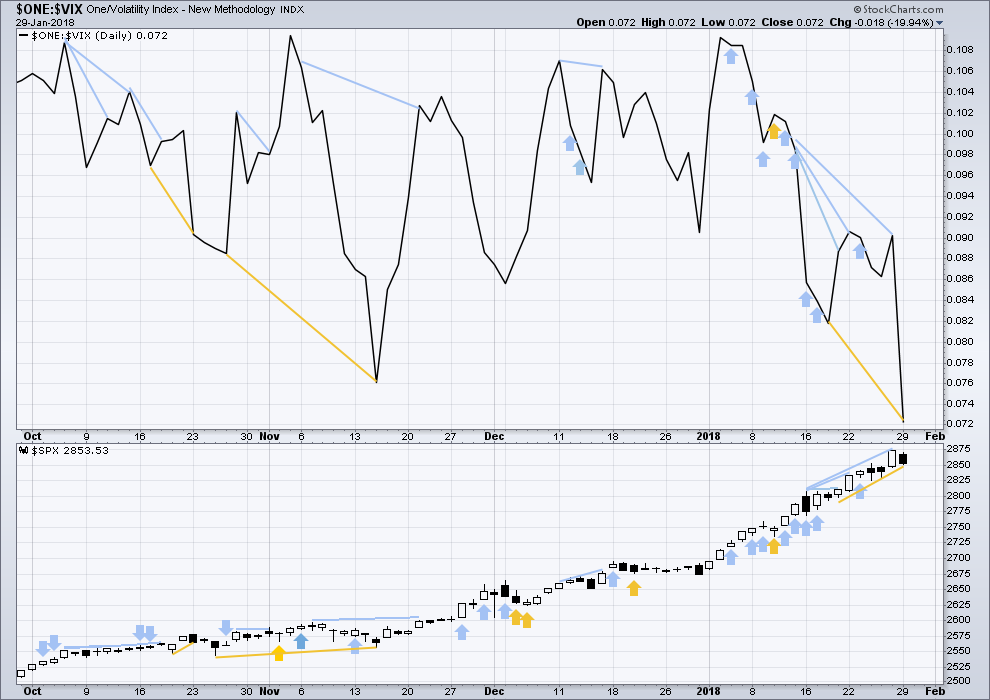
So that colour blind members are included, bearish signals will be noted with blue and bullish signals with yellow.
Normally, volatility should decline as price moves higher and increase as price moves lower. This means that normally inverted VIX should move in the same direction as price.
There is strong divergence today between price and inverted VIX: although price moved lower this session, it has not made a new low below a prior low of the 18th of January, but inverted VIX has made a new low well below the prior swing low of the 18th of January. This is given a traditional interpretation which may be found here. The increase in volatility has not been matched by a new low for price; price is weak. This is bullish.
BREADTH – AD LINE
Click chart to enlarge. Chart courtesy of StockCharts.com.
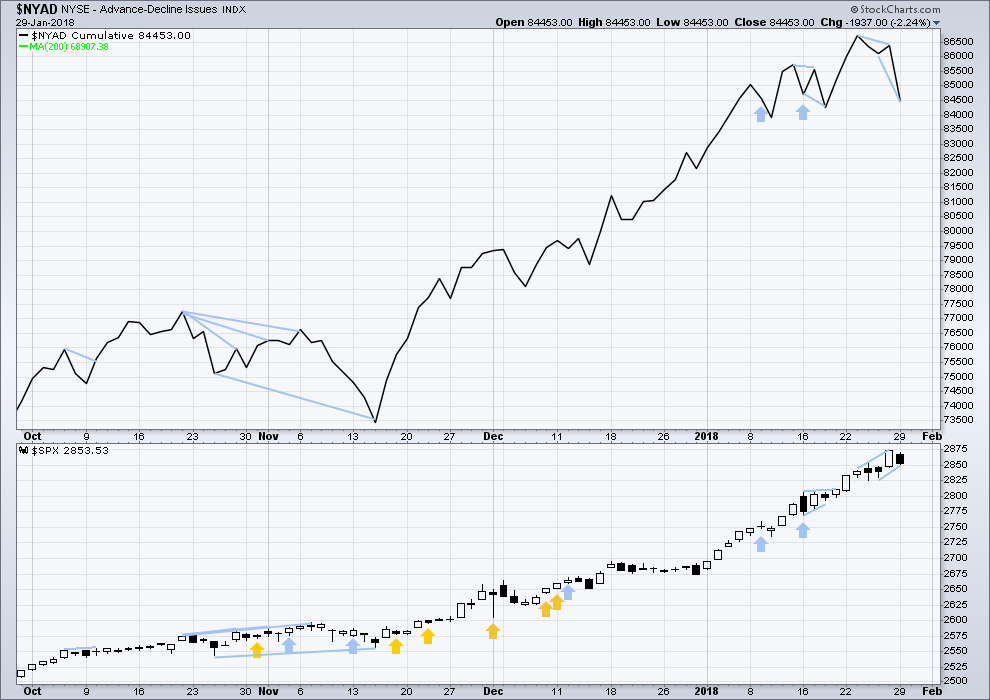
There is normally 4-6 months divergence between price and market breadth prior to a full fledged bear market. This has been so for all major bear markets within the last 90 odd years. With no longer term divergence yet at this point, any decline in price should be expected to be a pullback within an ongoing bull market and not necessarily the start of a bear market.
All of small, mid and large caps last week made new all time highs. This market has good support from rising breadth.
Breadth should be read as a leading indicator.
Interpretation of breadth is different to VIX. This is because breadth should be read as a leading indicator. Breadth has made a new low today substantially below the prior low two sessions ago, but price has not. This is interpreted as bearish.
Bearish divergence in breadth is given more weight than today’s divergence between price and VIX, because recently breadth appears to be more reliable.
DOW THEORY
The S&P500, DJIA and Nasdaq last week made new all time highs. Only DJT did not make a new all time high and has moved lower. This divergence is slightly bearish; DJT may be leading by beginning a correction first.
The following lows need to be exceeded for Dow Theory to confirm the end of the bull market and a change to a bear market:
DJIA: 17,883.56.
DJT: 7,029.41.
S&P500: 2,083.79.
Nasdaq: 5,034.41.
Charts showing each prior major swing low used for Dow Theory are here.
Published @ 08:24 p.m. EST.
While this move could be an ABC down it appears to also qualify as an incomplete impulse A, where the price action is completing a triangle 4, and tomorrow there will be a 5 wave down to complete A.
This…
Thats what I have as well
I think you have it right along with the others here agreeing. Tomorrow I look for a lower low on SPX and XIV to be followed by the start of a bigger move up to new ATH’s. Perhaps XIV to the 118 level I mentioned earlier and SPX to 2800.
Where do you think 5th wave down of A will be tomorrow?
As far as price goes?
Thank You
Can we please get a strong push up and out of this triangle? Go dog!!!! Lol!!! I’d like to get some head room on my positions. The market just…won’t….quite….get moving! Yet. There could be a buying surge here in starting at 12:30. Or…a sell off!!! Drat, this surge turned as well at the upper trend line. Hrrrmmmph.
Triangle entered in a down-trend, so move out will be to the downside for a final wave as you said above…. 🙂
Here’s my current view of RUT. The iv here is now price wise right in the lower area of the prior 4, per Hoyle. I’ll be taking a positional long as a 5 emerges.
Thank you so much LARA for the update!
You’re welcome 🙂
Before I read comments below and answer any questions, here’s your updated hourly chart. The alternate is the one. This looks good so far on the daily chart too.
There is a little alternation in depth, subminuette iv is now the deepest correction we have seen for a while and it’s close to the 0.382 Fibonacci ratio of subminuette iii.
The channel is redrawn using Elliott’s second technique: from 2 to 4, a copy on 3.
Lets see what volume has to say today, and the AD line too. If volume supports this move down and the AD line gives a bearish signal, I’ll look at a larger degree fourth wave to last a few more days.
First idea would be minuette (iv).
BUT
if volume does not support the move down and / or there is no bearish signal from the AD line, then the above chart may be correct and this may be another opportunity to join the trend.
either way, it’s a correction within an ongoing upwards trend. the only question really is, how long will it last, when will it end.
Lara, I’ve got major sell signals firing off for the first time since August. Is this not a breakaway gap, and further wouldn’t it make more sense to look for oversold conditions with positive divergence for a long signal? That would not occur for at least another 4 percent or so. I also count 5 waves done for wave 1 or A, with a B bounce or 2 to follow. Short term buy signal would occur around 2760 ish.
I agree. The chart above was my first impression this morning.
I agree it looks like a breakaway gap, and should be assumed to be so, until proven otherwise.
And now the session is closed we have volume and breadth bearish.
So when do the buying algos turn up?
I think they’re due about now?
I am partially long XIV at 122.99
Nice Rodney. I got into XIV at good size at 122.38 and took my profit; I see the action here “ringing out” in what is increasingly looking like a bearish triangle. I’m not a postional guy and by taking profit I’m back to almost flat for the day and ready to consider positional work when this finally looks really solidly back to impulsive action up.
Double bottom on a 50% fibonacci retrace point, completing a 1-2 up after this large ABC down 4, and then up and away into a 3? That would work for me.
JPM has turned at a highly overlapped cluster of fibo’s and symmetric retrace’s. I like JPM here.
So a multiple day correction at long last?
I missed it!
I also missed the VIX trade as I hesitated in pulling the trigger late last week.
I missed everything!
Now I will be looking to do something and I am going to get creamed!
Maybe I will go back into the miners as they have been getting destroyed the last 5 days! Don’t understand why either.
No Bounces today.
Rodney thanks for the suggestion of 114 XIV support. It’s turned so far at a very clear 62% fibo of the Dec low to ATH (yes even XIV obeys fractal structure!) at 119.50 and assuming the market has bottomed, it will be a grinding up and away from here. Note the (current) similarity of the Dec 1 low to what’s shaping up today; reeks of opportunity to me. XIV always eventually reclaims new highs, which are now up about 20% from current price action. Wow.
I am looking for one more move to a lower daily low. On XIV perhaps 118 or something like that. If we see it I will be buying long at that point. If we break above 2835 before a new low, that might indicate the low is in for this correction. I will most likely buy long XIV at that point.
It is also possible, as noted below, that yesterday’s and today’s move down is only A of an A-B-C correction. However, it could also be all of this correction in a simple zig-zag. Supporting the scenario that the correction is over at today’s low is 1) $NYMO is showing extremely over sold and 2) VIX daily is well above its BB as of now.
Interesting day.
Since main hourly invalidated and I don’t think alt hr apply… anyone have a new hourly bottom or target?
The alt hourly is still valid. The invalidation of that count is 2759, quite a ways further down.
VIX trades above B bands have long been indicative of at least an interim bottom. No B band expansion suggests this wave down is just about done. Buying VIX 15.00 strike puts expiring next Wed, 1\4 tranche for 2.10. I’m done for the day! The last 24 has been fun! 🙂
An interim bottom works for me!
One way of looking at the SPX action is to see a big 1, 2, 3, 4 down…pending a 5!
Here’s the question…
I guess it could be viewed instead as a simple zig zag with a long C. Otherwise, this has to be an impulse A wave down, implying a B-C to much lower lows…!!! Probably not. But I’m not really impressed with this bounce, it’s beginning to look corrective and weak. So perhaps lower lows are possible here. I’ve vastly reduced my red ink via aggressive trading of XIV and UPRO but am now quite cautious. However, I refuse to miss the ride up!!! Catch the bottom…catch the joy!!
It looks like 5-up on 3-minute chart. Even if that’s an “A” of an upward correction, there should be more up to come soon.
Dangerously close to getting that 5-down. What does it mean if we get it? Trend change? Where are we headed next?
The response to VIX 15 very much expected and there is a wick forming. I thought it would be more aggressively shorted. Maybe that’s still coming….
I would point out that the absence of upper wicks on VIX trading above its B band is highly unusual and suggests some algos have been turned off. A close above 15 today, even in the absence of a gap past it, woul be reason for caution imho. The reasons have been rehashed ad nauseam. In their very nature, ignored and probably dismissed by most.
2825 has been taken out. I think we are going much lower. All plans on going long on hold for the time being.
2808 is a 62% of the Jan 16 low to ATH, and there are two significant swing highs right there too. Key decision point as SPX continues to drop here.
Appears to be holding at the 50% at 2820. I have plunged. If it head fakes and starts dropping, I bail and try again lower…
VIX at 15, about where it was when we were worried about nuclear war in August. Color me a tad bit surprised.
I suspect given the changing nature of the market (moving from 3 of 3 action to a sequence of larger and larger 4’s), the VIX is “adjusting” re: it’s typical range, and probably broadly over time shows instead of a very wide downtrend, a very wide uptrend. Seems logical anyway. So we can’t assume a return to “recent normal” in any consistent, long term way, with frequent and longer term VIX values in the 9-10 range. The new normal is just going to be more volatile over the next few years.
Any other Schwab users here having trouble getting StreetSmart Edge to connect correctly today?
Verne, I’m out of all but 10%. Most were 4x, pretty epic!!
Incredible! I did a few 10X in ES overnight in double verticals that absolutely exploded. Also took profits on my midterm SVXY 130 puts after being underwater for a bit. I am still shaking my head in amazement.
The persistent bullish talk suggests that there could be more surprises ahead. I am looking for a long wick in VIX before I decide…
I suspect the Pavlovian reflex will run wild and some folk could really get burned if they are not very careful…
Congrats!!! I’ll reload on a 2 wave up, but for now dinner’s on me!!! Going surfing, done trading for the day. Cheers folks!
Spend some. Save some. Give some away! 🙂
Boom: the first of the larger 4’s hits! I’m not going to go out of my mind though: the NYTimes just ran a front page article on how every country is now in a period of positive economic growth (yup, every country!!). This correction will soon end and there will be a grinding path back to new highs. The question remains: when and at what price will the low of this 4 come in? The invalidation is way, way further down, so it could tumble far and not break our EW count. Or, will we get an immediate buy-in charge back up in the first hour after the open? I dunno…
I agree, it’s hard to get worried about pajama traders trying to tank the indices for no reason. We’re still in a period of unprecedented economic growth. There will still be a helluva lotta buyers at these levels, especially in the absence of any serious exogenous event that could give us pause.
I think we are looking at the best buying opportunity in the past 6 to 12 months directly ahead, perhaps today. First of all, I want VIX to close outside its daily BB. The next day we want a close inside followed by a third daily close at a lower point. Secondly, I watch the McClellan Oscillator ($NYMO). Yesterday it closed below its lower BB right at -40. Two days in a row below the lower BB is often followed by a big day up. But the signal is for it to close inside the lower BB.
Yesterday I had perfect timing on my long volatility entry point. I was premature in my exit albeit with a good profit. I would have doubled the profit if I left it run over night. Oh well, it is counter productive to cry over what could have been. There is a good chance I will be entering my long positions today. If not today, then tomorrow. The problem I have is I will be in my car on a long trip for at least 8 hours tomorrow with most of those during the trading day. Rats!
We may have completed Minor 3 at the most recent high. Perhaps even Intermediate 3. We shall see what Lara has to say. But I am with you Kevin in that new ATH’s are ahead.
Look for support of XIV around 114.
I’d expect to see some clear and strong divergence develop between price and RSI before intermediate (3) turns up.
Wow! I should trade ES more often!
I think I will now take the rest of the year off!!
A huge shout-out to the guys at Fasanara Capital for an incredible inside tip on what to look for and how to play it! You guys ROCK!!!!! 🙂 🙂 🙂
Those guys are legit, I talk to them weekly. Good SMAs and unique strategies
I had no idea you could trade options on futures!! Talk about crazy explosive!
Verne was that via their “Cookies” section as shown on their Insights page ?
Thanks
Peter
Peter you can actually subscribe to their free newsletter even if you don’t have funds with them. If you do, you can get get great feedback about trading ideas and strategies to take the greatest advantage of the remarkable vol situation we are in. I suspect if you shoot them an e-mail they would get back to you as well.
Just Typical… Overnight correction!
DOW… YM down 240
SPX… ES down 17.50
I should have taken short position near close on Friday. Screwed again!
Yup almost 300, if they don’t save it the rest of the week could get very interesting
Not to worry. The nature of what is ahead will offer a plenitude of opportunity to take advantage for those who are awake. No need whatsoever for haste… 🙂
Well said, heading in to the office to get it on this am
If you miss one bus, there’s always another coming…
The action in VIX makes this very unlikely to be a small degree corrective wave.
It is certainly possible, but it would be unusual…
Yeah, I was not certain about how to interpret that huge spike. The traditional approach would be bullish divergence, but if it’s a leading indicator then it would be bearish.
Turns out I was wrong, and I should have interpreted it in the same way as the AD line, a leading indicator and a bearish signal.
I don’t blame you in the slightest Lara. What I have noticed is that the VIX signals are triggering on a somewhat delayed basis. It turns out the TWS signal a few weeks back was indeed a harbinger of a sea change in volatility so perhaps going forward we can factor that in…. looks like we have a contracting triangle for a small fourth so one more wave down before the turn… 🙂
Hi!
Looking mighty ‘sassy’ there my friend. Who are your friends, PJ, Friz & Tedd?
All of the above, Doc…!
Besides meeting Mr. Market at the O.K. corral! 😀