
The short term target at 2,840 was reached and slightly passed today. This has implications for the Elliott wave structure at the hourly chart level, so new targets have been calculated.
Summary: The trend is up and strong. Corrections are an opportunity to join the trend.
The next target is 2,874 for a very short term interruption to the trend (it may be over within a day), and the target after that is at 2,951 for another short term interruption to the trend (it may be over within a week).
This looks like a third wave that is still incomplete.
On Balance Volume and the AD line are both very bullish today.
The biggest picture, Grand Super Cycle analysis, is here.
Last historic analysis with monthly charts is here. Video is here.
An historic example of a cycle degree fifth wave is given at the end of the analysis here.
MAIN ELLIOTT WAVE COUNT
WEEKLY CHART
Click chart to enlarge.
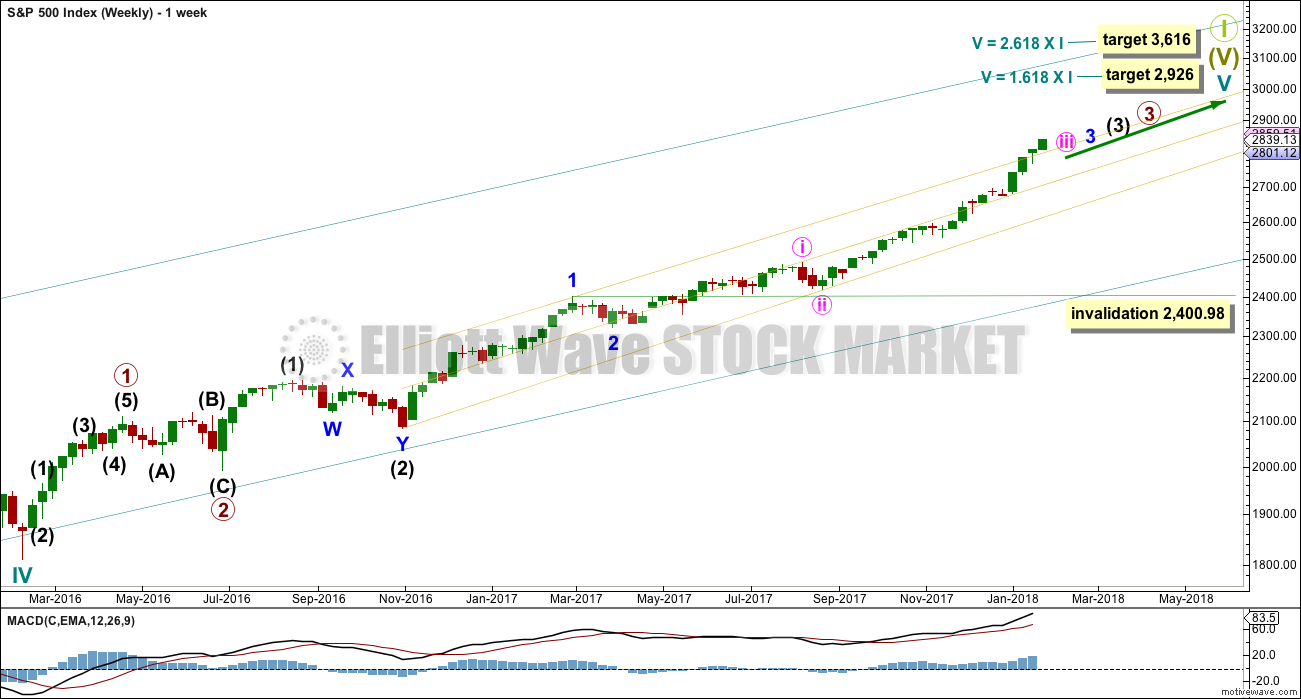
Cycle wave V must complete as a five structure, which should look clear at the weekly chart level. It may only be an impulse or ending diagonal. At this stage, it is clear it is an impulse.
Within cycle wave V, the third waves at all degrees may only subdivide as impulses.
Within cycle wave V, the corrections for primary wave 2 and intermediate wave (2) both show up clearly, both lasting several weeks. The respective corrections for intermediate wave (4) and primary wave 4 should also last several weeks, so that they show up at weekly and monthly time frames. The right proportions between second and fourth wave corrections give a wave count the right look. This wave count expects to see two large multi week corrections coming up.
Cycle wave V has passed equality in length with cycle wave I, which would be the most common Fibonacci ratio for it to have exhibited. The next most common Fibonacci ratio would be 1.618 the length of cycle wave I. This target at 2,926 now looks too low. The next most common Fibonacci ratio would be 2.618 the length of cycle wave I at 3,616. This higher target is looking more likely at this stage.
Intermediate wave (3) has passed equality in length with intermediate wave (1). It has also now passed both 1.618 and 2.618 the length of intermediate wave (1), so it may not exhibit a Fibonacci ratio to intermediate wave (1). The target calculation for intermediate wave (3) to end may have to be done at minor degree; when minor waves 3 and 4 are complete, then a target may be calculated for intermediate wave (3) to end. That cannot be done yet.
When minor wave 3 is complete, then the following multi week correction for minor wave 4 may not move into minor wave 1 price territory below 2,400.98. Minor wave 4 should last about four weeks to be in proportion to minor wave 2. It may last about a Fibonacci three, five or even eight weeks if it is a time consuming sideways correction like a triangle or combination. It may now find support about the mid line of the yellow best fit channel. If it does find support there, it may be very shallow. Next support would be about the lower edge of the channel.
A third wave up at four degrees may be completing. This should be expected to show some internal strength and extreme indicators, which is exactly what is happening. Members are advised to review the prior example given of a cycle degree fifth wave here. The purpose of publishing this example is to illustrate how indicators may remain extreme and overbought for long periods of time when this market has a strong bullish trend. If the current wave count is correct, then the equivalent point to this historic example would be towards the end of the section delineated by the dates November 1994 to May 1996. In other words, the upwards trend for this fifth wave may only have recently passed half way and there may be a very long way up to go yet.
DAILY CHART
Click chart to enlarge.
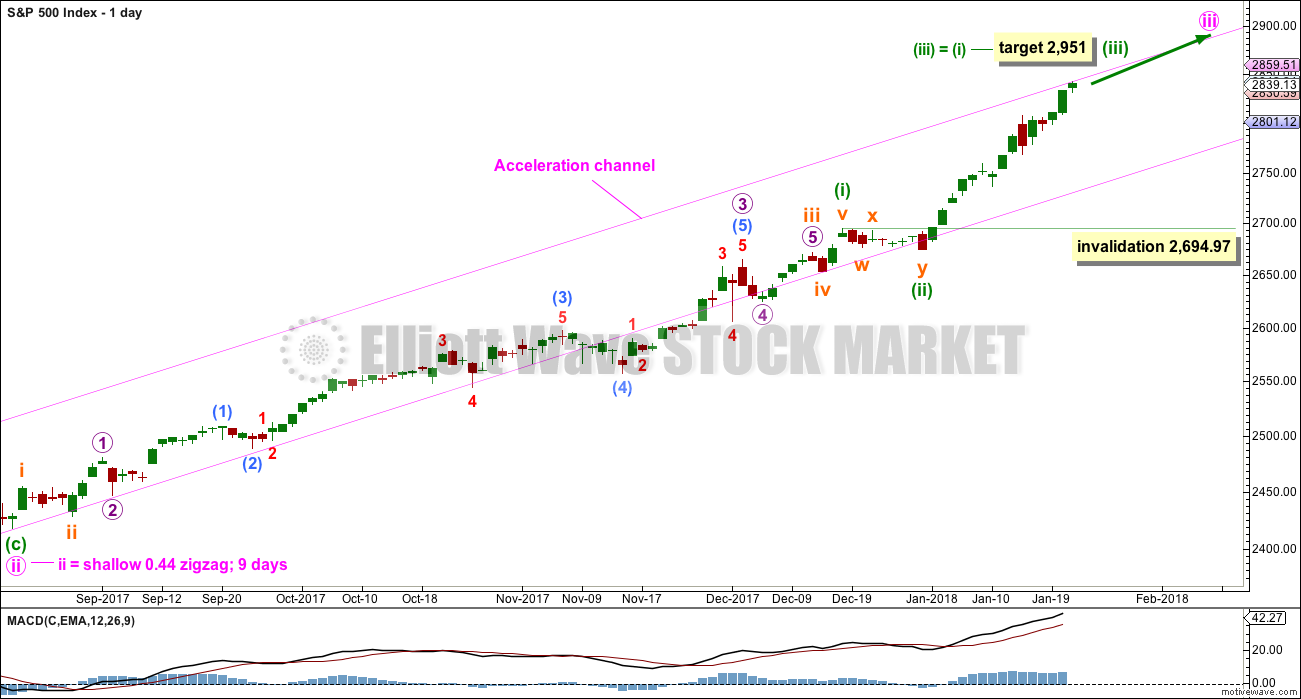
Keep redrawing the acceleration channel as price continues higher: draw the first line from the end of minute wave i to the last high, then place a parallel copy on the end of minute wave ii. When minute wave iii is complete, this would be an Elliott channel and the lower edge may provide support for minute wave iv.
The target for minute wave iii to end is today removed. The last target at 2,858 for minute wave iii to reach 2.618 the length of minute wave i now looks inadequate. The target for minute wave iii may best be calculated at minuette degree.
The focus for the short term will be on identifying the next multi week interruption to the upwards trend.
A new target for minuette wave (iii) is today calculated. This fits only with the second higher target on the weekly chart.
Minuette wave (ii) subdivides as a combination and lasted only eight sessions, about only one and a half weeks. Minuette wave (iv) may be a zigzag, which tend to be quicker structures than combinations; a Fibonacci five days will be the first expectation, but it may be over within less than one week.
Because minuette wave (i) was a long extension, minuette wave (iii) may be shorter or only about equal in length. If minuette wave (iii) is about equal in length with minuette wave (i), then they would both be long extensions. Only two actionary waves within an impulse may be extended. If both minuette waves (i) and (iii) are extended, then minuette wave (v) may not extend.
Minuette wave (iv), when it arrives, may not move into minuette wave (i) price territory below 2,694.97.
HOURLY CHART
Click chart to enlarge.
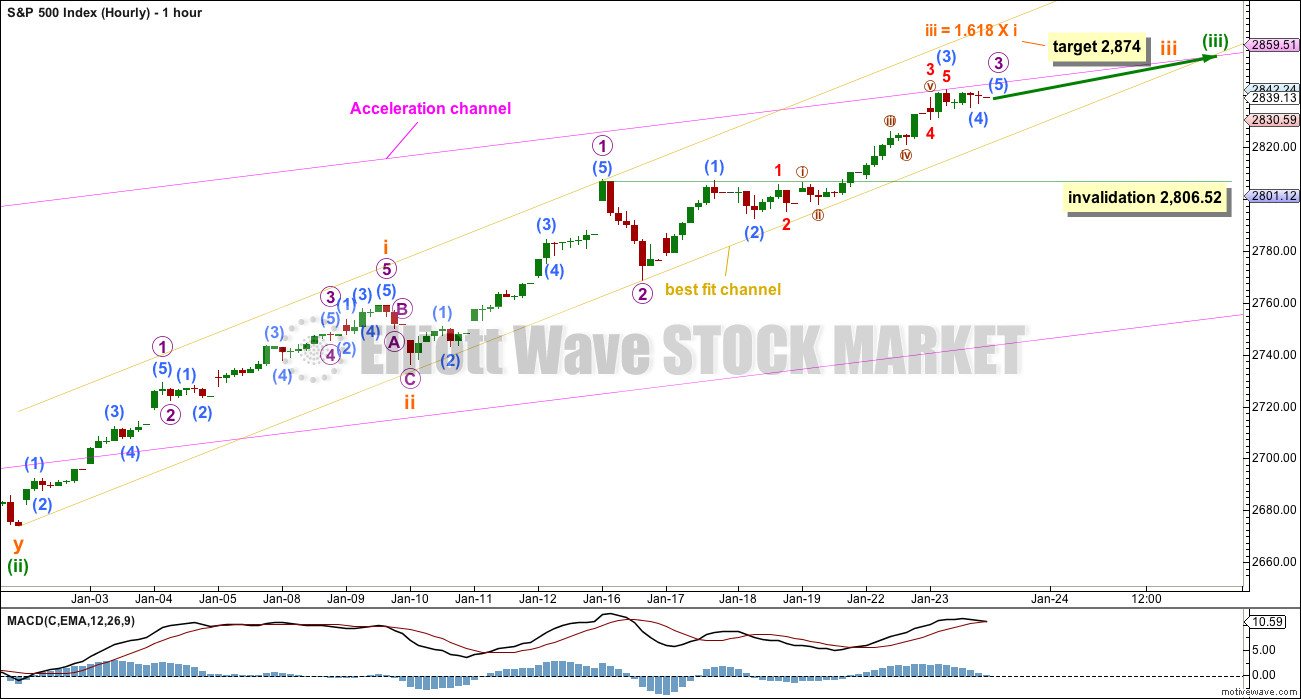
Always assume that the trend remains the same until proven otherwise. At this stage, there is no technical evidence for a trend change; we should assume the trend remains upwards.
With the new high today slightly exceeding the prior limit, subminuette wave iii cannot be over and it must be extending. The first target calculated will assume the most common Fibonacci ratio for subminuette wave iii to subminuette wave i.
Subminuette wave iii may only subdivide as a simple impulse structure, and within it micro wave 2 shows up strongly at the hourly chart level lasting 5 hours. Micro wave 4 may also last about 5 hours, when it arrives, but it may be a little longer lasting if it is a more time consuming sideways correction such as a combination, triangle or flat.
Micro wave 4 may not move into micro wave 1 price territory below 2,806.52.
TECHNICAL ANALYSIS
WEEKLY CHART
Click chart to enlarge. Chart courtesy of StockCharts.com.
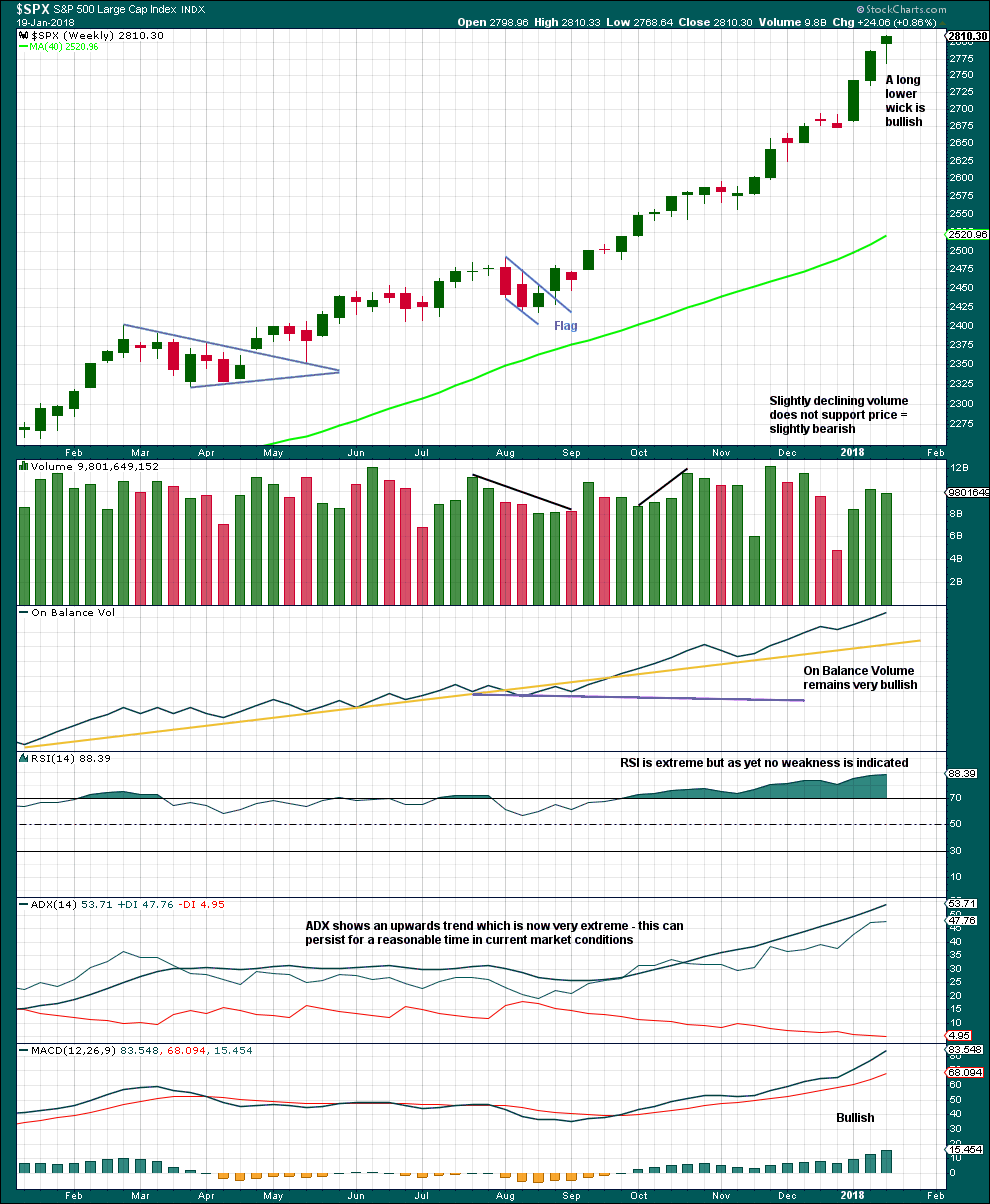
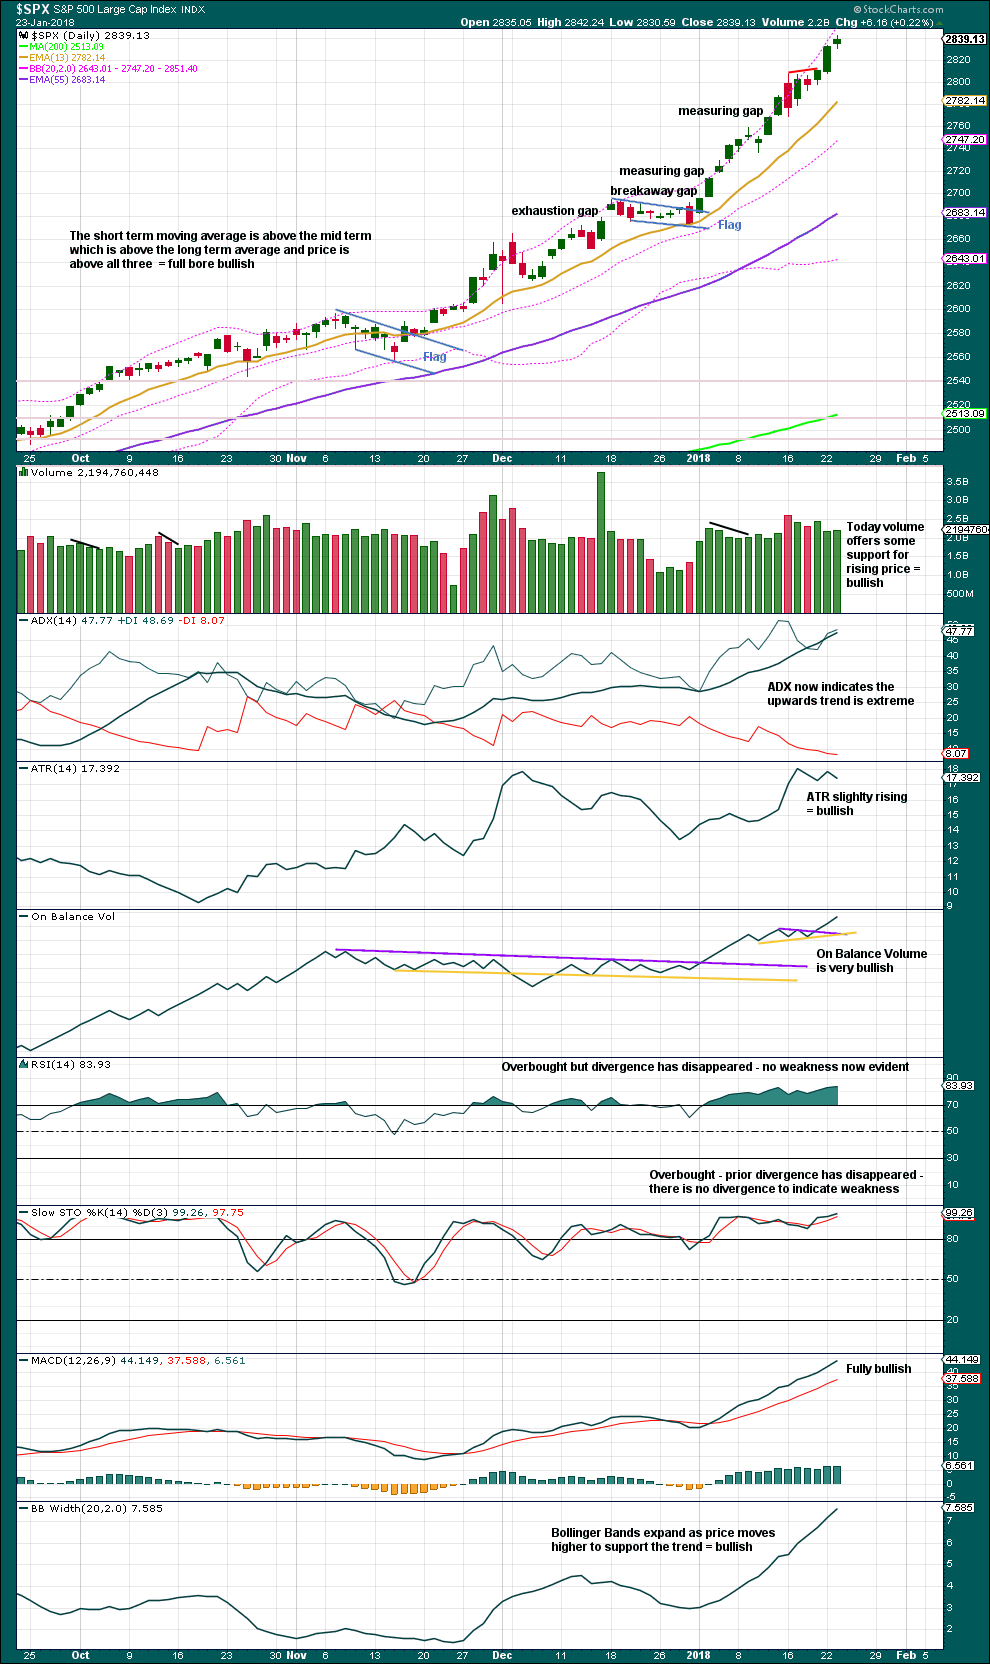
This upwards trend is extreme and stretched, but there is still no evidence of weakness at the weekly time frame.
As a third wave at multiple degrees comes to an end, it would be reasonable to see indicators at extreme levels.
A correction will come, but it looks like it may not be here yet.
DAILY CHART
Click chart to enlarge. Chart courtesy of StockCharts.com.
ADX is extreme when it either reaches above 35 or the black ADX line is above both directional lines. If both of these conditions are met, then ADX is very extreme. At this time, ADX is only extreme and not very extreme. But it may become very extreme and remain so for a reasonably long period of time.
RSI and Stochastics may remain overbought for months. Only when they exhibit clear and strong divergence with price would they be indicating enough weakness for the trend to be possibly ending.
This trend is overbought and extreme, but it can continue like this for much longer.
On Balance Volume is very bullish.
VOLATILITY – INVERTED VIX CHART
Click chart to enlarge. Chart courtesy of StockCharts.com.
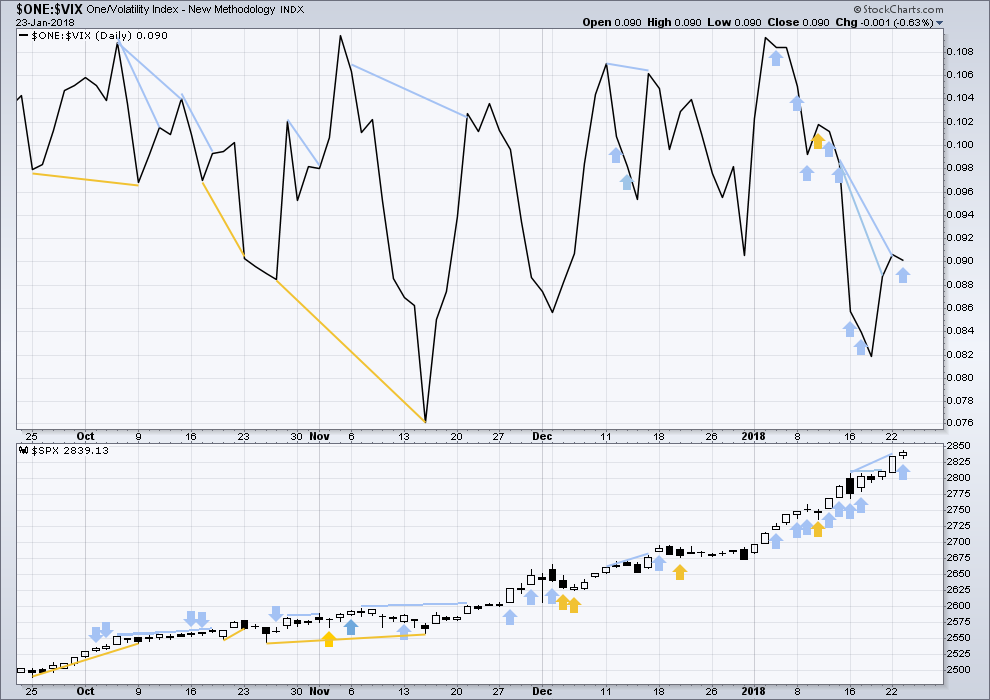
So that colour blind members are included, bearish signals will be noted with blue and bullish signals with yellow.
Normally, volatility should decline as price moves higher and increase as price moves lower. This means that normally inverted VIX should move in the same direction as price.
There is still strong short term divergence between price and inverted VIX. The new high in price has not come with a normal corresponding decline in market volatility. This is bearish. There is also single day bearish divergence today between price and inverted VIX: price has moved higher, but inverted VIX has moved lower. The rise in price today did not come with a normal decline in volatility; volatility has increased. This is bearish.
However, recent bearish signals from VIX have so far all failed. This signal today is not given weight in this analysis.
BREADTH – AD LINE
Click chart to enlarge. Chart courtesy of StockCharts.com.
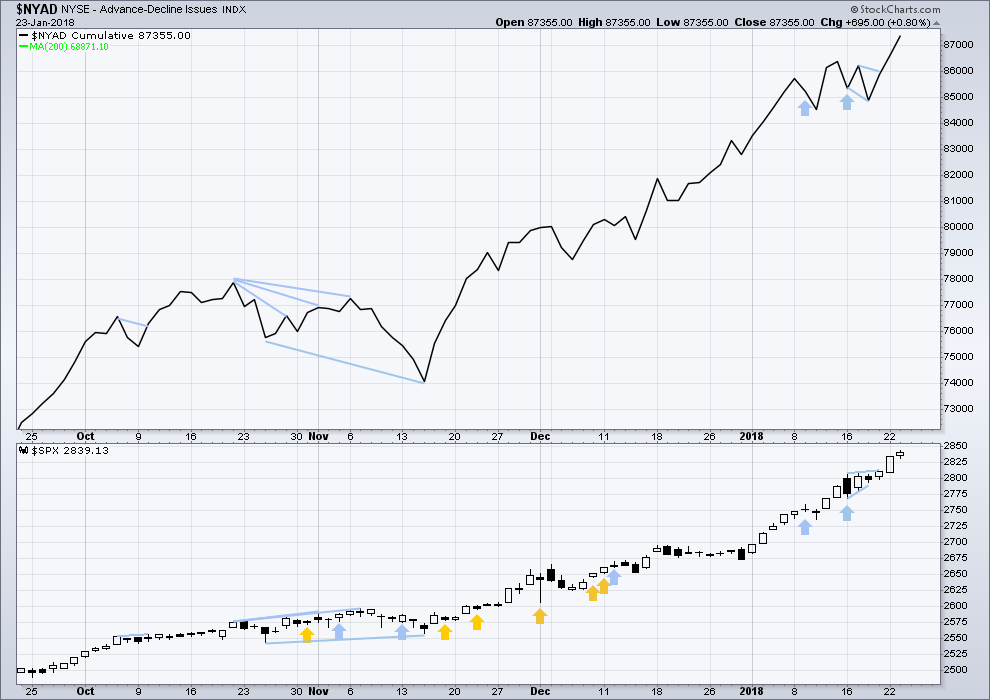
There is normally 4-6 months divergence between price and market breadth prior to a full fledged bear market. This has been so for all major bear markets within the last 90 odd years. With no longer term divergence yet at this point, any decline in price should be expected to be a pullback within an ongoing bull market and not necessarily the start of a bear market.
All of small, mid and large caps last week made new all time highs. This market has good support from rising breadth.
Breadth should be read as a leading indicator.
Again, price and the AD line have both made new all time highs. The rise in price is supported by rising market breadth. This is bullish.
DOW THEORY
The S&P500, DJIA, DJT and Nasdaq last week all made new all time highs. The ongoing bull market is confirmed.
The following lows need to be exceeded for Dow Theory to confirm the end of the bull market and a change to a bear market:
DJIA: 17,883.56.
DJT: 7,029.41.
S&P500: 2,083.79.
Nasdaq: 5,034.41.
Charts showing each prior major swing low used for Dow Theory are here.
Published @ 09:41 p.m. EST.
Watching VIX B bands with interest. So far price being contained by B band expansion suggesting accumulation by strong hands. Have a great evening everyone!
Lara have you seen my comment earlier about the micro wave 1 high point?
Probably irrelevant now assuming micro 4 is done
I am sorry Peter, I missed that.
I’ve checked again and my invalidation point is wrong, but still not the same as your data. I have micro wave 1 high at 2,807.54.
Sorry everybody for that mistake.
Ha yep no probs Lara. I have 2807.54 as well.
Rodney nice call on the SPX price drop portent of the VIX!! Hope you did catch it. I need to start taking advantage of that little indicator, it’s powerful ju-ju.
Due to some previous issues on this forum, for the first time in years, I have not been publishing my trades.
Understood. I am sorry for it, and if there is anything I can do to make you feel comfortable enough to publish trades then let me know.
If you want to that is. We’re all most certainly entitled to our privacy.
VIX has been on some wild ride today! Volatility of volatility.
If this yellow best fit channel is still providing support then the low is in for today.
So far the count for subminuette iii looks very good. Micro 2 and 4 are nicely in proportion, this looks like an extended third wave. So far.
If this count is correct then the low today is another opportunity to enter the trend.
The trend is still up, until proven otherwise.
Nice call on the low!! It missed the fibo’s, but nailed your channel line.
Awesome! I anyone’s entered long there then it should be profitable and stops may be pulled up soon to remove risk.
Looks like corrections are occurring intra-day…
Big move up… then correct to negative and then close green.
Looks like you may be right there Joseph. It’s bouncing up off that support line….
Looking for SPX to reach oversold on 15-minute chart to go long. Should be within the hour.
I’m seeing an (a) down, a (b) up (incomplete still perhaps), and expecting a (c) push down to at least 2830, with potential for 2822 or even 2816.
My to the minute working model. Looking for a 2 bottom soon, indicated by a turn off one of those fibos.
perfect bounce off the 76.4%. Will it hold? Nothing beats 2 bottoms for high leverage/good odds (a 3 is coming!!).
Revised! In higher time frame 4 down now. Awesome, we’ll get a lower entry price soon. The marker is a projection of the matching 2, showing a likely depth for this 4 (around the 62%, shock and awe).
Thanks for sharing. Do you have the 1 starting on January 2? If so, how long do you expect the 5 to last once it begins?
Yes, a higher time frame wave 5 started Jan 2, the 2 of that 5 bottomed on Jan 10, and this is all part of the 3 of that 5, the 3 starting Jan 10. This is the 4 of that 3 (as I see it and I pretty certain I’m consistent with Lara’s main). 5’s are seriously flakey as far as I’m concerned, so I don’t know how long it’ll last. A “nominal” time would be the time period of the matching 1, which is Jan 10 to Jan 16, about 3-4 days.
This…
Top stocks being raided by pros…Lower USD means better for large corporations
Once again, strong VIX divergence from SPX price action. I still see SPX in micro-wave 5 up here, so I assume it’s just the Chicago SPX option traders getting antsy!! One target/decision point is where (5) = (1) and that’s around 2873, quite a ways up, though wave 5 here has technically met all rules and could stop anytime. However, it rarely works like that; it itself should end up with some fascsimile of a 5 wave structure showing on the 5 minute chart. Looks like 1 and maaaybe 2 are in so far. So I’ve got some XIV on the bet higher prices and lowering VIX values are coming.
This VIX divergence this morning is rather extreme; straight up market, straight up VIX!
I noticed that as well. It does not always portend a drop in SPX value. But we do have that recent example back around the end of November where SPX dropped 50+ points in a matter of an hour or two. Sure would be nice to catch that. But it is rather like trying to catch a falling knife.
The only thing I’ll be doing in a big price drop at this point in time is trying to figure where the bottom is so I can go long. Shorting this market is for experts and/or crazy people as I see it, and I’m not the former and trying to relearn not to be the latter, lol!!!! Well, let’s see how this goes. Eventually, XIV will be back to 145, and it might even be this week, might even be today!
Yep! They smashed the short sellers from yesterday with that move past the high. I would have preferred to see a gap but these guys are just steadily accumulating, no undue haste, just steady as she goes….
We should see the battle now truly joined around the 13 pivot….
I bailed on my XIV position after adding a bit at a relative low, then getting back to break even; when the action is “weird”, my view is GET OUT and wait for a new combination of “good set up” and “I understand this”! Meanwhile, scored on a buy of HAL as it bottomed and turned this morning, and took my TBT profits from earlier buys; looking for the next TBT pullback (don’t just keep going up please!!). A very good morning indeed! And eventually XIV will start trending back up, and that’ll be the time to pounce again.
Lara, I have the high for Micro 1 on Jan 16 as 2807.54 which I also have as the daily high?
Am I first??!!!
Yes you are, you silly rabbit.
Dag nab it!