
Upwards movement continues as expected. The target is also now a short term limit.
Summary: The next target is also a limit at 2,840.
The alternate is invalid. Bullish signals today from On Balance Volume and the AD line are given weight.
The biggest picture, Grand Super Cycle analysis, is here.
Last historic analysis with monthly charts is here. Video is here.
MAIN ELLIOTT WAVE COUNT
WEEKLY CHART
Click chart to enlarge.
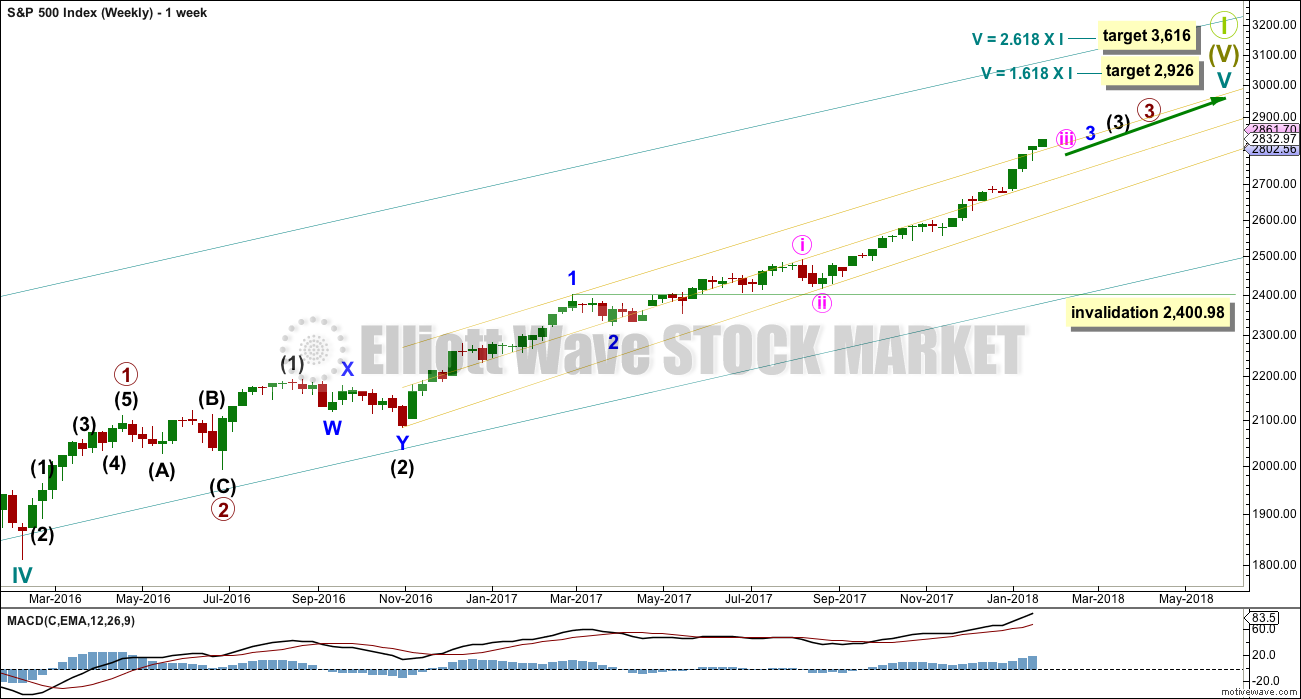
Cycle wave V must complete as a five structure, which should look clear at the weekly chart level. It may only be an impulse or ending diagonal. At this stage, it is clear it is an impulse.
Within cycle wave V, the third waves at all degrees may only subdivide as impulses.
Within cycle wave V, the corrections for primary wave 2 and intermediate wave (2) both show up clearly, both lasting several weeks. The respective corrections for intermediate wave (4) and primary wave 4 should also last several weeks, so that they show up at weekly and monthly time frames. The right proportions between second and fourth wave corrections give a wave count the right look. This wave count expects to see two large multi week corrections coming up.
Cycle wave V has passed equality in length with cycle wave I, which would be the most common Fibonacci ratio for it to have exhibited. The next most common Fibonacci ratio would be 1.618 the length of cycle wave I.
Intermediate wave (3) has passed equality in length with intermediate wave (1). It has also now passed both 1.618 and 2.618 the length of intermediate wave (1), so it may not exhibit a Fibonacci ratio to intermediate wave (1). The target calculation for intermediate wave (3) to end may have to be done at minor degree; when minor waves 3 and 4 are complete, then a target may be calculated for intermediate wave (3) to end. That cannot be done yet.
When minor wave 3 is complete, then the following multi week correction for minor wave 4 may not move into minor wave 1 price territory below 2,400.98. Minor wave 4 should last about four weeks to be in proportion to minor wave 2. It may last about a Fibonacci three, five or even eight weeks if it is a time consuming sideways correction like a triangle or combination. It may now find support about the mid line of the yellow best fit channel. If it does find support there, it may be very shallow. Next support would be about the lower edge of the channel.
A third wave up at four degrees may be completing. This should be expected to show some internal strength and extreme indicators, which is exactly what is happening.
DAILY CHART

Click chart to enlarge.
Keep redrawing the acceleration channel as price continues higher: draw the first line from the end of minute wave i to the last high, then place a parallel copy on the end of minute wave ii. When minute wave iii is complete, this would be an Elliott channel and the lower edge may provide support for minute wave iv.
Minute wave iii has passed 1.618 the length of minute wave i. The next Fibonacci ratio in the sequence is used to calculate a target for it to end.
Minute wave iii may only subdivide as an impulse, and within it minuette wave (i) only may have recently ended as a long extension. This main wave count fits with MACD: upwards momentum is showing an increase as a third wave continues upwards.
Within the impulse of minute wave iii, the upcoming correction for minuette wave (iv) may not move back into minuette wave (i) price territory below 2,694.97.
Because minuette wave (i) with this wave count is a long extension, it is reasonable to expect minuette wave (iii) may only reach equality in length with minuette wave (i). This target fits with the higher target for minute wave iii one degree higher.
HOURLY CHART
Click chart to enlarge.
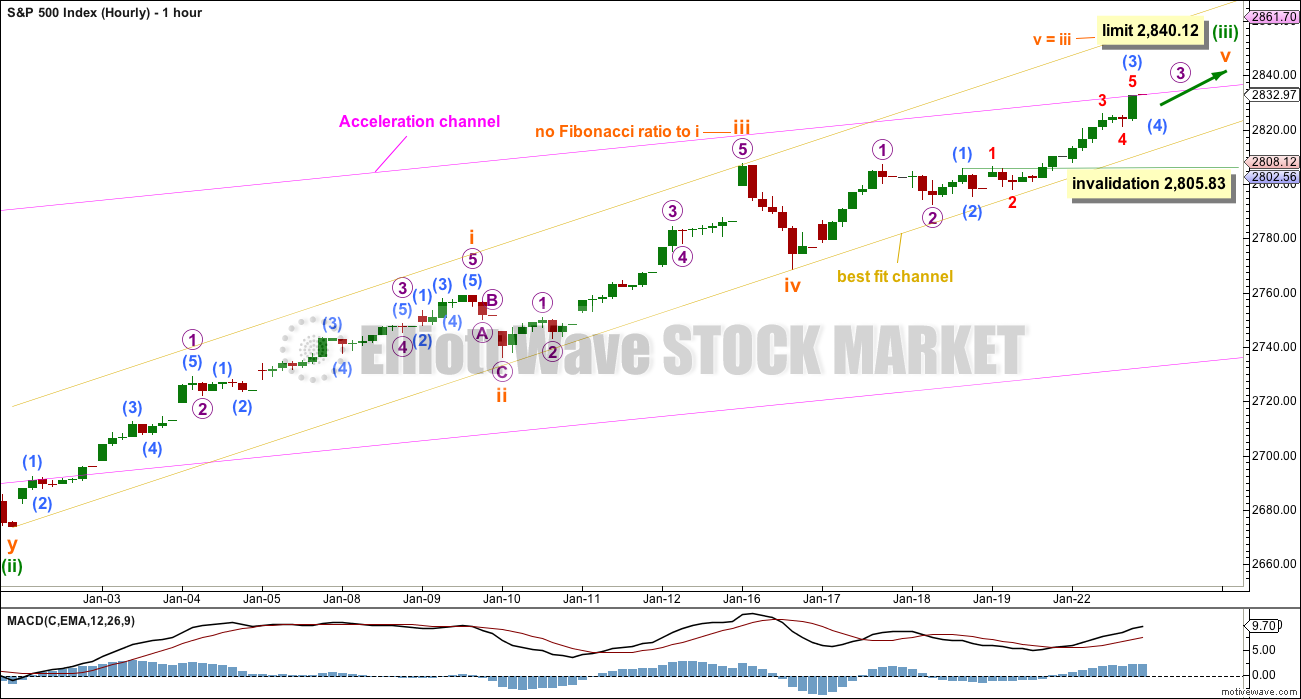
Always assume that the trend remains the same until proven otherwise. At this stage, there is no technical evidence for a trend change; we should assume the trend remains upwards.
Subminuette wave iii is shorter than subminuette wave i. This limits subminuette wave v to no longer than equality in length with subminuette wave iii at 2,840.12, so that subminuette wave iii is not the shortest and the core Elliott wave rule is met.
The structure is still incomplete within subminuette wave v, which needs to complete as a five wave structure, either an impulse or an ending diagonal. At this stage, it looks like an incomplete impulse.
Within submineutte wave v, micro waves 1 and 2 look complete. Micro wave 3 may be very close to completion. Micro wave 4 may not move into micro wave 1 price territory below 2,805.83.
Minuette wave (ii) was a very shallow combination lasting eight days. Minuette wave (iv) may also last about a Fibonacci eight days.
TECHNICAL ANALYSIS
WEEKLY CHART
Click chart to enlarge. Chart courtesy of StockCharts.com.
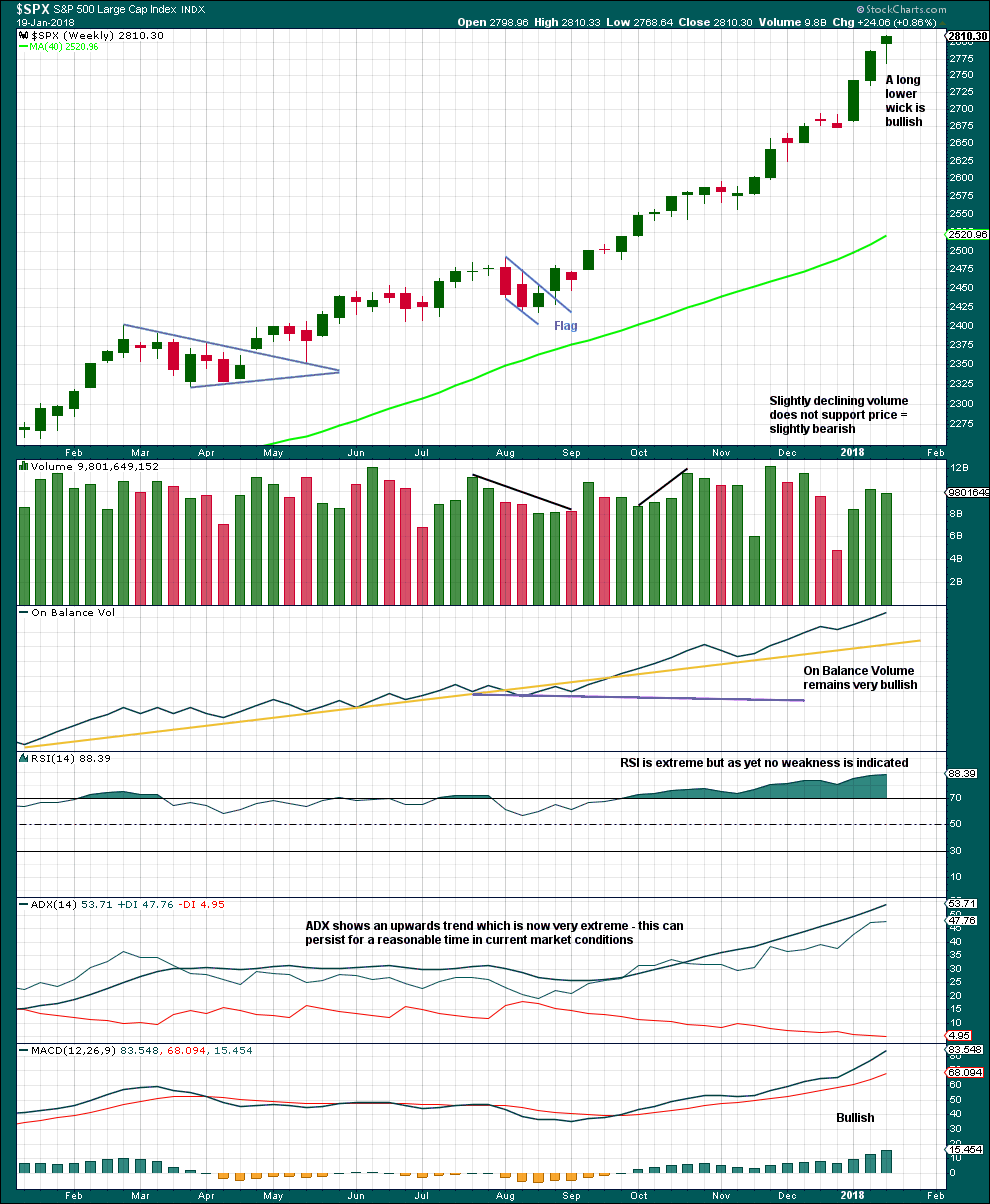
This upwards trend is extreme and stretched, but there is still no evidence of weakness at the weekly time frame.
As a third wave at multiple degrees comes to an end, it would be reasonable to see indicators at extreme levels.
A correction will come, but it looks like it may not be here yet.
DAILY CHART
Click chart to enlarge. Chart courtesy of StockCharts.com.
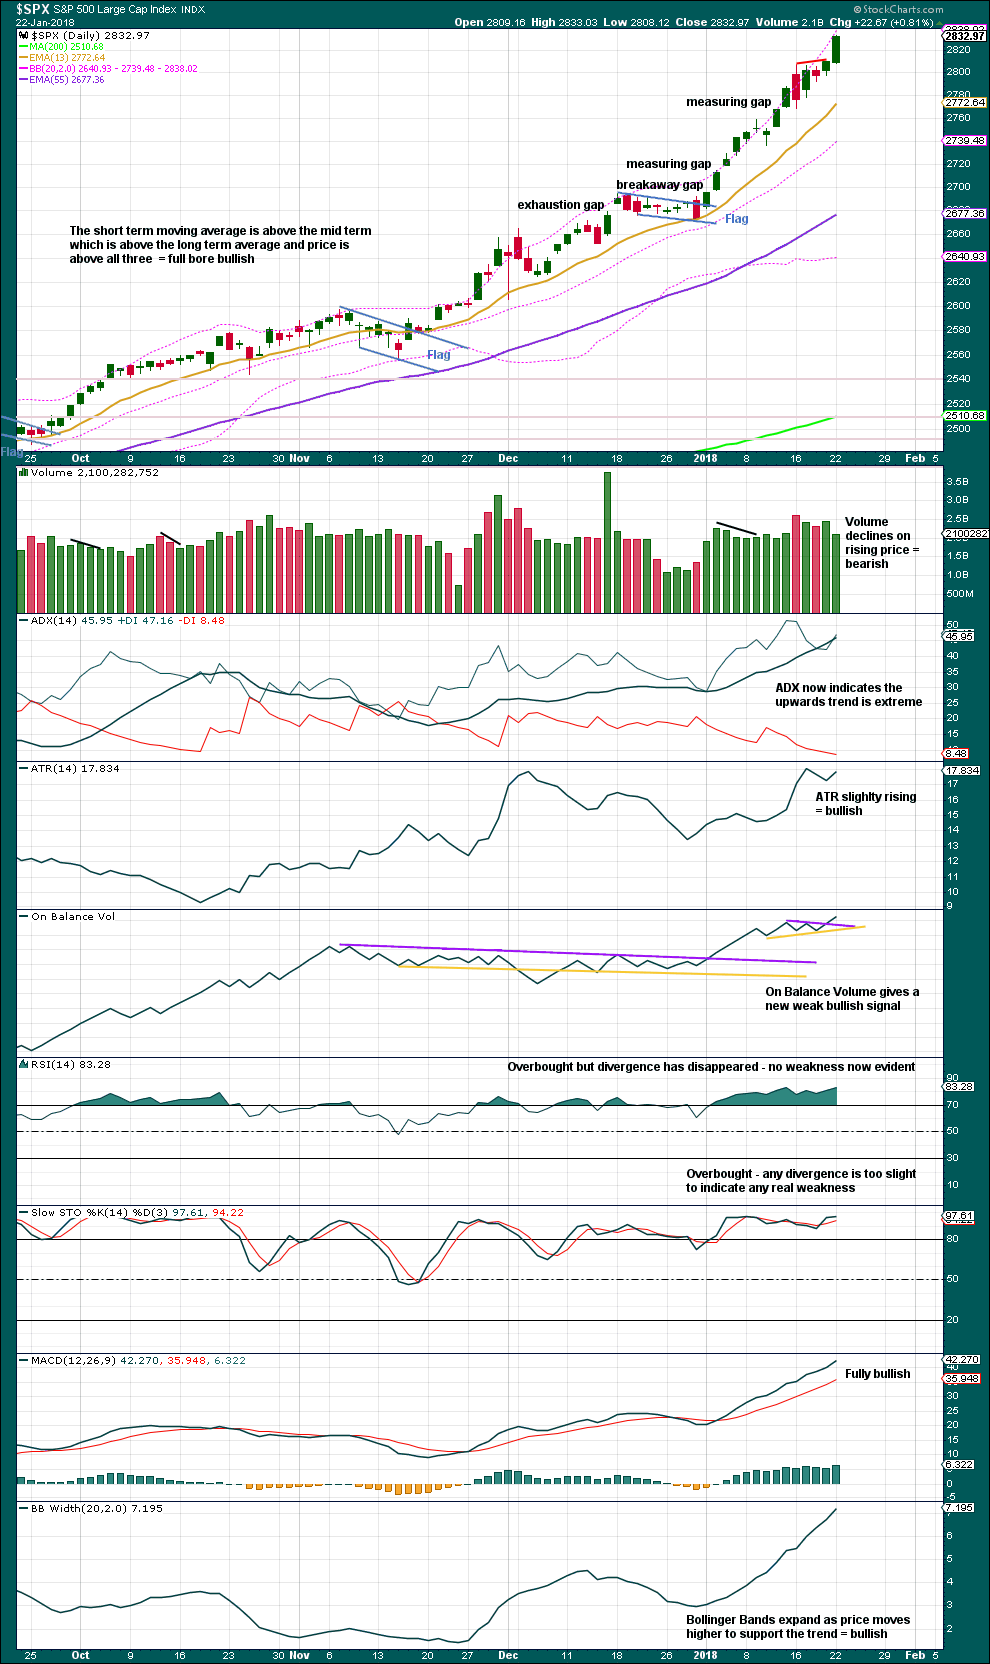
On Balance Volume today has broken out of its new small range to give a bullish signal. This signal is weak because the trend line was only just drawn, but it is still another bullish signal.
Although volume today did not support the rise in price, this is given little weight as declining volume both short and long term has been a feature of this market for a long time.
Overall, this chart remains bullish. The trend is extended and overbought, so it might be useful to look back at prior third waves in the S&P to see how extended a strong trend may become and for how long overbought conditions may be maintained. This is done below.
VOLATILITY – INVERTED VIX CHART
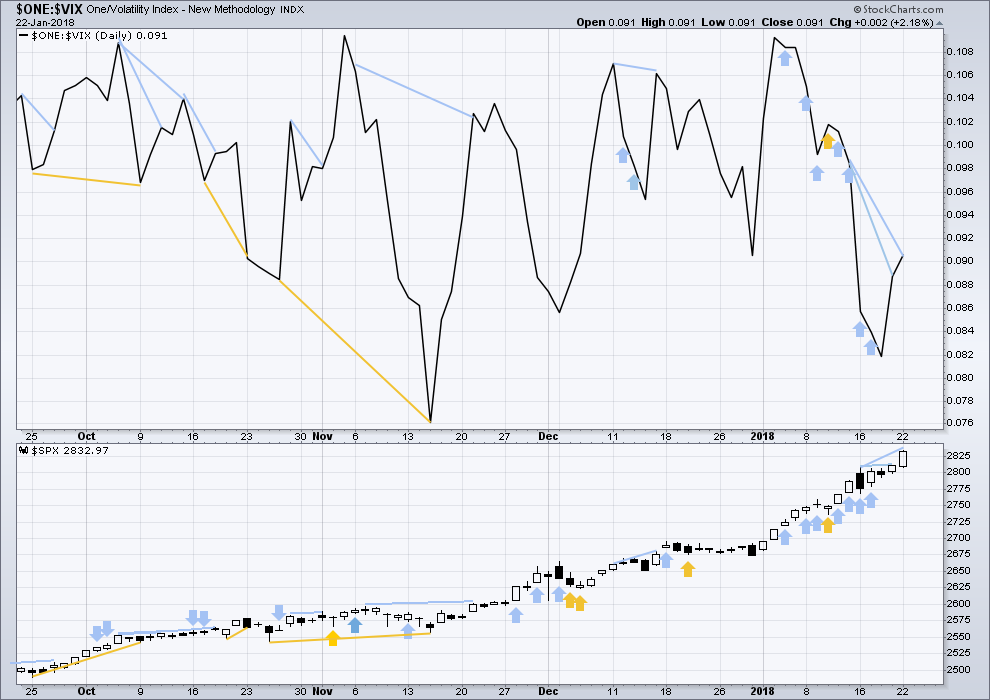
Click chart to enlarge. Chart courtesy of StockCharts.com.
So that colour blind members are included, bearish signals will be noted with blue and bullish signals with yellow.
Normally, volatility should decline as price moves higher and increase as price moves lower. This means that normally inverted VIX should move in the same direction as price.
Bearish signals from VIX have not been followed by any downwards movement. They may have all failed, or it could be that these signals are early.
There is still strong short term divergence between price and inverted VIX. The new high in price has not come with a normal corresponding decline in market volatility. This is bearish.
BREADTH – AD LINE
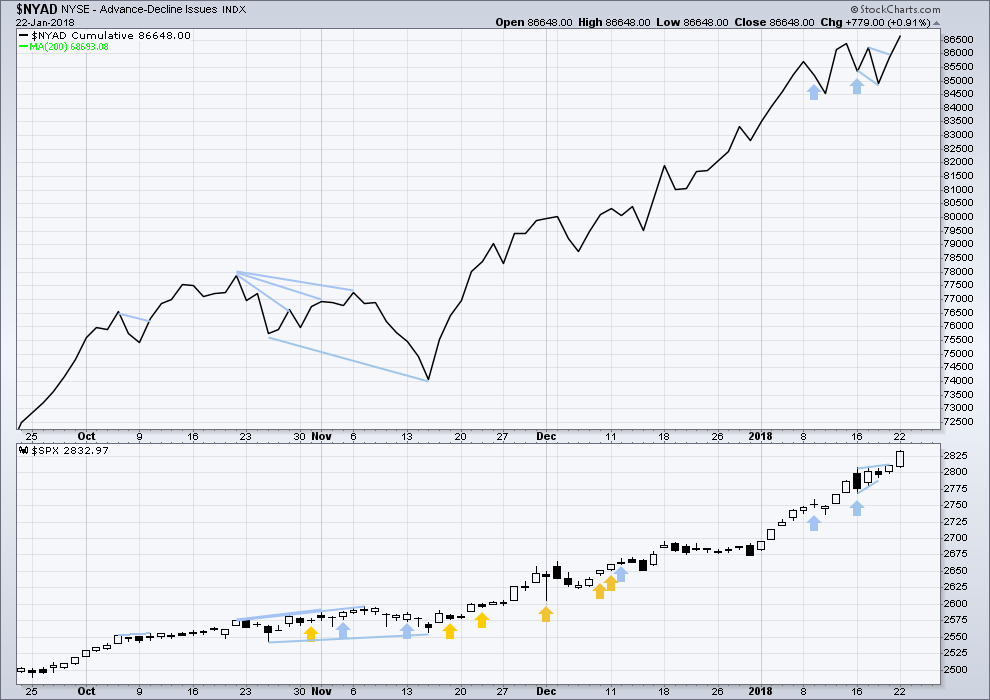
Click chart to enlarge. Chart courtesy of StockCharts.com.
There is normally 4-6 months divergence between price and market breadth prior to a full fledged bear market. This has been so for all major bear markets within the last 90 odd years. With no longer term divergence yet at this point, any decline in price should be expected to be a pullback within an ongoing bull market and not necessarily the start of a bear market.
All of small, mid and large caps last week made new all time highs. This market has good support from rising breadth.
Breadth should be read as a leading indicator.
All recent bearish signals from the AD line have failed. Both price and the AD line have made new all time highs today. The rise in price now has support from rising market breadth. This is bullish.
DOW THEORY
The S&P500, DJIA, DJT and Nasdaq last week all made new all time highs. The ongoing bull market is confirmed.
The following lows need to be exceeded for Dow Theory to confirm the end of the bull market and a change to a bear market:
DJIA: 17,883.56.
DJT: 7,029.41.
S&P500: 2,083.79.
Nasdaq: 5,034.41.
Charts showing each prior major swing low used for Dow Theory are here.
ANALYSIS OF A PRIOR CYCLE DEGREE FIFTH WAVE
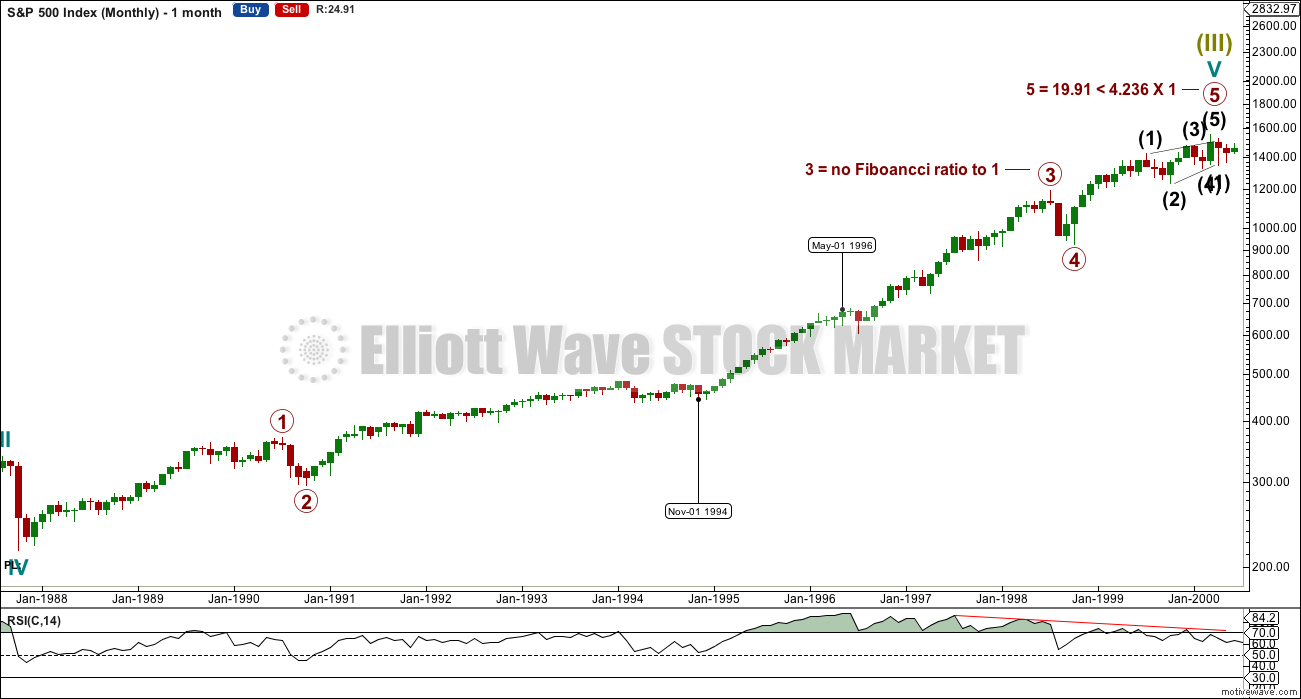
Click chart to enlarge. Chart courtesy of StockCharts.com.
This monthly chart shows a possible wave count for the last cycle degree fifth wave within the Grand Super Cycle analysis.
If this historic and the current wave counts are both correct, then the equivalent position for the current day would be towards the end of the segment delineated by dates December 1994 to May 1996.
The technical analysis chart below looks at this portion of the wave.
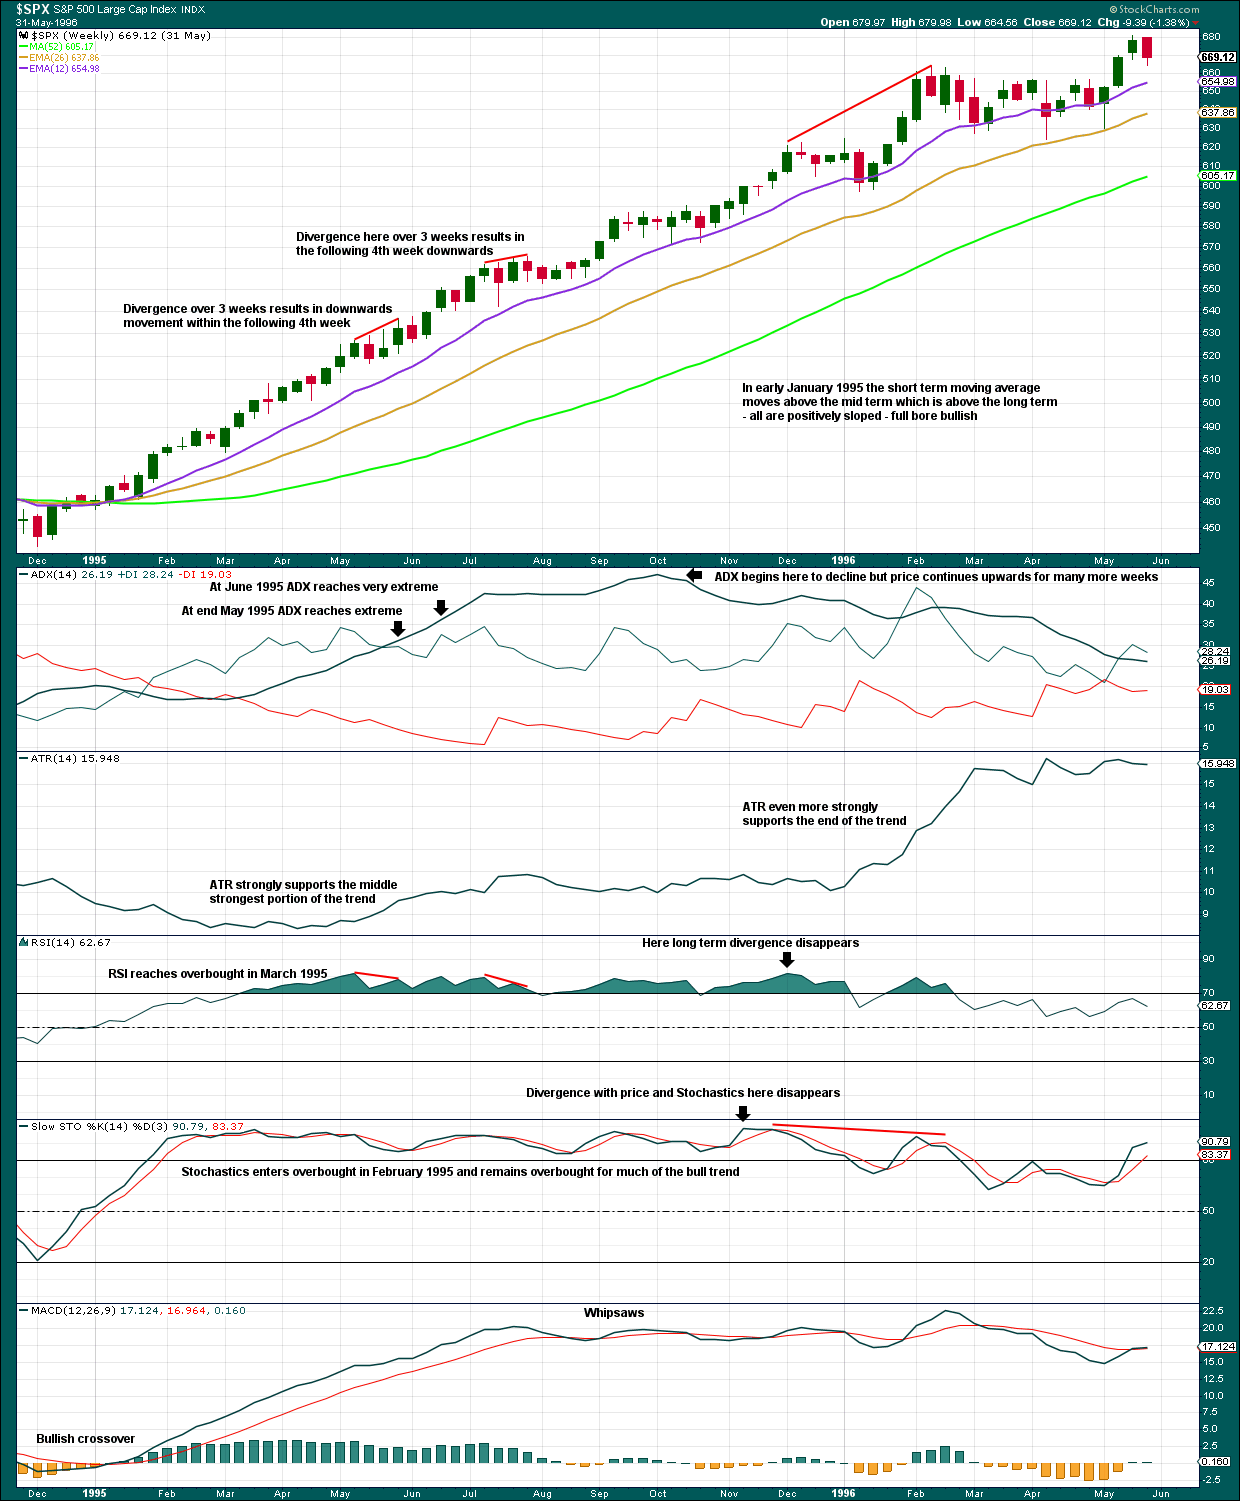
Click chart to enlarge. Chart courtesy of StockCharts.com.
The purpose of this exercise is to see how regularly used indicators behaved in a market which may be a reasonably close equivalent to the current market.
First, it should be noted that on this weekly chart the longest duration for a pullback from an all time high is two weeks. This does look somewhat similar to the current market conditions.
Divergence between RSI and price and Stochastics and price was not always reliable. Sometimes it simply disappeared.
ADX may remain very extreme for several weeks. ADX may even decline from very extreme yet price may continue higher for many more weeks.
When normal volatility returns, MACD may not be a reliable guide to when to enter and exit a market, as it can whipsaw for many weeks while price may continue overall higher.
Putting this next to the current market conditions, it seems clear that overbought and extreme conditions have persisted for long periods in the past when the S&P has a strong bull market. If the Elliott wave count is currently correct at intermediate, primary and cycle degree, then current market conditions may certainly persist for many more weeks.
Published @ 09:51 p.m. EST.
I know one surefire way to bring this rally to a screeching halt. I am selling SPX put spreads tomorrow morning. Feb 2850/2830 for 9.00 (around where they traded today) or as close as I can get. Will cover at 7.50. Breakeven point is 2841, so I should be okay as long as there is at least one round of new ATHs between now and February. If not, then you can all thank me for singlehandedly bringing this generational rally to a close.
My view of the hourly situation; I think we’ve got a final (5) wave here before the circle 4 kicks in, per the chart. (My circle wave #’s use angle brackets on the chart).
New short term picture:
Momentum is showing some increase over yesterday. It if can further increase a little above where it was for the high now labelled micro wave 1 then this wave count would be indicated.
An extending third wave still underway.
This is a third wave folks. That’s why I gave you the extra historic look at an equivalent third wave. And this third wave is still completing at multiple degrees.
I know it’s overbought and extreme and stretched, but the structure is incomplete and as the historic example shows this can remain extreme for much longer.
The new target for subminuette iii will of course mean the target on the daily chart for minute iii is inadequate.
This bull market has no breaks. Every dip is a buying opportunity. Every consolidation is a buying opportunity. All upside targets have been too pessimistic and all downside targets have fallen short. There is only one direction: up.
It’s pretty awesome. The risk is that it breeds complacency, which can be expressed in any number of ways and then result in large red numbers on the positions page. The other risk is being insufficiently aggressive in taking advantage of the strongly uptrending market; it can be argued that these are the times to maximizing, because when churn starts up, it will be far more difficult.
TBT retesting 200 day MA at around 35.62.
A close above is quite bullish and would complete a successful retest to comport with the corresponding break below from above by its inverse counterpart TLT!
Look out for a “shake the trees” move by the market makers who know a lot of traders will be watching the 200 day MA pivot. A move and close above 36.15 settles the matter.
VIX trading comfortably above the lows of those sharp spikes down this morning so the top of those wicks likely to give way the next day or two. I am anticipating a gap past the spike highs….
Potential hammer in TMV and UUP. Looks like I may have to exit TMV short calls FAR sooner than I had planned! Yikes!
TMV needs to close above 19.24 to trigger buy signal…
XIV is surprisingly down relative to the high yesterday, in the 141’s vs. the 145’s. On another strong up day in SPX. Hmmm. It’s either a warning or an opportunity…or both!
Vol keeps bucking the trend with higher lows in the face of higher market highs. So very interesting. It would be bullish to see a close close to or at today’s highs imho…bizarro market! 🙂
Whoa! Didja see that VIX pushback on the five minute chart? Yowza! 🙂
Somebody definitely staring down the short sellers…hyuk!
Hi Lara Im kind of confused by your historic chart above as of today are you suggesting that right now we are at somewhere of May 1 1996? If so then it looks like the market will pull back soon at least 10% before heading higher?
Please advise
Thank You
No, the suggestion is that we are somewhere in the range given on the EW chart which the TA chart covers. About half way through, possibly early in the latter half.
Not yet at the end. Not by a fair way.
Or towards the end maybe of the segment on the EW chart.
Notice please that the segment shown by dates on the EW chart November 1994 to May 1996 is enlarged and this is the whole area shown on the TA chart.
I expect we are in the equivalent of that area.
So notice on the EW chart that was just the middle of the third wave.
Which is the point I am trying to make with publication of those charts. If my wave count currently is correct, we are in the middle portion still of a third wave.
I’m trying to counteract some bearishness out there and here within the membership.
Deep pockets smashing the VIX 11.50 pivot. Now that they have drawn a line in the sand, if the hedge fund cohort is true, look for them to flex some muscle and gap past it with some authority. If that happens, we are headed for the upper B band. If not, we probably tag the lower…
We need a new low in SVXY for a five down…
Come on TMV! Let’s bust that 200 day MA wide open.
Not too many trades with the banksters at a distinct disadvantage.
I think VIX is on the prowl. I would not be at all surprised to gobble up that long upper wick and put a serious daily squeeze an some short sellers…he!he!
XLU has now given multiple “bottom complete” signals. I took some profit on today’s pop and will be reloading at whatever shows up as a low upcoming in the current pullback. I also entered FSLR late yesterday, and it popped high and hard this morning. I aggressively took my profit, regretted it twenty minutes later…and am quite happy with the decision now, as price came ALL the way back to yesterday’s zone. That stock is so aggressively traded and faded, you just have to snipe it I think. Folks might want to look at UL, which strikes me as an exceptional positional long right now, it’s broken out and if you look at the 5 year, there’s serious upside potential for UL. I’ve also been using OIH, which swings in a fairly stable manner, not lots of surprises, and trends like crazy. Lots of quality opportunities out there!
Furious assault on VIX. A close at or above the day’s high would be interesting. Long upper wicks….
My profit take of 9.38 from yesterday got tagged on UVXY, looking to re-enter
Any one here like to cook? I like to cook a little, and I have say, the “instant pot” (a smart pressure cooker/slow cooker/saute combined electrical cooking pot) is INCREDIBLE! I’ve been whipping up curries, stews, soups, even a lasagna last night using it (mostly all in the ipot alone, the lasagna of course took a baking pan as well), and this product just makes it so incredibly easy and FAST. 20 minutes prep, fire up the ipot, and in 20 more minutes, a complete stew! Highly recommended. And now back to trading…gee, look at that SPX go again. Will the main hourly get invalidated? Maybe, maybe….
I LOVE it!!!
Recently we discovered what an awesome flavor enhancer sesame seed oil is in Chinese noodle dishes. We were able to turn out a spectacular version of Mongolian Beef by adding brown sugar and Sesame seed oil to the Soy sauce. Yum!
I’m adding Mongolian Beef (w/sesame oil!) to my list of recipes to try, TY Verne!
Cooking the beef under pressure is going to make it “Oh so tender!!” 🙂
Most welcome!
Yikes! My VIX March calls must have popped this morning; sold for limit price of 2.15. Reopening “stink bid” for 1.80….
TMV has now been rejected at the 200 day sma three times despite TLT’s break below its own. Just in case we get a gap down ahead of a TMV fourth attempt, I am going to try and get positioned via a March 18.0/19.0 bear call credit spread for credit of 0.45 per contract. Will close short call on back test of 200 day sma; risk is 100.00 per spread of 50 contracts. A very conservative trade.
I like to get my Copper searing pan smoking (literally!) hot and toss the seasoned and thinly sliced beef on there for a few seconds! 🙂
TLT has broken 200 day sma with a successful back test. Few people are paying attention to interest rates. Still waiting for TMV to breach and back-test 200 day sma to the upside. It has long been my thesis that the destiny of the stock market lies with the substantially larger bond market. If the yield curve inverts….well, you know the drill…! 😉
Do you really think interest rates on 20 year Tbonds are going to be dropping over the next several months? Yes, the curve may be flattening, but aren’t rates rising (generally) all across the curve? I’m trading the uptrend line in TBT that started with the low on Dec 15, under the general theory that 20 year Tbonds interest rates will be rising. So far, so good, but your bullishness in TLT has me mildly concerned. I can see TLT for swing trades here, but I can’t see it for positional trades. Am I missing something?
The curve can STILL flatten with rising rates amigo! 🙂
Yes it can still flatten and may flatten.
I will repeat again… You will know rising rates longer term rates are here to stay when the 30 Year US Treasure breaks above a 3.26% Yield and when that occurs accelerates higher.
Unless and until that occurs… the yield curve may get as flat as the Midwest in America!
Actually, BEARISH on TLT after it broke and back tested 200 day sma… 😉
Ahhhhh…that clears things up, thanks. Working TBT this year is part of my broader strategic plan, so ya had me wondering there.
TBT is money lying in the corner if rates keep heading up. I plan to juice that trade a bit with TMV. 🙂
Buying March NFLX 260 puts for 16.95. Those puppies are pricey! Small contingent of 5 contracts. 🙂
You are one awesome contrarian!!! Best of luck Verne.
I can’t help myself with all that cavorting above the upper B band..lol!
NFLX is SO broke it ain’t funny! 🙂
SPX high 2939.17. A point below the “invalidation” of the wave count. The magic of quality EW analysis!! Time for some kind of small 4. Whew. That was one extraordinary heck of a run up. Ain’t January been crazy!! If this is the green iv here (???), then the green ii matching was 8 sessions long. Hmmm. Time for patience, as long as price stays below this morning’s high. I’m suspicious though! Gotta be in this insane bull market.
Pre-market is already at 2840 plus so with likely bullish coming from NFLX (up $20 more per market). I am looking at a new ATH..
One of the things I am interested to see with this comparisons is what happens to earnings multiples down the road. P/Es of various kinds are all exploding upwards in ways typically representative of blow off tops. The period 1987-1995 looks absolutely nothing like the period 2009-2018 from a valuation perspective. I know this is irrelevant from the perspective of the technical charts, but it does seem to suggest we could see some utterly ludicrous P/Es as we near the top.
By the way, for those keeping score, Hang Seng is currently up another 1.5%. The index has gained over 4,700 points (28,200 to 32,900) since December 6! It’s been green something like 19 of the last 20 sessions (including 14 in a row). An absolutely mind-blowing move.
Earnings will soar as tax cuts kick in, and that will dramatically lower PE’s from where they would otherwise end up.
Lara thank you for the extra comparative historical analysis. Quite illuminating!
You’re welcome 🙂 It was a good and necessary exercise I think
Got it!