
Upwards movement continued for Friday to another new all time high as the main Elliott wave count expected.
Summary: Assume the upwards trend may remain intact and the next target for an interruption is at 2,821.
An alternate looks at a correction or pullback underway to last one to two weeks. Some confidence may be had in this view if price makes a new low below 2,792.56. This view has support still from bearish signals in VIX and the AD line.
The biggest picture, Grand Super Cycle analysis, is here.
Last historic analysis with monthly charts is here. Video is here.
MAIN ELLIOTT WAVE COUNT
WEEKLY CHART
Click chart to enlarge.
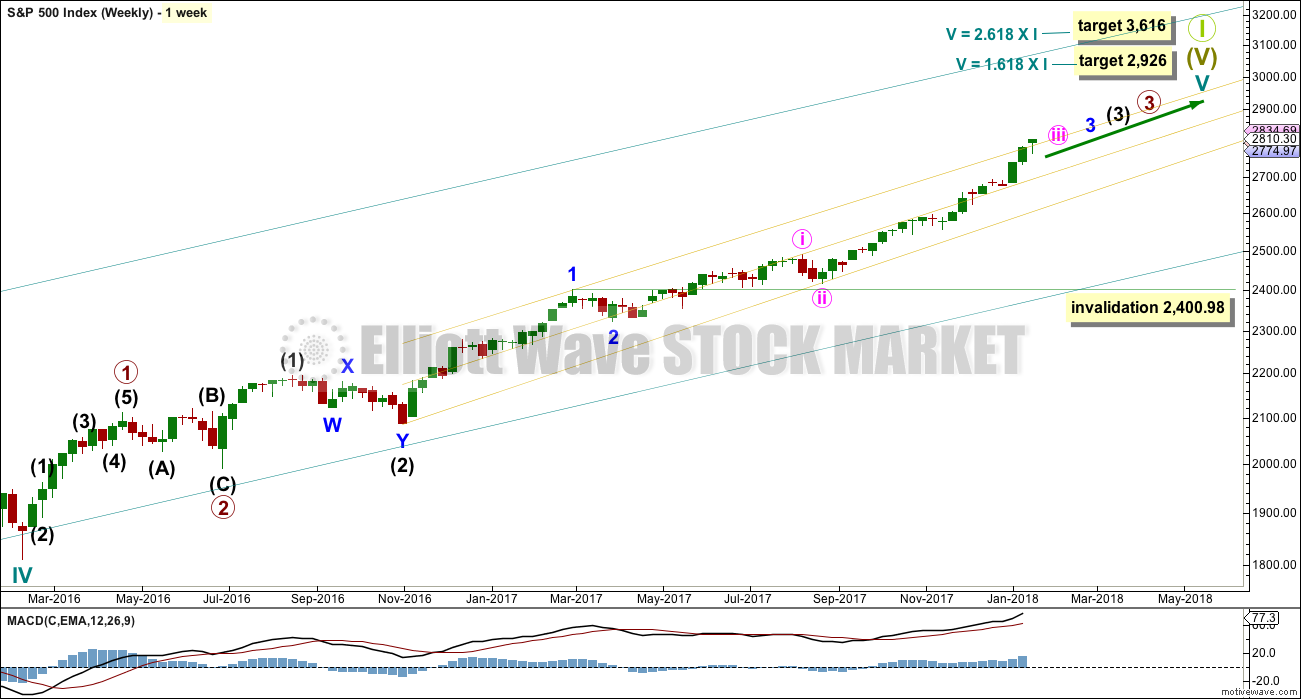
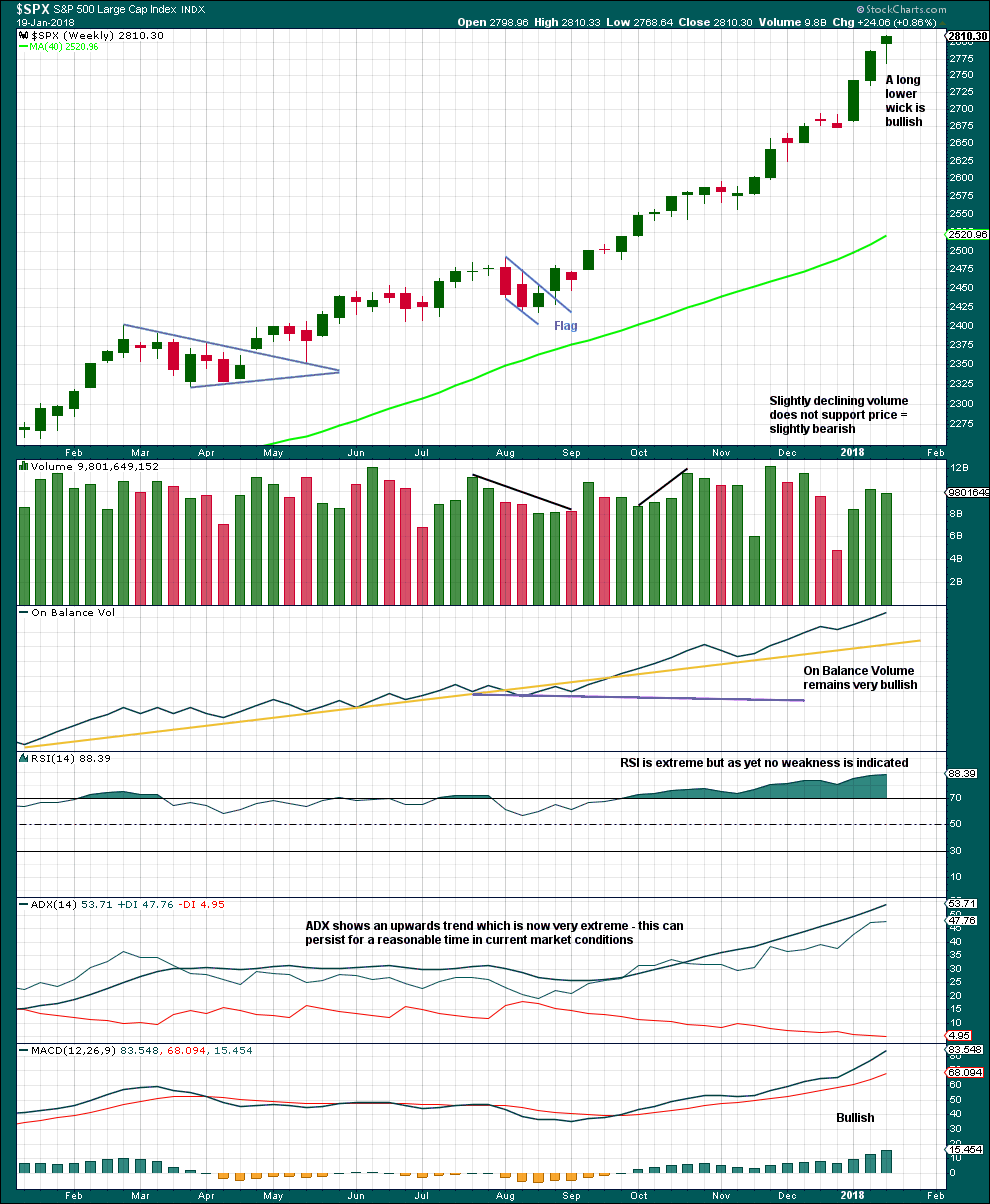
Cycle wave V must complete as a five structure, which should look clear at the weekly chart level. It may only be an impulse or ending diagonal. At this stage, it is clear it is an impulse.
Within cycle wave V, the third waves at all degrees may only subdivide as impulses.
Within cycle wave V, the corrections for primary wave 2 and intermediate wave (2) both show up clearly, both lasting several weeks. The respective corrections for intermediate wave (4) and primary wave 4 should also last several weeks, so that they show up at weekly and monthly time frames. The right proportions between second and fourth wave corrections give a wave count the right look. This wave count expects to see two large multi week corrections coming up.
Cycle wave V has passed equality in length with cycle wave I, which would be the most common Fibonacci ratio for it to have exhibited. The next most common Fibonacci ratio would be 1.618 the length of cycle wave I.
Intermediate wave (3) has passed equality in length with intermediate wave (1). It has also now passed both 1.618 and 2.618 the length of intermediate wave (1), so it may not exhibit a Fibonacci ratio to intermediate wave (1). The target calculation for intermediate wave (3) to end may have to be done at minor degree; when minor waves 3 and 4 are complete, then a target may be calculated for intermediate wave (3) to end. That cannot be done yet.
When minor wave 3 is complete, then the following multi week correction for minor wave 4 may not move into minor wave 1 price territory below 2,400.98. Minor wave 4 should last about four weeks to be in proportion to minor wave 2. It may last about a Fibonacci three, five or even eight weeks if it is a time consuming sideways correction like a triangle or combination. It may now find support about the mid line of the yellow best fit channel. If it does find support there, it may be very shallow. Next support would be about the lower edge of the channel.
A third wave up at four degrees may be completing. This should be expected to show some internal strength and extreme indicators, which is exactly what is happening.
DAILY CHART
Click chart to enlarge.
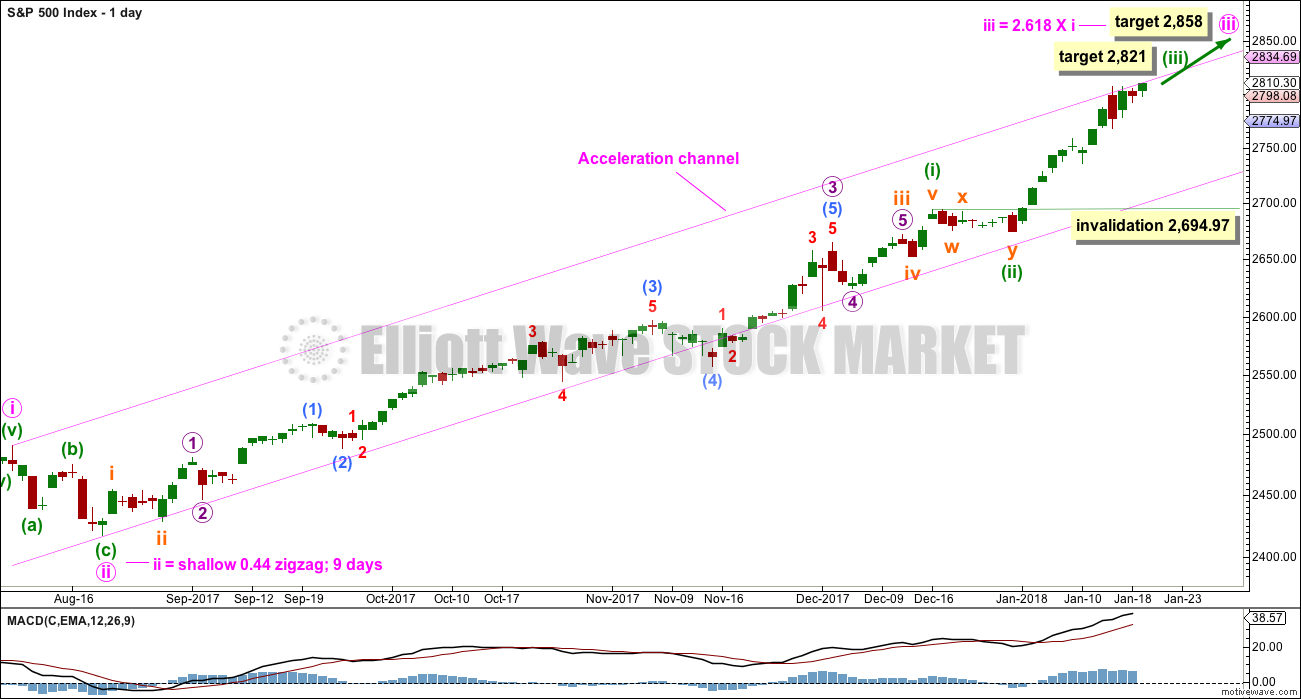
Keep redrawing the acceleration channel as price continues higher: draw the first line from the end of minute wave i to the last high, then place a parallel copy on the end of minute wave ii. When minute wave iii is complete, this would be an Elliott channel and the lower edge may provide support for minute wave iv.
Minute wave iii has passed 1.618 the length of minute wave i. The next Fibonacci ratio in the sequence is used to calculate a target for it to end.
Minute wave iii may only subdivide as an impulse, and within it minuette wave (i) only may have recently ended as a long extension. This main wave count fits with MACD: upwards momentum is showing an increase as a third wave continues upwards.
Within the impulse of minute wave iii, the upcoming correction for minuette wave (iv) may not move back into minuette wave (i) price territory below 2,694.97.
Because minuette wave (i) with this wave count is a long extension, it is reasonable to expect minuette wave (iii) may only reach equality in length with minuette wave (i). This target fits with the higher target for minute wave iii one degree higher.
HOURLY CHART
Click chart to enlarge.
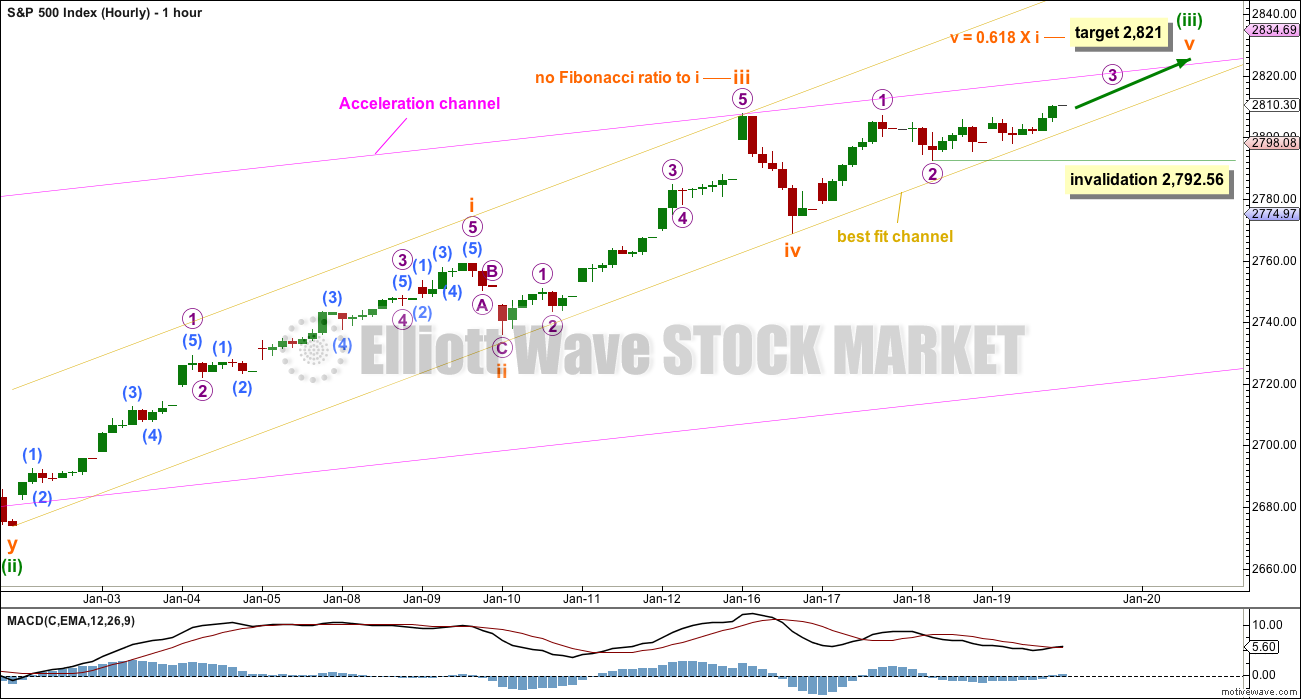
Always assume that the trend remains the same until proven otherwise. At this stage, there is no technical evidence for a trend change; we should assume the trend remains upwards.
Subminuette wave iii is shorter than subminuette wave i. This limits subminuette wave v to no longer than equality in length with subminuette wave iii at 2,840.12, so that subminuette wave iii is not the shortest and the core Elliott wave rule is met.
The structure is incomplete within subminuette wave v, which needs to complete as a five wave structure, either an impulse or an ending diagonal. At this stage, it looks like an incomplete impulse.
The slope of upwards movement may now be reducing as the structure of a fifth wave comes to an end.
Minuette wave (ii) was a very shallow combination lasting eight days. Minuette wave (iv) may also last about a Fibonacci eight days.
ALTERNATE DAILY CHART
Click chart to enlarge.
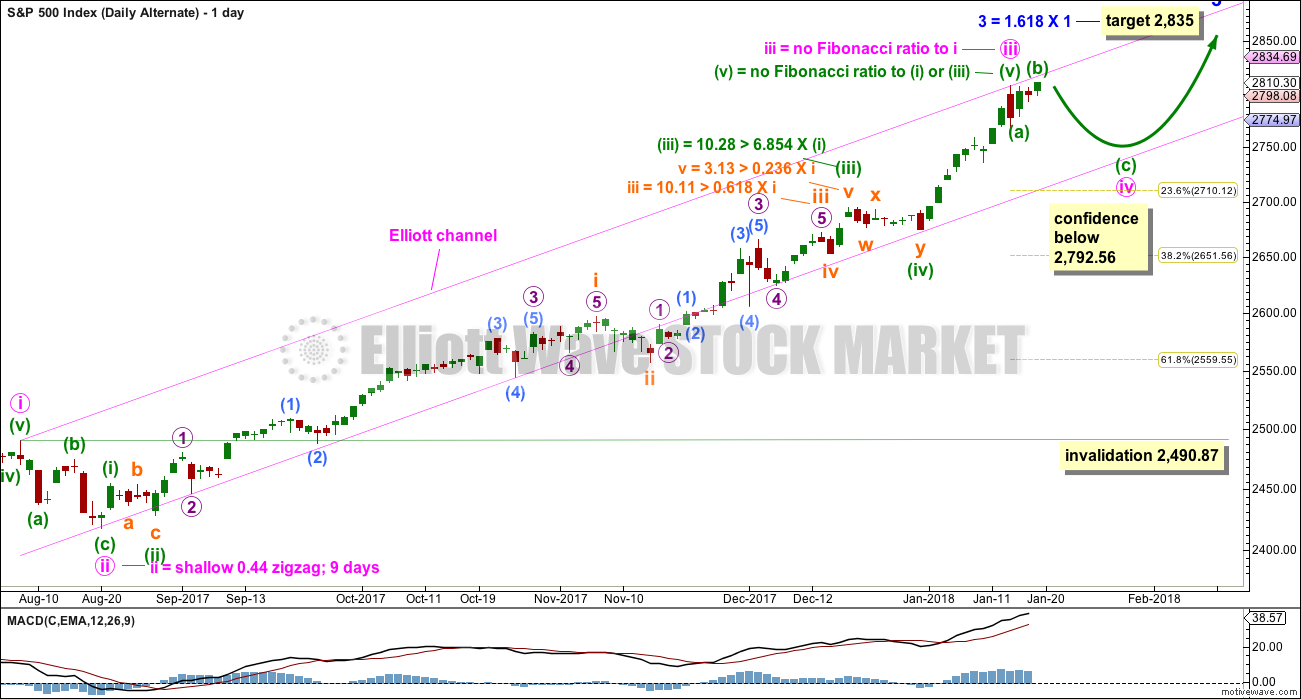
It is possible that minute wave iii is over. Some confidence in this wave count may be had if the main hourly wave count above is invalidated with a new low below 2,768.64.
If minute wave iv is underway, then it may be expected to be reasonably in proportion to its counterpart minute wave ii correction. Minute wave ii lasted nine days, so expect minute wave iv to last a Fibonacci eight or thirteen days.
Minute wave iv may be unfolding as an expanded flat correction. These are very common structures.
Minute wave ii was a zigzag, so minute wave iv may exhibit alternation as a flat, combination or triangle. These corrections are all sideways and usually more time consuming than zigzags.
Minute wave iv may end when it finds support about the lower edge of the pink Elliott channel. If it does not end there and if it overshoots the channel, then minute wave iv may end within the price territory of the fourth wave of one lesser degree. Minuette wave (iv) has its territory from 2,694.97 to 2,673.61.
Minute wave iv may not move into minute wave i price territory below 2,490.87.
TECHNICAL ANALYSIS
WEEKLY CHART
Click chart to enlarge. Chart courtesy of StockCharts.com.
This upwards trend is extreme and stretched, but there is still no evidence of weakness at the weekly time frame.
As a third wave at multiple degrees comes to an end, it would be reasonable to see indicators at extreme levels.
A correction will come, but it looks like it may not be here yet.
DAILY CHART
Click chart to enlarge. Chart courtesy of StockCharts.com.
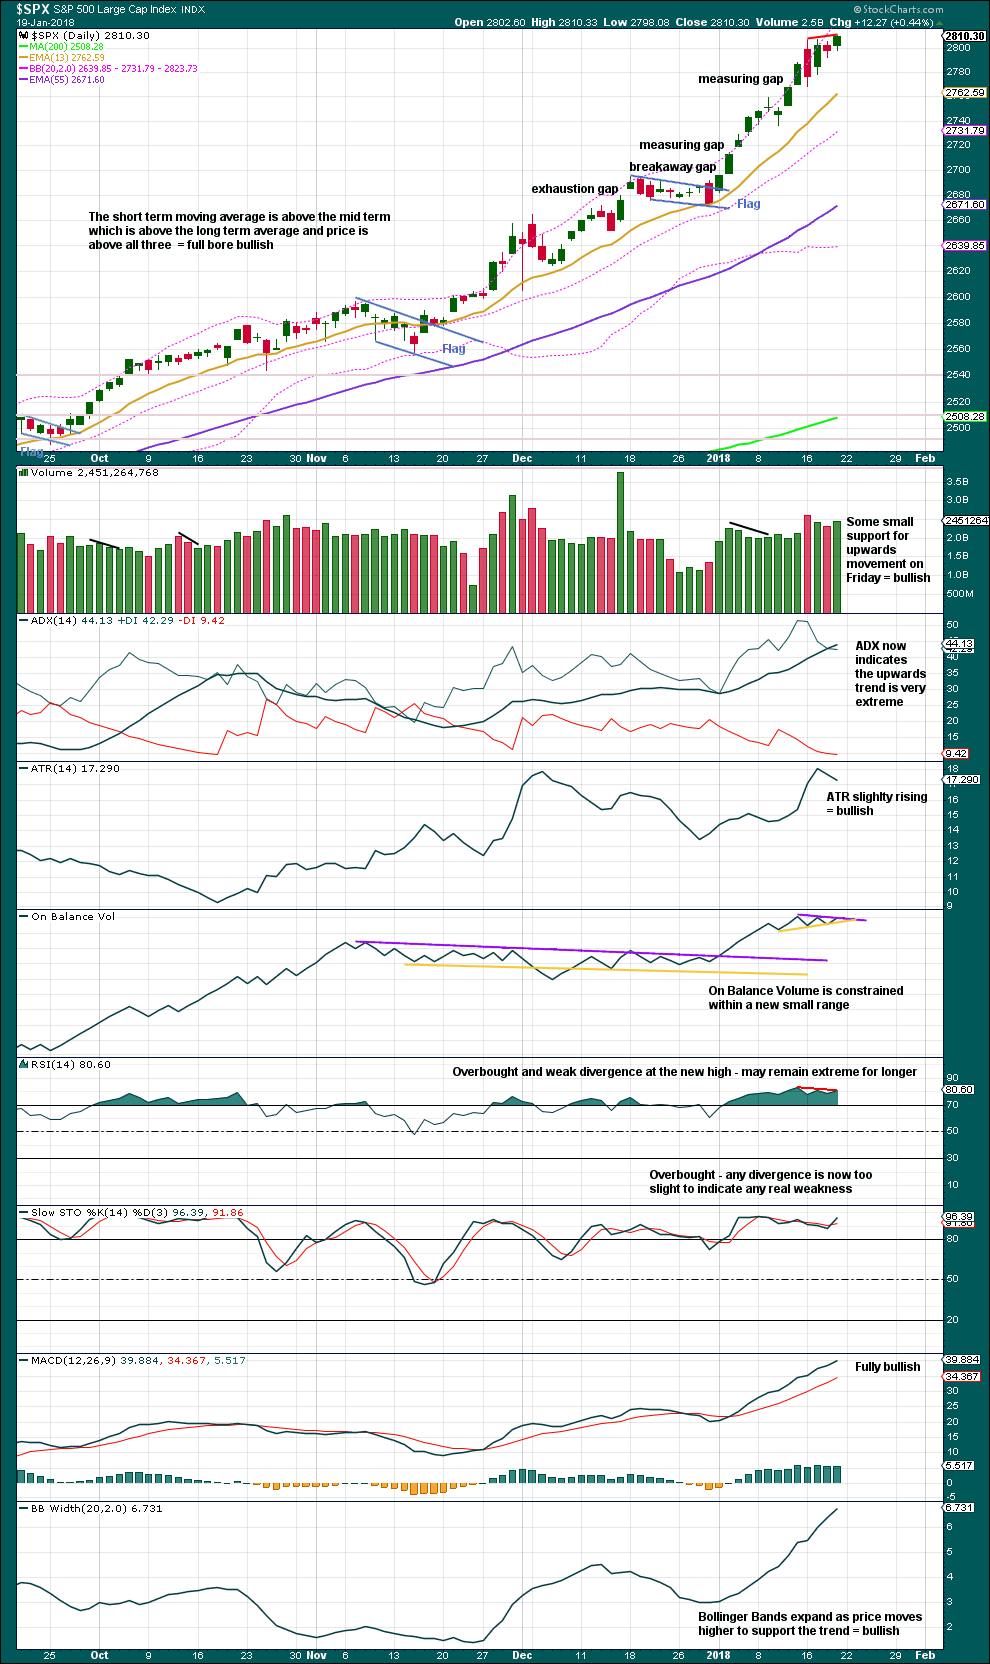
On Balance Volume has not yet broken out of its small range. This should happen on Monday.
The trend is stretched and extreme at daily and weekly chart levels, and close to extreme at the monthly chart level.
Divergence with price and RSI is too slight to indicate reasonable weakness.
This trend may still continue for longer.
VOLATILITY – INVERTED VIX CHART
Click chart to enlarge. Chart courtesy of StockCharts.com.
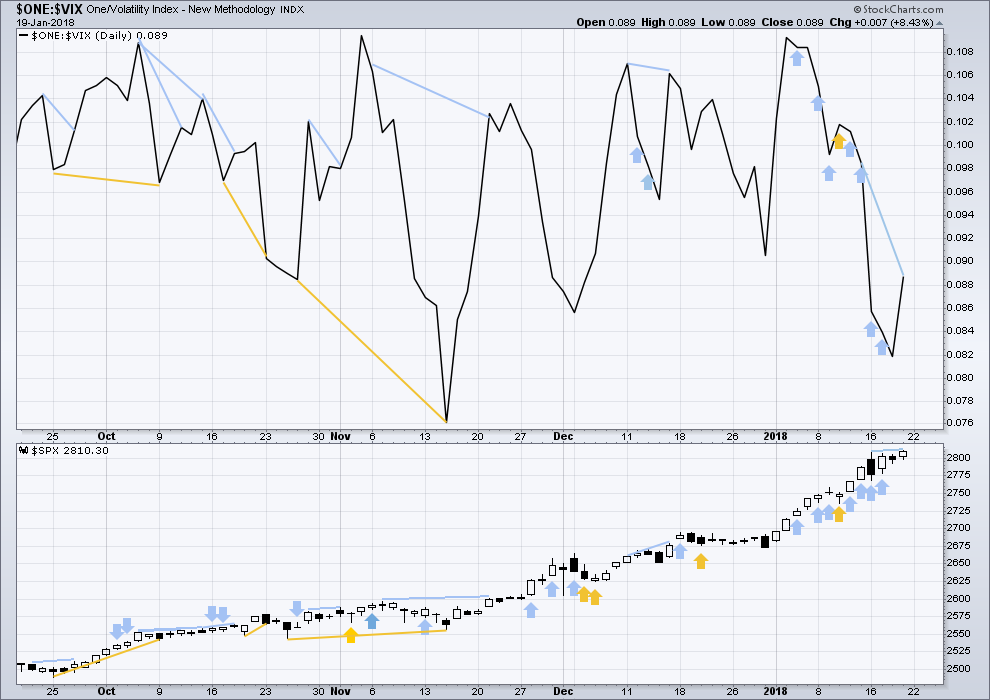
So that colour blind members are included, bearish signals will be noted with blue and bullish signals with yellow.
Normally, volatility should decline as price moves higher and increase as price moves lower. This means that normally inverted VIX should move in the same direction as price.
Bearish signals from VIX have not been followed by any downwards movement. They may have all failed, or it could be that these signals are early.
There is strong short term divergence between price and inverted VIX. The new high in price has not come with a normal corresponding decline in market volatility. This is bearish.
BREADTH – AD LINE
Click chart to enlarge. Chart courtesy of StockCharts.com.
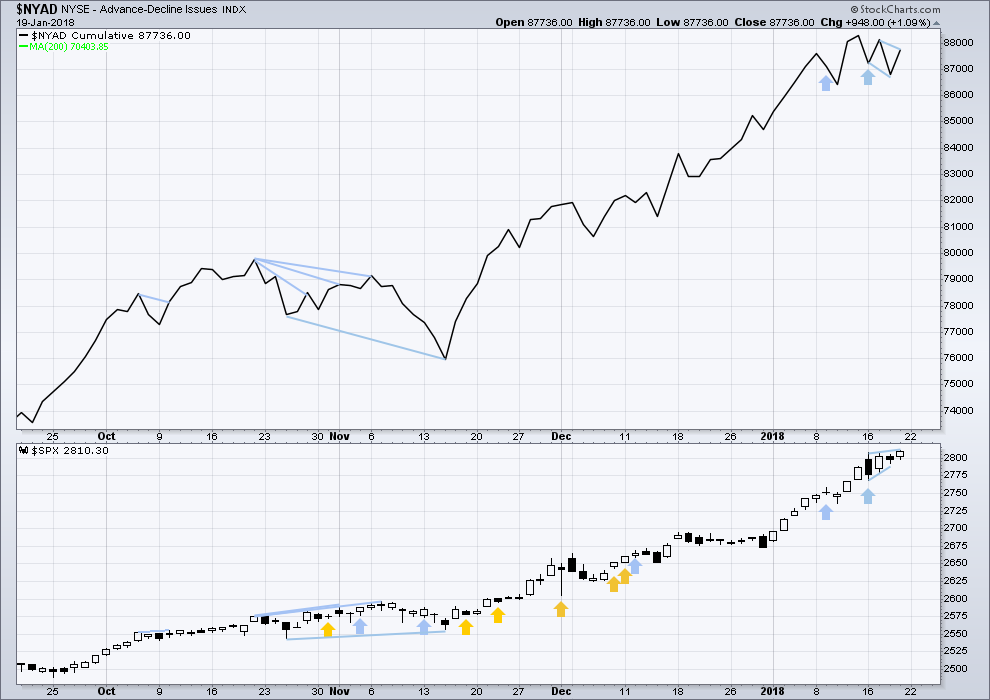
There is normally 4-6 months divergence between price and market breadth prior to a full fledged bear market. This has been so for all major bear markets within the last 90 odd years. With no longer term divergence yet at this point, any decline in price should be expected to be a pullback within an ongoing bull market and not necessarily the start of a bear market.
All of small, mid and large caps last week made new all time highs. This market has good support from rising breadth.
Breadth should be read as a leading indicator.
The last bearish signal from the AD line has not been followed by any downwards movement. It may have failed, or it may be an early warning.
There is now divergence with the new high in price failing to be matched by a new high in market breadth. The rise in price does not have support from a rising AD line. This is bearish.
DOW THEORY
The S&P500, DJIA, DJT and Nasdaq last week all made new all time highs. The ongoing bull market is confirmed.
The following lows need to be exceeded for Dow Theory to confirm the end of the bull market and a change to a bear market:
DJIA: 17,883.56.
DJT: 7,029.41.
S&P500: 2,083.79.
Nasdaq: 5,034.41.
Charts showing each prior major swing low used for Dow Theory are here.
Published @ 05:39 p.m. EST on 20th January, 2018.
Currently working on today’s analysis, which will have some extra analysis, which is why the analysis is taking a bit longer to complete. Thank you for your patience!
NFLX closed $227 after hours now showing bid $246…
The frantic buying we are seeing absent anything resembling a selloff is unprecedented. It seems we are on the verge of the most glorious melt-up the world has ever seen. SPX 10,000 is perhaps not as ludicrous as people make it sound. If this is the type of panic buying we get at all time highs, imagine the type of panic buying that will ensue if the market ever dips 5%. If downward momentum shows even a hint of weakness, we’ll smash through to all time highs. Nobody seems to mention that thats how the 2000 top played out.
Of course, there is also the possibility that the market will do something it has never done before.
This is why I’m advising members to watch this week’s video by Chris Ciovacco.
He directly addresses the “blow off top” or “final melt up” scenario.
In short, this current chart does not look like prior major market highs. It looks more like a strong trend which will continue for quite some time.
But yeah, I agree, we must accept that the market may possibly do something it’s never done in recent history.
Oh I definitely agree. I am just pointing out two assumptions that Ciovacco is making:
1) We expect the melt-up phase of this market to resemble that of others
2) We are not in the melt-up phase
(2) follows from (1) according to Ciovacco’s analysis. This means that as we approach the melt-up, we should expect to see volatility increase dramatically. For instance, the S&P dipped from 1190 in July 1998 to 923 in October 1998. The March 2000 top ended up being 1552. If we are to expect similar moves before this bull market is over, then we are looking at the possibility that the market could rise 50-100% from here, meaning SPX 4,000-6,000 and Dow 40,000-60,000 are very much in play.
I am not saying these types of moves are impossible, but I do think Ciovacco’s approach is overly simplistic. Years like 2009 and 2003 came on the heels of two of the most catastrophic bear markets in decades. 1991 and 1994 also came after fairly poor years in 1990 and 1994. But the back end of 2016 and all of 2017 were incredibly strong. So this really isn’t something we’ve seen before. This is how the market acts after a dip, not after an 18+ month period of consistent ATHs.
So at the end of the day, I think we either have to be ready for the possibility that this market could blast through all the upper wave count projections (2900 no way and 3600 still far too pessimistic) on the way to a more traditional blow off top, OR the possibility that we could get a sudden, unpredictable, precipitous crash a la 1987.
My target 2,821 was inadequate 🙁
Anyway, it’s a target for an interruption which is minor. It may last about two weeks, but that is the kind of volatility to ignore if you’re buying and holding. Which is probably the best approach to this market at this time.
If the limit at 2,840.12 is passed then my labelling of minuette wave (iii) is wrong. I would have to revert to seeing subminuette iii extending, and incomplete. This would be very bullish.
I’ll consider publishing that idea as an alternate again today, but at this point in time it would have a lower probability as MACD indicates waning momentum (at the hourly time frame).
That could change though. That divergence at low time frames is quite simply unreliable.
The slope is increasing. The yellow best fit double channel on the weekly chart has been breached to the upside and the upper edge is now offering support.
This is a third wave. Time to enter and hang on. Not time to be in and out IMO.
I highly recommend Chris Ciovacco’s video this week.
When he presents those charts in the beginning and starts to group them, I look at them and see third waves for the strong ones, and the ends of impulses for the weaker ones (with fourth and fifth waves).
His conclusions on this market are it’s very bullish. I’m giving it 1-3 years, he gives it possibly even longer.
Ciovacco’s video’s are good but he overlooks some of the more extreme indicators out there when making comparisons to e.g. 1993, 1997, 2004. I don’t think this portends an imminent crash, but it’s just something worth considering. I agree there are at least 1-3 years for this market and perhaps longer. But the volatility and momentum extremes we are seeing are difficult to rationalize in this environment. Presumably there will be an uptick in volatility and a decrease in momentum as in those previous eras. Meaning the skies are not 100% clear.
I agree. I wish he’d looked at RSI and ADX for example.
The video was refreshing and a good perspective. It’s not hard to see how the expected upcoming sequence of 4’s and 5’s will shift the market from the current “steady up” with low volatility to a much more dynamic and higher volatility grinding bull ala the “topping charts” he showed. So I view his assessment as 100% compatible with our larger time frame wave counts and expectations.
That’s exactly how I saw it as well.
Buying VIX March 11.50 strike calls for1.85….
Back into FEB-Aprils, and buying UVXY 8.90, target 9.38 for day
Strange! As VIX moved lower, March 11.50 calls saw higher bids, now at 11.95…I guess no lowering cost basis today….rats!
I continue to be amazed by occurrences that have absolutely no historical precedent; like the bids on VIX calls. With more than 50% of the SPX trading greater than a 200 multiple; to put that in perspective-the investor must be complicit and willing to wait 200 years for return of principle, conceptually of course. While there is likely continued upside and long profits available left, no one of sound mind and strategy would be recommending long exposure on anything other than ether, momentum and FOMO. I remain in shock and will continue to only trade scalps.
Me too. I have been using Lara’s target to scalp the upside march. I for one have decided to avoid overnight exposure to this market for the reasons you cite and a few more…closing bullish put spreads opened in the morning by the close….will switch to call spreads on the coming correction. I expect VIX should head back above 12 the next day or two as we approach an interim top of the third.
The standard deviation between price and fundamentals is the most stretched in history. Not one bear, margin loans, consumer credit etc…..autos, construction spending, defaults are already in bear markets, possible bonds soon, and the fact that all parabolic curves have a parabolic retrace and no one cares!!! It’s mind boggling; silly humans never learn.
Today marks the longest period of time in history where the s & p 500 has not done a 5% correction. Any thoughts
Thanks
It’s a strong third wave would be my thoughts on that.
The next key decision point is at 2831, where micro wave 3 (purple circle waves on the hourly main) is the length of micro wave 1, AND the 1.62% extension of micro wave 1 sits.
Kevin,
With leaders earnings around the corner, I am expecting more fuel to the buying force. We shall see 2900 sooner than later given the new money and buying that will come into the market.
It certainly looks that way! The market is on fire. But I will lay odds that the 5 wave finishes before 2840.
I guess the VIX (falling) is indicating the minuette 3 isn’t complete. I have a short on via SPXU betting that minuette 3 is complete, with a simple and close stop (SPX back to new high). The reward side is many multiples larger than the risk side, but I’d give the risk side 2-1 odds vs the reward side (at least?), so it’s got positive EV but not as large as it might appear. I don’t like that the VIX isn’t behaving in a way that “supports” my position. It’s been a good day for me so far, and the minuette 4 kicking in here strongly would make things even bettah.
Yup…I closed by SPXU position shortly after my lost post, the VIX action just looked wrong to me. And sure enough, here she blows again! And all in the face of complete dysfunction/shutdown in DC. Wild!! The bull no care!
Weeeeee!!!! Nothing like main wave counts that are spot on, look at that minute 3 rip. Lara has a 2921 target, I have a 1.27% extension around 2918, so somewhere in that range is where I’ll be looking for indications of a turn and start profit taking, anticipating the minute 4 just ahead.
Oops, my bad, SPX has hit the target for minuette 3, not minute 3, and it’s minuette 4 that is due here. Minuette 2 was about 8 days long, giving us a sense of what to expect time-wise for minuette 4. There is lots of room “below” for minuette 4 with the invalidation all the way down at 2694, and if it goes even half that distance the brewhaha about “market top” will be deafening…and wrong.
Nice Lara, what’s you’re target for intermediate 4? And then do you have a bear market target assuming a top around 3000? Got some long lines today, you would have had fun on the longboard!!
I can’t calculate a target for intermediate (4) until it begins. If I don’t know where it starts I can’t calculate where it might end.
But I will say that the big teal channel on the monthly chart should provide strong support for both intermediate (4) and primary 4, when they arrive.
But they’re still a while away. Intermediate (3) still has to complete. So the wave count sees this still in a third wave up.
Nice re the surf. Down here we haven’t had anything for over 2 weeks now. Getting rather unhappy with that sad state of affairs…
Be very careful. The failure of the AD line and the McClellan Oscillator ($NYMO) on the daily charts is significant. I am giving these two indicators significant weight.
Is the bird just about ready to put in the oven? Is the goose cooked?
I see it as a time to both be long and time to be very cautious. One commentator used the term “exponential” for what the SPX has been doing recently. He didn’t say “blow off top” but when you look at the weekly, it has that look for sure. But I’m going to trust the wave counts on the main/bull side until we start seeing some invalidations. Then I’ll run for cover at the very least.
With the minute 4 approaching per the main, I would suspect we’ll get a slow down in momentum first, some kind of topping action with some sideways small to moderate range days, signaling the start of what should be a bit larger 4 than recents.
I like the short gold set up, and will be working that one hard on a break below recent lows, via aggressive acquisition of GLL. THANK YOU LARA for the public gold analysis, very timely!!
And I’m finally in the black in TBT. Took awhile. Patience is a virtue at times.
So I say no Rodney, the goose isn’t cooked. But larger and deep wave 4 probes into the goose are coming fast and it’ll be different than 2017. But in the bigger picture, as Lara said, this market has at least a year to go to the upside, and maybe a lot more (because it’ll become slower, with more wave 4 grinding).
The RUT, looking at Lara’s Dec analysis and more current action, is in a wave 3 of 5 of 5 it would appear, and is approaching an overall major top. I’d guestimate that based on this 5 wave in progress on the daily chart starting 8/17, the overall top is still a minimum of 4 months away, and probably 6-8 months. Wave 2 was almost 2 months long and there needs to be a corresponding wave 4, then a final 5 to complete the larger structures. That may be minor 4 or primary 4 time in SPX, I’d guess. But in the short term, I’d expect the impending intermediate (4) in RUT to align with the minute 4 in SPX due anytime as well. These coming 4’s should set up more excellent opportunities for quality longs across the equity board. In the very short term, I’m staying away from RUT awaiting the (4) to start and play out.
As an aside, my real time “confirmation? continuation?” calls in RUT all worked brilliantly. Too bad I didn’t buy and hold all of them! Learning to trust analysis and make the play is part of the education process I guess.
Some macro-economic forces are starting to kick in and some nice mid to long term trades are setting up. One of them is rising interest rates. Contrary to popular belief, the FED follows the market and not the other way around.
I am looking for TMV to clear its 200 day sma with a back test and will open a pretty big position in my long term account.
The Dollar is also close to a bottom and we should have one more move down to complete a fifth wave before it charges on to new highs in the coming deflationary depression. I have been scaling into bearish call spreads on the way down, out six months and that has been working very well so far.
For traders with a low risk appetite, these are great set-it-an-forget-it trades that allow you to be “gone fishin’!” 🙂
Goodie, Goodie, Gookie.
I get the cookie!
Take that you nasty wabbit.
I was snowed in Doc!