The classic technical analysis target was 2,801. This was met with the gap higher today to a new all time high at 2,807.54.
Summary: The AD line and VIX today indicate a downwards day tomorrow.
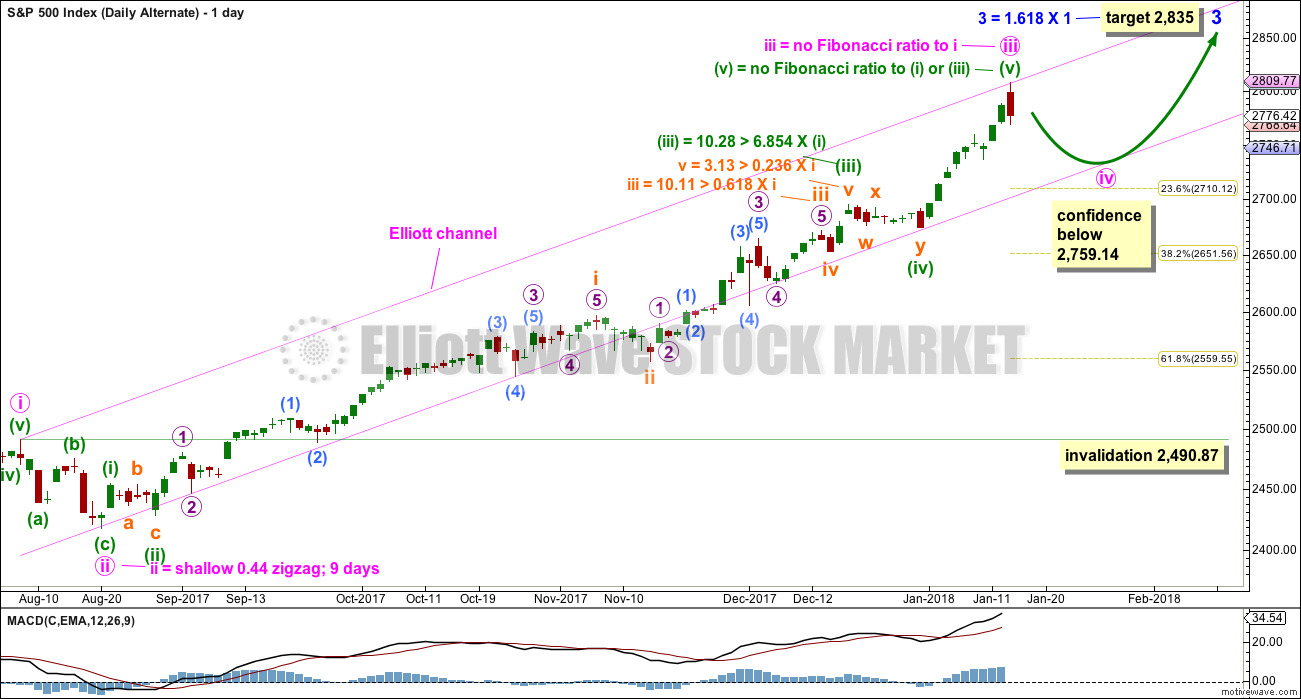
A new daily alternate looks at a possible one to two week correction beginning here. This alternate may have confidence if price makes a new low below 2,759.14.
Accept there is no confidence yet in a trend change while price remains above 2,759.14 and within the base channel on the hourly chart. Assume the upwards trend may remain intact and the next target for an interruption is at 2,845.
The biggest picture, Grand Super Cycle analysis, is here.
Last historic analysis with monthly charts is here. Video is here.
MAIN ELLIOTT WAVE COUNT
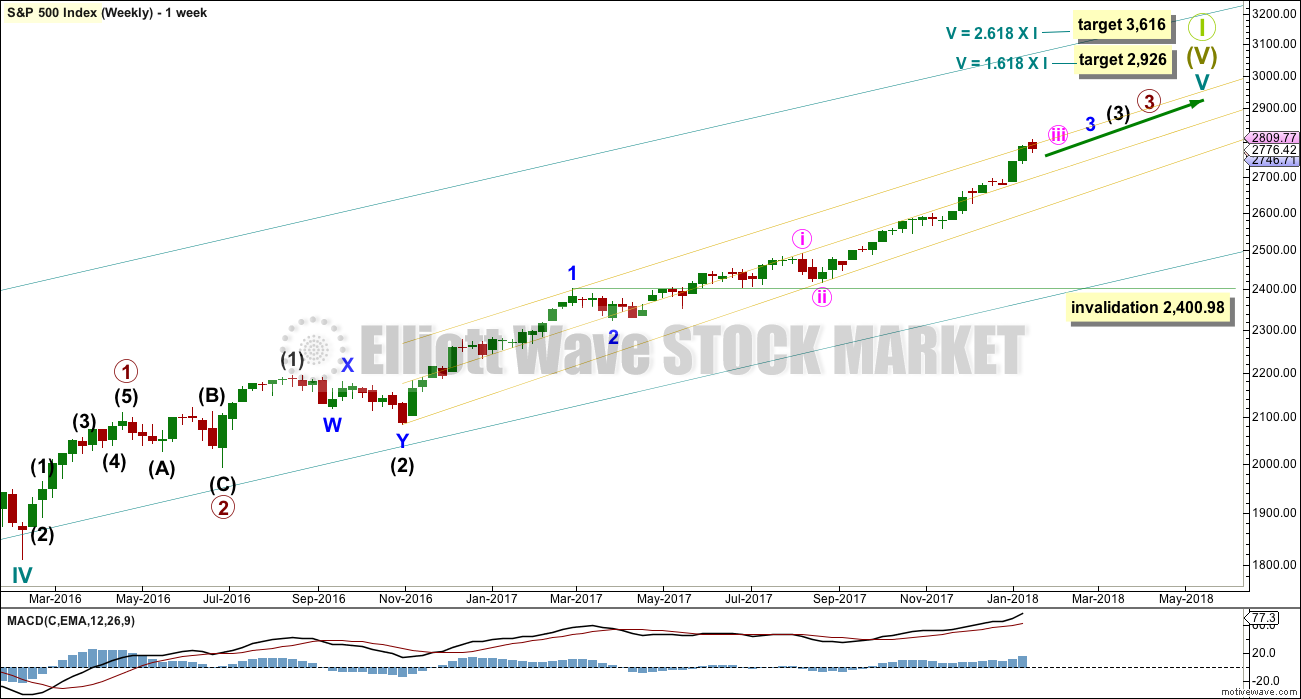
WEEKLY CHART
Cycle wave V must complete as a five structure, which should look clear at the weekly chart level. It may only be an impulse or ending diagonal. At this stage, it is clear it is an impulse.
Within cycle wave V, the third waves at all degrees may only subdivide as impulses.
Within cycle wave V, the corrections for primary wave 2 and intermediate wave (2) both show up clearly, both lasting several weeks. The respective corrections for intermediate wave (4) and primary wave 4 should also last several weeks, so that they show up at weekly and monthly time frames. The right proportions between second and fourth wave corrections give a wave count the right look. This wave count expects to see two large multi week corrections coming up.
Cycle wave V has passed equality in length with cycle wave I, which would be the most common Fibonacci ratio for it to have exhibited. The next most common Fibonacci ratio would be 1.618 the length of cycle wave I.
Intermediate wave (3) has passed equality in length with intermediate wave (1). It has also now passed both 1.618 and 2.618 the length of intermediate wave (1), so it may not exhibit a Fibonacci ratio to intermediate wave (1). The target calculation for intermediate wave (3) to end may have to be done at minor degree; when minor waves 3 and 4 are complete, then a target may be calculated for intermediate wave (3) to end. That cannot be done yet.
When minor wave 3 is complete, then the following multi week correction for minor wave 4 may not move into minor wave 1 price territory below 2,400.98. Minor wave 4 should last about four weeks to be in proportion to minor wave 2. It may last about a Fibonacci three, five or even eight weeks if it is a time consuming sideways correction like a triangle or combination. It may now find support about the mid line of the yellow best fit channel. If it does find support there, it may be very shallow. Next support would be about the lower edge of the channel.
A third wave up at four degrees may be completing. This should be expected to show some internal strength and extreme indicators, which is exactly what is happening.
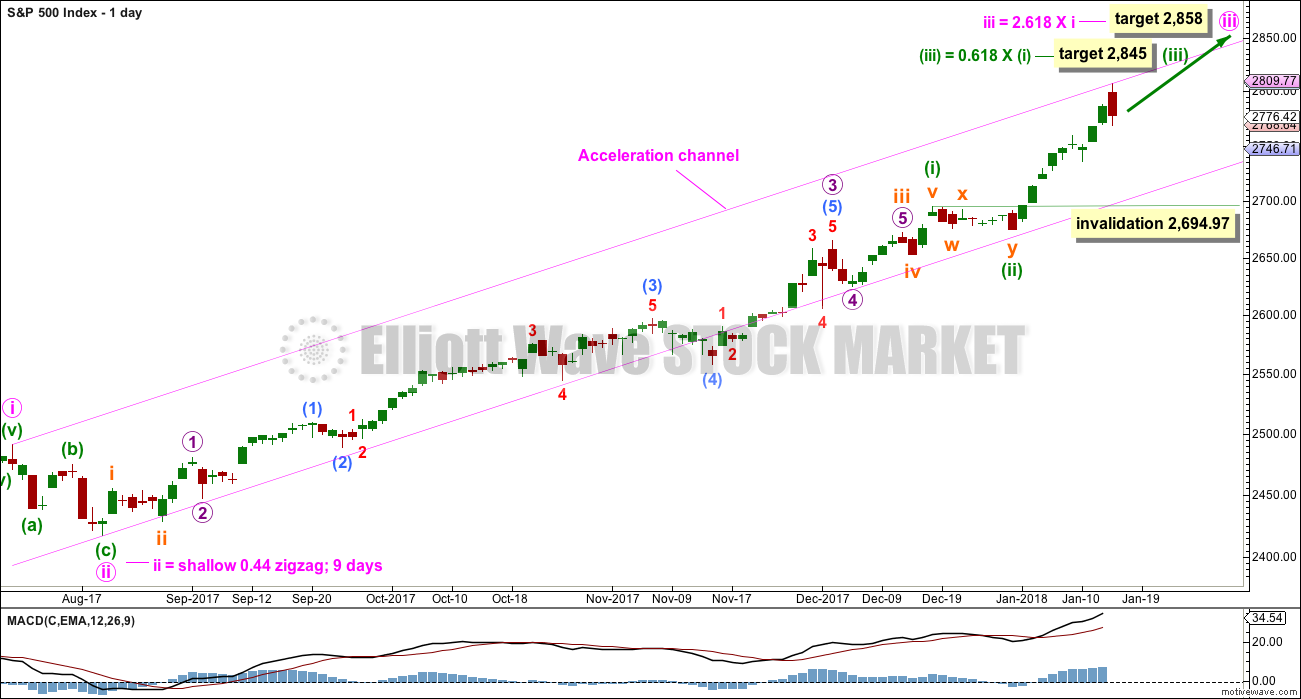
DAILY CHART
Keep redrawing the acceleration channel as price continues higher: draw the first line from the end of minute wave i to the last high, then place a parallel copy on the end of minute wave ii. When minute wave iii is complete, this would be an Elliott channel and the lower edge may provide support for minute wave iv.
Minute wave iii has passed 1.618 the length of minute wave i. The next Fibonacci ratio in the sequence is used to calculate a target for it to end.
Minute wave iii may only subdivide as an impulse, and within it minuette wave (i) only may have recently ended as a long extension.
Within the impulse of minute wave iii, the upcoming correction for minuette wave (iv) may not move back into minuette wave (i) price territory below 2,694.97.
Because minuette wave (i) with this wave count is a long extension, it is reasonable to expect minuette wave (iii) may only reach equality in length with minuette wave (i). This target fits with the higher target for minute wave iii one degree higher.
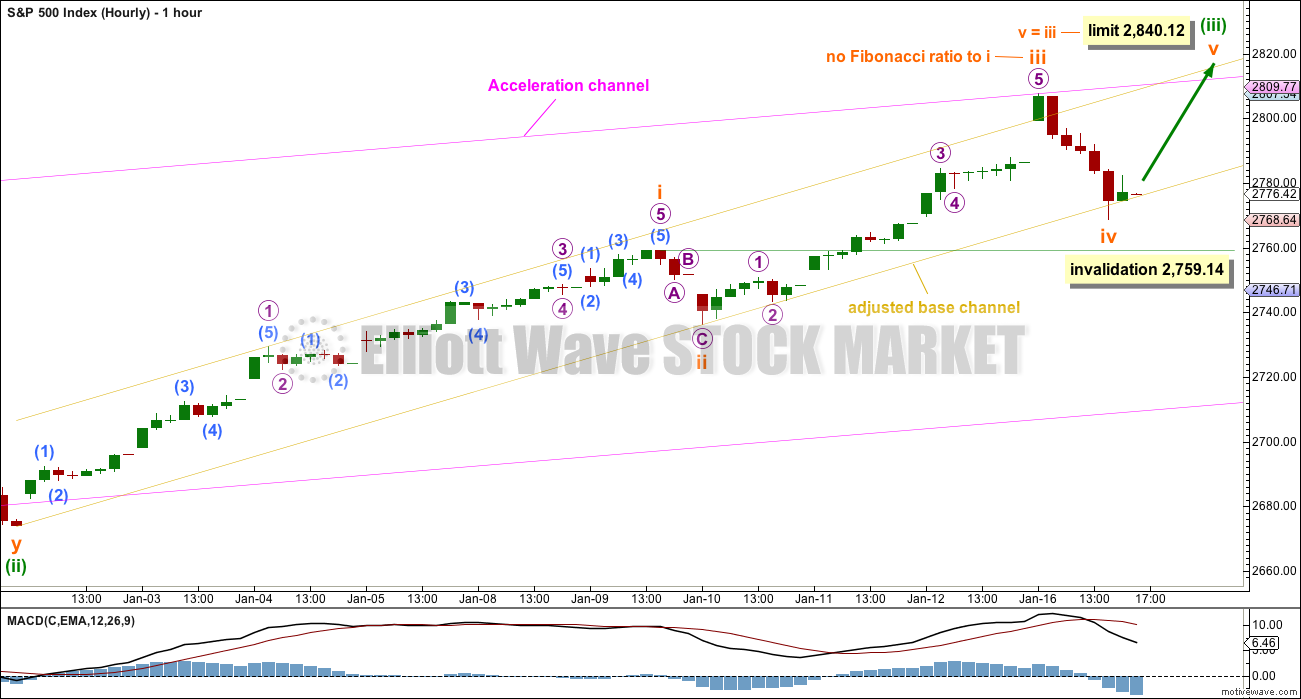
HOURLY CHART
Always assume that the trend remains the same until proven otherwise. At this stage, there is no technical evidence for a trend change; we should assume the trend remains upwards.
The lower edge of the adjusted base channel has provided support today for downwards movement. Price overshot the trend line and quickly returned back above it.
Momentum for recent movement is strongest at today’s high. This may be the end of subminuette wave iii.
If subminuette wave iv began at today’s high, then it looks like it should be over at today’s low. Subminuette wave iv may not move into subminuette wave i price territory below 2,759.14.
If subminuette wave iii is over at today’s high, then it is shorter than subminuette wave i. Subminuette wave v is limited to no longer than equality in length with subminuette wave iii, so that the core rule stating a third wave may not be the shortest is met.
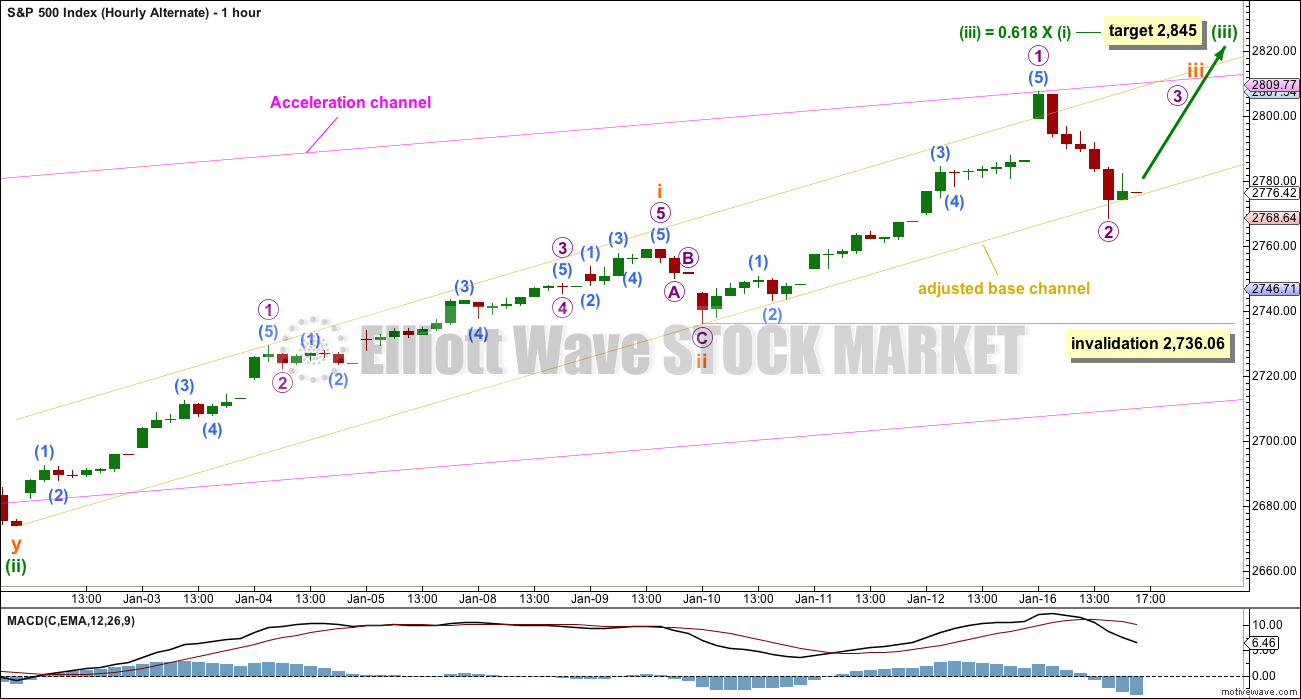
ALTERNATE HOURLY CHART
It is possible that subminuette wave iii is not over. However, this wave count is an alternate because the proportion of micro wave 2 does not look right to subminuette wave ii. Micro wave 2 looks too big.
If price breaks below the lower edge of the base channel, then this alternate wave count should be discarded. A lower degree correction at micro degree should not breach a base channel drawn about a first and second wave one or more degrees higher.
Micro wave 2 may not move beyond the start of micro wave 1 below 2,736.06. This wave count would be discarded prior to invalidation.
ALTERNATE DAILY CHART
It is possible today that minute wave iii is over. Confidence in this wave count may be had if the main hourly wave count above is invalidated with a new low below 2,759.14.
If minute wave iv is underway, then it may be expected to be reasonably in proportion to its counterpart minute wave ii correction. Minute wave ii lasted nine days, so expect minute wave iv to last a Fibonacci eight or thirteen days.
Minute wave ii was a zigzag, so minute wave iv may exhibit alternation as a flat, combination or triangle. These corrections are all sideways and usually more time consuming than zigzags.
Minute wave iv may end when it finds support about the lower edge of the pink Elliott channel. If it does not end there and if it overshoots the channel, then minute wave iv may end within the price territory of the fourth wave of one lesser degree. Minuette wave (iv) has its territory from 2,694.97 to 2,673.61.
Minute wave iv may not move into minute wave i price territory below 2,490.87.
TECHNICAL ANALYSIS
WEEKLY CHART
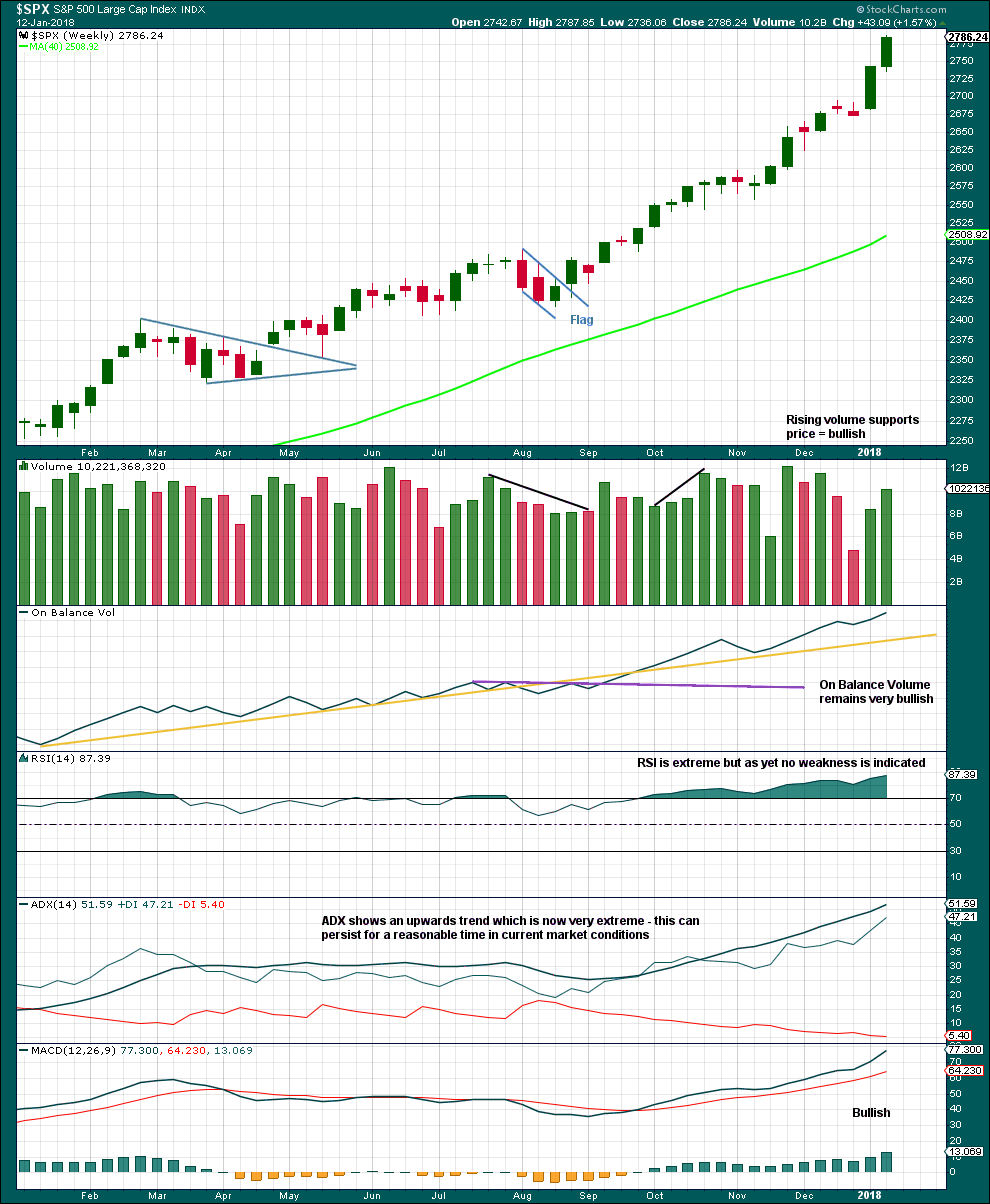
Click chart to enlarge. Chart courtesy of StockCharts.com.
Indicators should be expected to be extreme as a third wave at four degrees comes to an end.
When third waves are ending they fairly often will show weakness at the weekly chart level. There is still no evidence of weakness at this time. When intermediate wave (3) is close to or at its end, then we may expect to see some weakness.
DAILY CHART
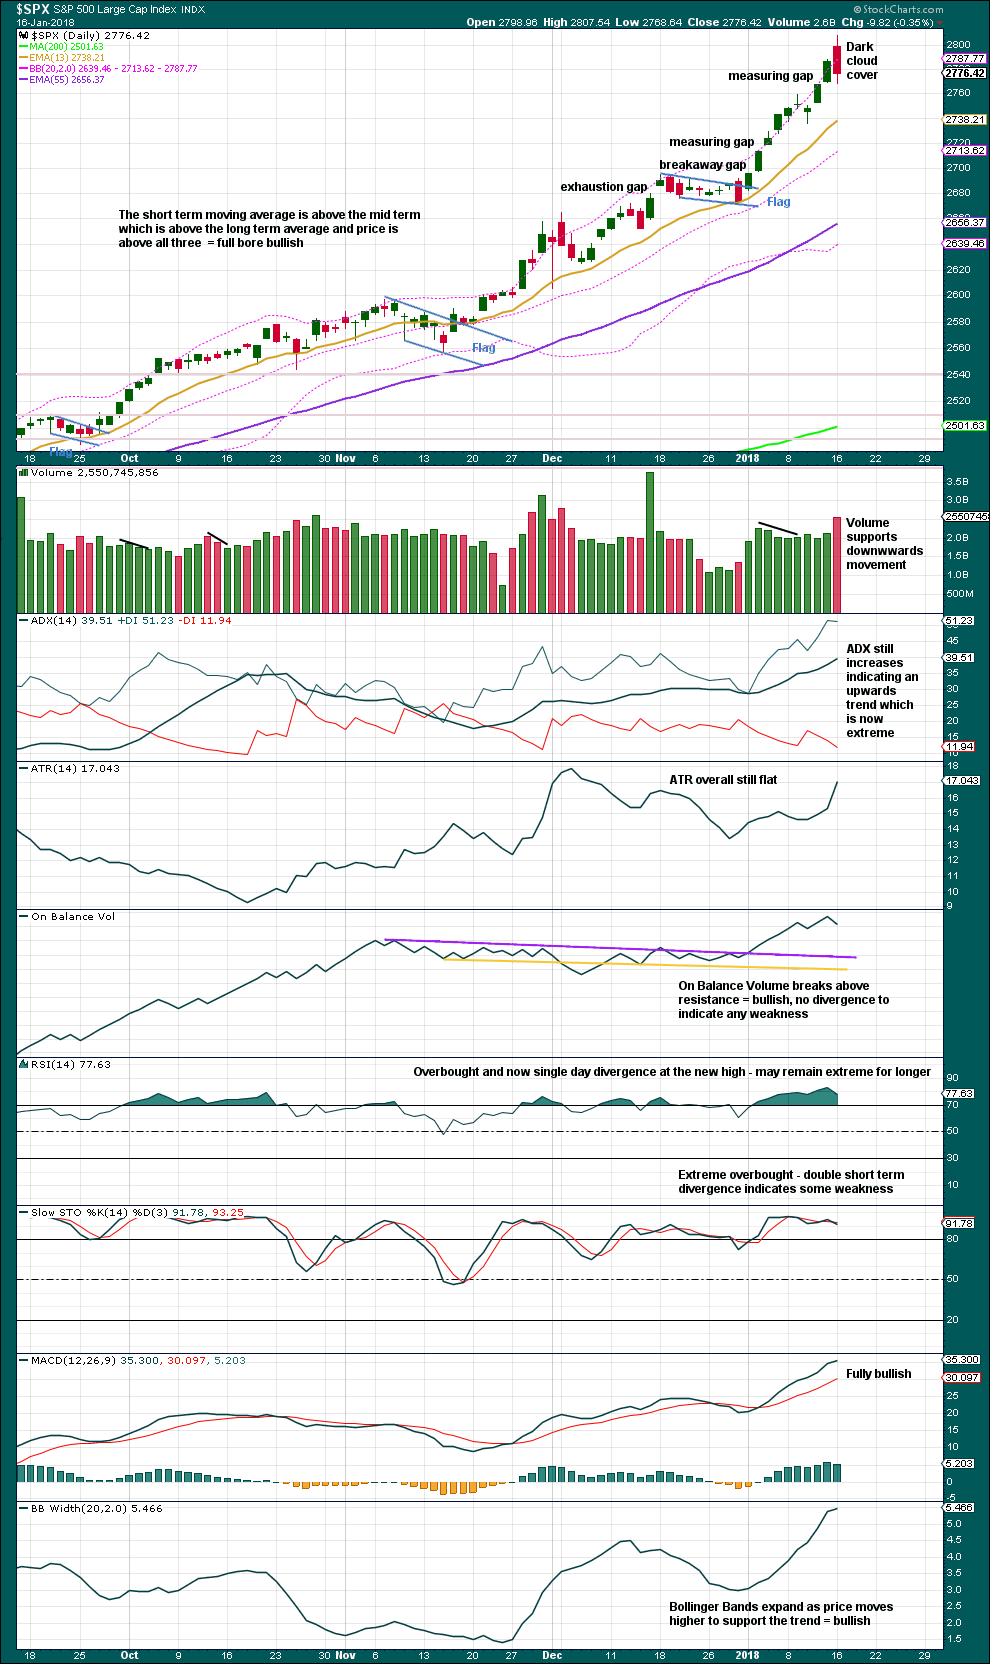
Click chart to enlarge. Chart courtesy of StockCharts.com.
The target calculated using the last measuring gap was at 2,801, and this has now been met. Price has moved lower during the session.
RSI is very extreme but can continue for longer. It now exhibits some divergence today, but this is only single day and not enough to indicate reasonable weakness. Stochastics exhibits slight weak divergence, but not enough to indicate a correction should begin here.
This chart is still very bullish indeed.
The candlestick reversal pattern may indicate a correction to begin here. But it should be noted that there are a few reversal patterns on this chart already, none of which were followed by any sustained downwards movement: a bearish engulfing pattern on the 19th of December, a gravestone doji on the 21st of December, and a bearish engulfing pattern on the 23rd of October.
VOLATILITY – INVERTED VIX CHART
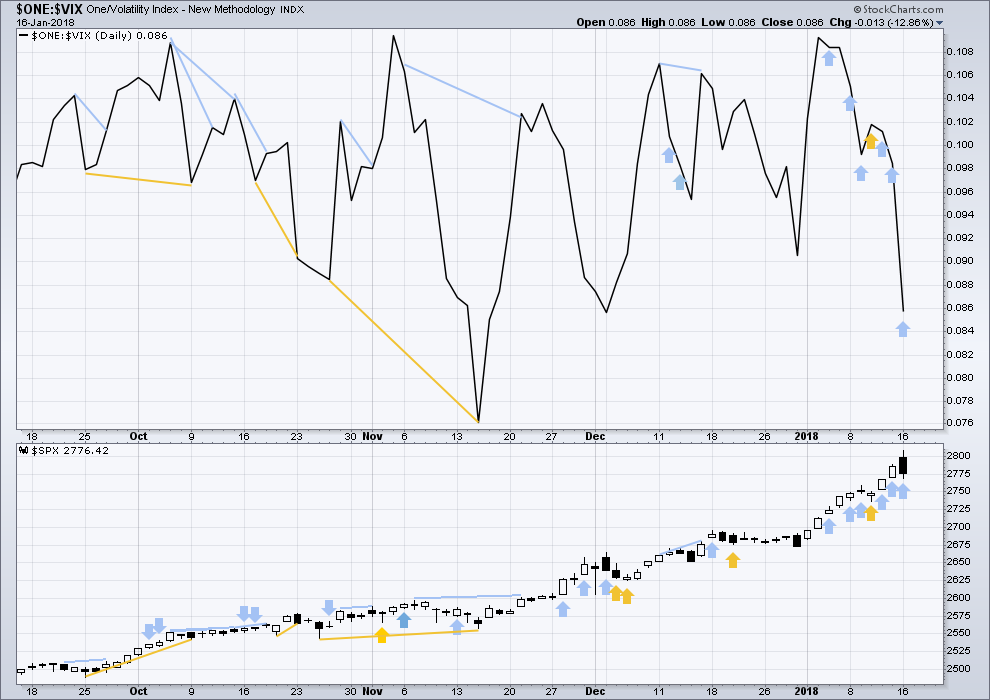
Click chart to enlarge. Chart courtesy of StockCharts.com.
So that colour blind members are included, bearish signals will be noted with blue and bullish signals with yellow.
Normally, volatility should decline as price moves higher and increase as price moves lower. This means that normally inverted VIX should move in the same direction as price.
There are now three days in a row of price moving higher but inverted VIX moving lower. This is now fairly bearish. The rise in price has not come with a normal corresponding decline in market volatility. Volatility has increased sharply.
BREADTH – AD LINE
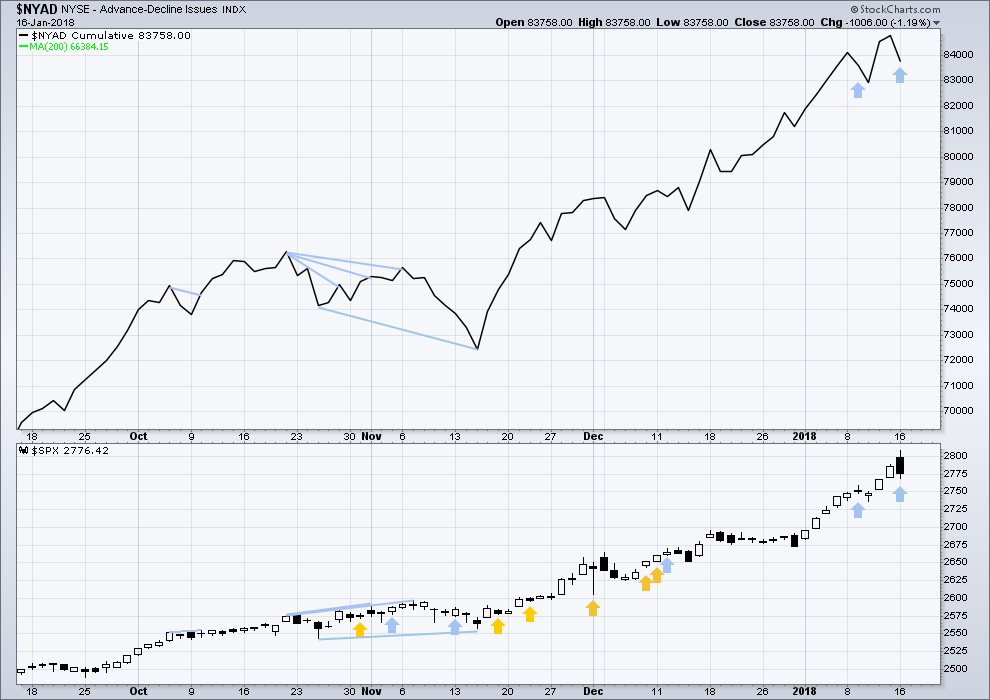
Click chart to enlarge. Chart courtesy of StockCharts.com.
There is normally 4-6 months divergence between price and market breadth prior to a full fledged bear market. This has been so for all major bear markets within the last 90 odd years. With no longer term divergence yet at this point, any decline in price should be expected to be a pullback within an ongoing bull market and not necessarily the start of a bear market.
All of small, mid and large caps last week made new all time highs. This market has good support from rising breadth.
Breadth should be read as a leading indicator.
Price has made a new all time high today but market breadth has declined. The decline in breadth today may be a leading bearish signal.
DOW THEORY
The S&P500, DJIA, DJT and Nasdaq last week all made new all time highs. The ongoing bull market is confirmed.
The following lows need to be exceeded for Dow Theory to confirm the end of the bull market and a change to a bear market:
DJIA: 17,883.56.
DJT: 7,029.41.
S&P500: 2,083.79.
Nasdaq: 5,034.41.
Charts showing each prior major swing low used for Dow Theory are here.
Published @ 08:51 p.m. EST.

One more outrageous wrinkle to all this from Mr. Market. VIX is actually finishing UP for the day after a 1% run-up at all time highs! LOL what a hoot.
Updated main hourly chart:
Assume the trend remains the same, until proven otherwise.
Do I now have to ignore both bearish signals from ViX and the AD line?!?!
Absolutely amazing. A few years ago I learned the hard way short side profits cannot be left in this market. Declines for quite sometime are pretty much completing in one session. I have never seen anything quite like it. The pattern continues.
I don’t think we are going to know how to act when the market has a decline of more that a few hours! 🙂
I know, thank God I always put stops and profit takes in right after execution. Took gains in IWM and DIA shorts about 1.65 hours after entering them yesterday, and Literally reloading them now, likely to my detriment short term. Verne, reload VIX??
I quietly did at the lows today Chris. The down candles were puny, and not the kind of big red monsters that accompany an above B band climax.
Grabbed some Jan 24 11.00 strike calls for 0.50, now bid at 0.70 as it moved up as expected into the close.
Today notches yet one more strange and unprecedented anomaly in my VIX trading experience, and that is market and VIX BOTH CLOSING above upper B bands! Curioser and curioser! What does it all mean I wonder?
Nice, and congrats. We are in uncharted and dangerous waters for sure. Market down 15%, VIX 50 all in one day coming soon.
I sold my AG position for a profit today. I should have held a few more days… but up 322 in the DOW, I think best to book a profit every couple of days so as not to get trapped on a turn. When it comes it will be swift, I am sure.
I was going to put on a VIX trade in the last hour today… but it moved so fast while I was looking for an entry. I only want to put one on near the lows.
Now I am concerned about putting any trades on.
I am completely befuddled that with the plethora of new all time highs we have not seen VIX move correspondingly lower. It is the kind of action I would have expected to see during the completion of a terminal wave but I am uncertain about that as so many other things that signal a top are missing. It might be a third wave top of higher degree that we expect. Let’s hope that move below 10.00 last Friday was not our last opportunity to get historically cheap vol. I expect at least one more massive intra-day beat down that would be a great opportunity as the wave up completes.
Buying January 24 SPY 280 strike puts for 1.35 1/4 full load. Buy stop for another 1/4 at ask of 1.50, stop at 1.15….
At this point I don’t view the VIX action as anything but “natural” relative to the action over the last day in SPX. VIX readjustment down after a small spike due to a small SPX sell off is always a bouncing glide path over time, back to the 9-10 range. And overall, I’d say a healthy bull market is one where not every indicator is bullish all at once; when that happens, I really worry about a top! I’m not worried about a top here, though the possibility of a big flat 4, which will give the market a double top look for a bit, has entered my mind! If the ATH here doesn’t hold, look for a next stop at 2018 or so.
Key to note though: this afternoon’s wave count indicates a LARGER 4 is just around the corner…
I do not recall ever seeing market price and VIX BOTH trading above the upper B band simultaneously, so in that sense, I would hardly call it “natural” 🙂
That was quick! Filled on second batch at 1.48…
I’m not sure what you mean when you say you’d be worried if “ALL” the markers are bullish. That’s essentially where we have been these last two weeks, though these last 3 days there has been a very minor divergence in VIX all the way up to… 11.5. A level which used to be considered monstrously low but is not just taken for granted.
Historically, markets diverge in volatility and breadth before a top in price is made. Unless I am mistake, Lara has shown this multiple times in past analysis. There is not even a faint whisper of divergence anywhere on the classic technical weekly chart. I anticipate this is just the beginning of the inevitable melt-up we will see these next few years.
Where does the 2018 come from Kevin?
It may be that window in which those signals take effect may now have to be extended! 🙂
yes, I have been considering that
we have a scattering of these bearish signals now. if they continue and yet price keeps going up… then I’m wondering if they are a warning sign
I’m wondering if this extreme bullishness with beginning bearish signals means that a correction may come and be rather violent
but in the meantime we have to acknowledge what is in front of us right now, and it’s an upwards trend that continues
Of course they are Lara, but they will only matter when it’s too late. The central banks are in control until they aren’t. Plain and simple. Case in point, the minute candle action from 10:10 until 3:10.
Another chartist I followed mentioned that SPX has been regularly rebounding each time it gets oversold on the 15-minute chart. The regularity of this pattern is pretty astonishing over the last 2 months. There is virtually no price discovery. Algos just drive us higher and higher.
Sven’s the man, Good dude as well.
that’s interesting, thank you for sharing
I’ll keep an eye on that
Taking a small profit on VIX 12 strike calls.
For the last 24 months, a VIX visit to the upper B band and beyond has invariably marked an interim bottom in market declines. I am inclined to assume we will see the same thing with this strong move of VIX above the upper B band, and bands not expanding to contain it. I am not sure how this fits with the larger vol situation but until VIX does something different, I am assuming it will not.
I have to say it does look like another bull flag though…
Steady vol accumulation continues apace. This is quite fascinating.
If this correction is not over and does an ABC, then key decision points for B up turning back down into a C are at 2788 (50% retrace of A down), and 2702.6 (62% retrace), and then 2798.2 (76% retrace). Sure looking like a 5 down and 3 up so far, but that view can change fast.
XLU is giving pretty strong signals of having bottomed. I’m long there.
Oops, that 62% was 2792.6. Price has stalled for a bit at 2791, which is also a recent move fibo. Wouldn’t be surprised to see a turn back down from this general area, starting up in the next 30-60 minutes.
The 76.4% retrace of yesterday’s downmove was just tagged. According to Hoyle, if the market pushes through, it’s going to the 127%, which is around 2818-19. First try against that fibo a fail…
And to think, someone was worried about a little dark cloud cover. Lol!!! Well I did say “unless the market moves sideways and up”, and it sure is doing that. The bull snorts a bit of fire in response to someone having the temerity to do some selling, lol!!
Call me old fashioned. I was taught that gaps at the open represent folk buying the market at the open AT THE ASK!!
I understand the charts are bullish.
I understand we do not yet have meaningful market divergence.
Still, I do have to ask what kind of mentality jumps in to buy the market at the ask with VIX heading straight up??
Has the level of arrogance of market participants now reached the point where the perception of market risk is that it does not exist?
There is an article on zero hedge musing about whether the decline yesterday was the last opportunity to get long. They are contending that with all the banks and sovereign wealth fund buying, like SNB and the Norway SWF,( and they are right about those two!), the effect will be even more powerful than Q.E.
Makes you wonder does it not? 🙂
I heard a rumor a few weeks back that a few hedge funds had taken a look at the massive and insane short vol trade and put a plan together to inflict some pain on the cohort foolish enough to get themselves in that kind of position. If that is anywhere close to the truth, the next few weeks are going to be incredibly interesting. The absence of any aggressive smack downs so far has be wondering if the word is out…those are some very fat candles indeed. We have noting remotely resembling capitulation though and this short vol scenario is perhaps something that analysts have not been taking into consideration as regards the implications of a forced unwinding.
Yesterday I mentioned the rarity of VIX intra-day gaps…well, we have one today on the thirty minute chart….interesting!
Dang these gaps!
SPX weekly, daily, hourly, 5 minute. This chart screams caution re: the long side to me. Upper left is weekly. Question is, do we get sideways and upward action from here going forward, ala the end of June’s behavior in similar circumstances, or is there finally a pullback? The look of the dark cloud cover here is far more ominous for being at the conclusion of such an extended multi-week run up with blow-off top type movement the last two weeks. I would not be surprised at all to see 2700 or less at some point pretty quick in this correction, with the VIX soaring. The start of the larger sequencing we are going to be getting. “Fasten your seat belts, we’ll be encountering some turbulence ahead.” Remember, the absolute best buying opportunities are when fear is naturally at its greatest! I find this to be really true in SPX with its sudden plunges and often sharp V bottoms.
I agree, I think we are far, far from a final top in price, but that doesn’t mean we shouldn’t see choppier movement going forward. If this bull market is EVER going to end there has to be an uptook in volatility going forward. I expect to see VIX 13, VIX 15, VIX 20, VIX 25, VIX 30, all at various points within the next 1-3 years before there’s any chance we get that 20%+ downturn at some point.
It’s pretty incredible that we’ve gotten to a point where greater than one down day in a row is considered a catastrophe. People talk about being nowhere near the euphoria of 1999, but what is seemingly always forgotten is that the period 1998-1999 was not a one-way street like this market is. There were massive upswings followed by huge 5-10%+ downswings (particularly in the NASDAQ). And although we are far from the ludicrous valuations we saw at the end of that bull market, we are still at fairly ludicrous levels of volatility and upward momentum that have been seen perhaps only two or three times EVER before in the history of the market (and were not seen even in the euphoria of 1999).
Kevin,
I think the drop and some Buying into the close setup new shorts in the trap. I think given the $$ pouring in from retirement contribution s etc., It is hard for me to see a correction that extended…Cryptos are crashing so that money will find its way into markets as well…There might be an attempt to rob long players heading into the earnings season on premier names.
Selling 50% of remaining VIX calls for a triple… Holding the rest Verne
Great discipline Chris! I bailed on 3/4 of my stake for a bit better than a double. Holding 1/4 still for upcoming spike. I guess the brutal smash downs have me in a “get-out-of-dodge” mode lol!
Sideways/up so far! The sell off in GS this morning is epic and as I see it a reasonable long opportunity. We’ll see what the rest of the day brings. Maybe the 2 or 4 is already over…maybe.
GS loses a lot of money in its TRADING division! Hilarious, and telling. It ain’t easy, even for the “pro’s”!!! Lol!!!!! Well, I hope the low this moring holds and I get a little bounce in GS today. Meanwhile, everything overall is looking nicely bullish once again. INTC is performing well for me.
Wisely as it turns out took small profit in GS at the high of the morning bounce. Back to the lows again. I’ll wait for a real bottom to form before reentry now, though a V bottom still won’t surprise me. GS is going to make incredibles piles of profit with the tax cut and the coming financial deregulation in the coming year, in my estimation, and the stock will likely soar with the general market.
Boiiinngggg!!!!!!