Price has moved lower. Last analysis warned that divergence with the AD line and bearish signals from VIX may be followed by some downwards movement.
Summary: Always assume the trend remains the same until proven otherwise. The trend is up. Corrections are opportunities to join the trend.
The main wave count expects upwards movement from here. The alternate expects a correction to continue lower to last for about two weeks.
Last monthly and weekly charts are here. Last historic analysis video is here.
The biggest picture, Grand Super Cycle analysis, is here.
MAIN ELLIOTT WAVE COUNT
WEEKLY CHART
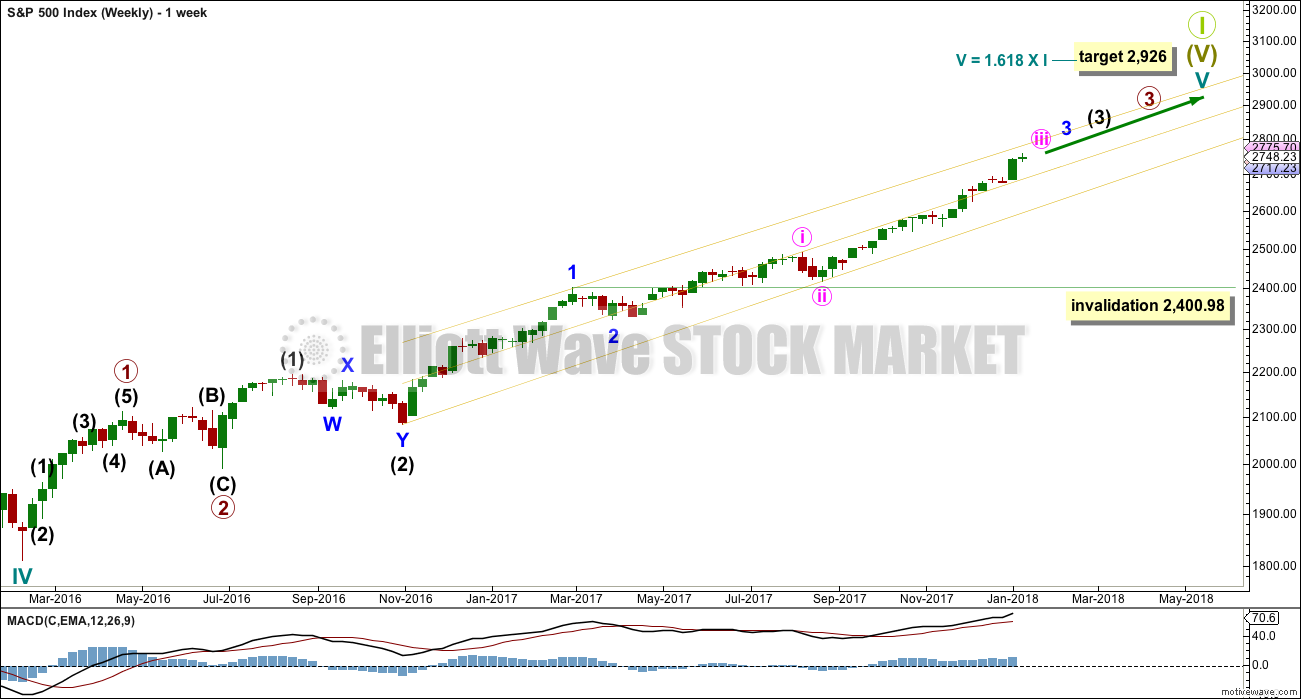
Cycle wave V must complete as a five structure, which should look clear at the weekly chart level. It may only be an impulse or ending diagonal. At this stage, it is clear it is an impulse.
Within cycle wave V, the third waves at all degrees may only subdivide as impulses.
Within cycle wave V, the corrections for primary wave 2 and intermediate wave (2) both show up clearly, both lasting several weeks. The respective corrections for intermediate wave (4) and primary wave 4 should also last several weeks, so that they show up at weekly and monthly time frames. The right proportions between second and fourth wave corrections give a wave count the right look. This wave count expects to see two large multi week corrections coming up.
Cycle wave V has passed equality in length with cycle wave I, which would be the most common Fibonacci ratio for it to have exhibited. The next most common Fibonacci ratio would be 1.618 the length of cycle wave I.
Intermediate wave (3) has passed equality in length with intermediate wave (1). It has also now passed both 1.618 and 2.618 the length of intermediate wave (1), so it may not exhibit a Fibonacci ratio to intermediate wave (1). The target calculation for intermediate wave (3) to end may have to be done at minor degree; when minor waves 3 and 4 are complete, then a target may be calculated for intermediate wave (3) to end. That cannot be done yet.
When minor wave 3 is complete, then the following multi week correction for minor wave 4 may not move into minor wave 1 price territory below 2,400.98. Minor wave 4 should last about four weeks to be in proportion to minor wave 2. It may last about a Fibonacci three, five or even eight weeks if it is a time consuming sideways correction like a triangle or combination. It may now find support about the mid line of the yellow best fit channel. If it does find support there, it may be very shallow. Next support would be about the lower edge of the channel.
A third wave up at four degrees may be completing. This should be expected to show some internal strength and extreme indicators, which is exactly what is happening.
DAILY CHART
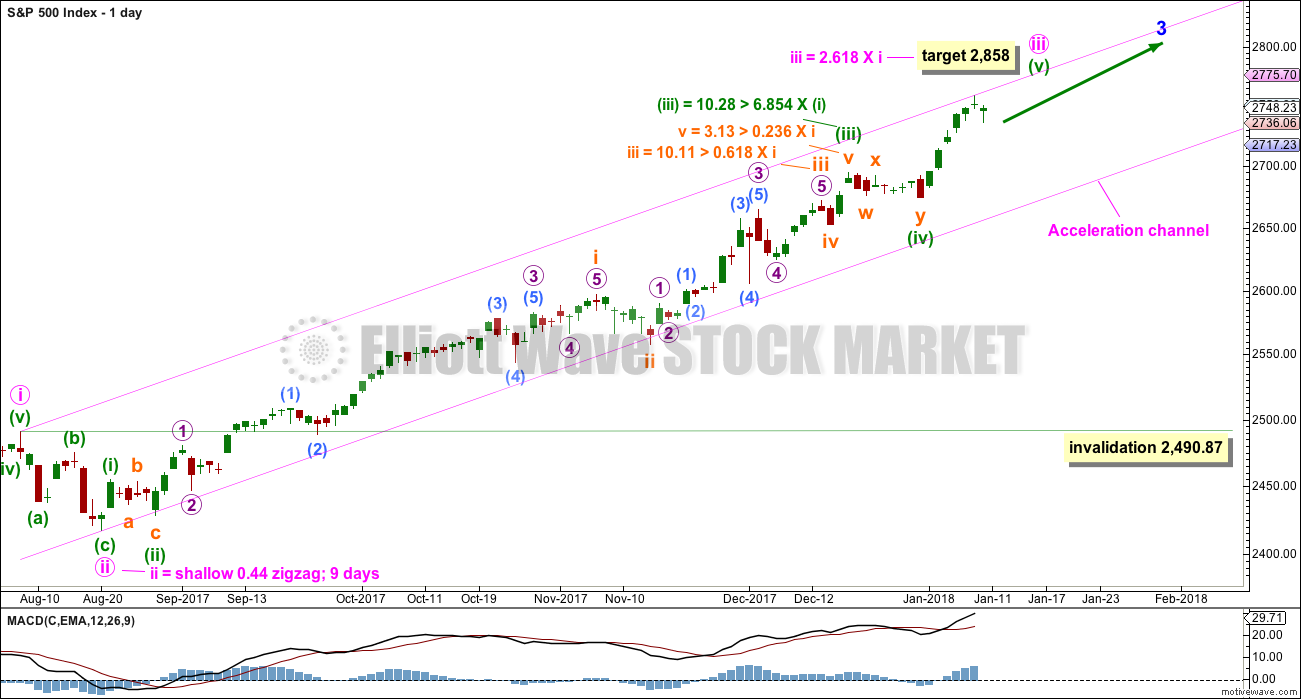
Keep redrawing the acceleration channel as price continues higher: draw the first line from the end of minute wave i to the last high, then place a parallel copy on the end of minute wave ii. When minute wave iii is complete, this would be an Elliott channel and the lower edge may provide support for minute wave iv.
Minute wave iii has passed 1.618 the length of minute wave i. The next Fibonacci ratio in the sequence is used to calculate a target for it to end.
Minute wave iv may not move into minute wave i price territory below 2,490.87. However, minute wave iv should most likely remain within the channel and not get close to the invalidation point. It may end within the price territory of the fourth wave of one lesser degree, that of minuette wave (iv) from 2,694.97 to 2,673.61.
MAIN HOURLY CHART
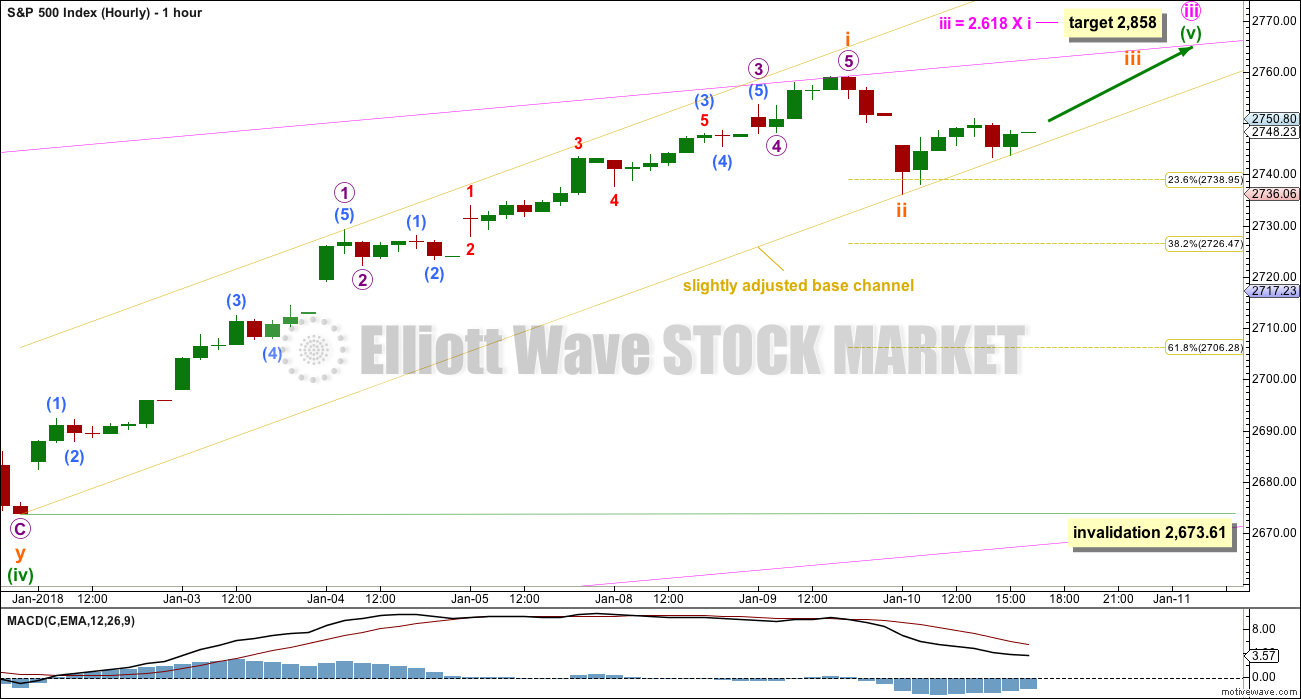
This is the main hourly chart because we should always assume that the trend remains the same until proven otherwise. At this stage, there is no technical evidence for a trend change; we should assume the trend remains upwards.
The lower edge of this base channel drawn from the start of subminuette wave i to today’s low perfectly shows where price found support at the end of today’s session. The channel is adjusted with the upper edge pushed higher to contain all of subminuette wave i.
On the five minute chart, the downwards movement for this session will subdivide as either a zigzag or an impulse. This wave count looks at it as a zigzag.
If this wave count is correct, then upwards movement should show an increase in momentum over the next few days as a low degree third wave unfolds.
Subminuette wave ii may not move beyond the start of subminuette wave i below 2,673.61. However, this main wave count may be discarded prior to invalidation in favour of the alternate below if downwards movement continues here and shows some strength.
ALTERNATE HOURLY CHART
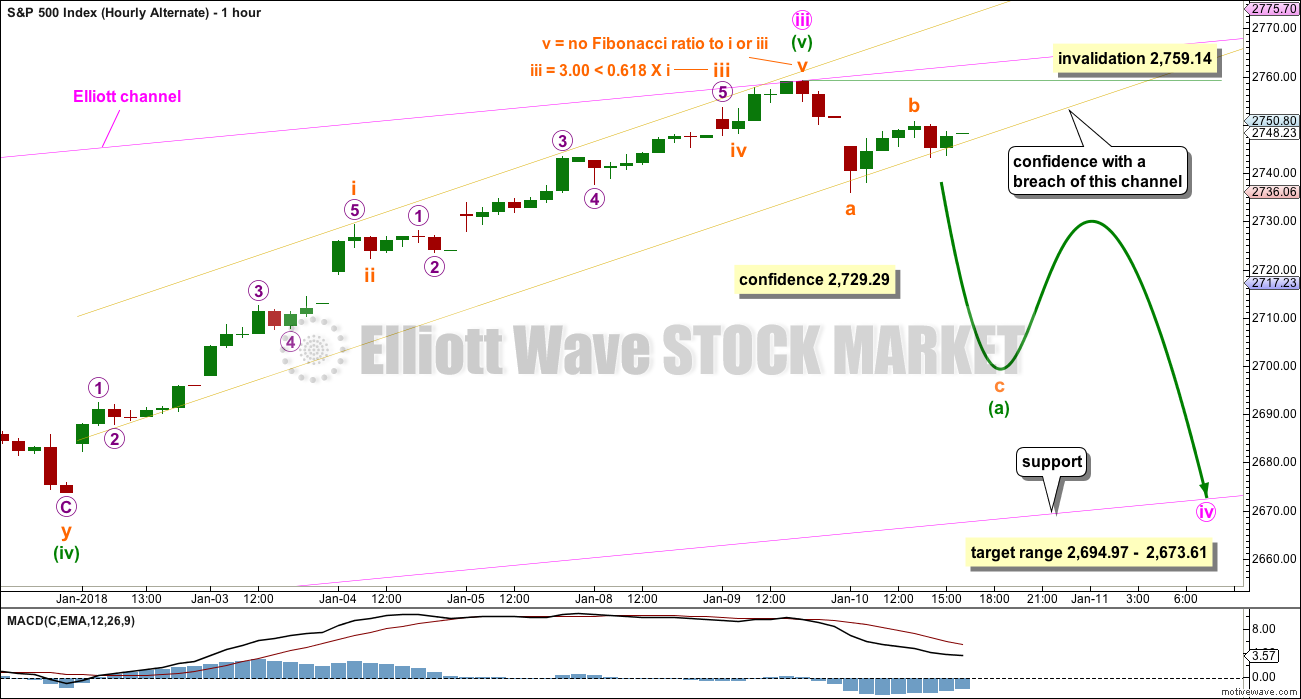
If the degree of labelling within the last wave up is moved all up one degree, then it is possible that minute wave iii is over and minute wave iv downwards has begun. This wave count was the third hourly chart in yesterday’s analysis.
If minute wave iv has begun, then it should continue for about two weeks. Minute wave ii was a shallow zigzag lasting nine days. Minute wave iv may exhibit alternation as a flat, combination or triangle. For good proportion, it may last about nine days but may be a little longer as sideways corrections tend to be more long lasting than zigzags.
Within the first wave down, no second wave correction nor B wave may make a new high above the start of minute wave iv. At this early stage, within minute wave iv, a three or five down should continue.
TECHNICAL ANALYSIS
WEEKLY CHART
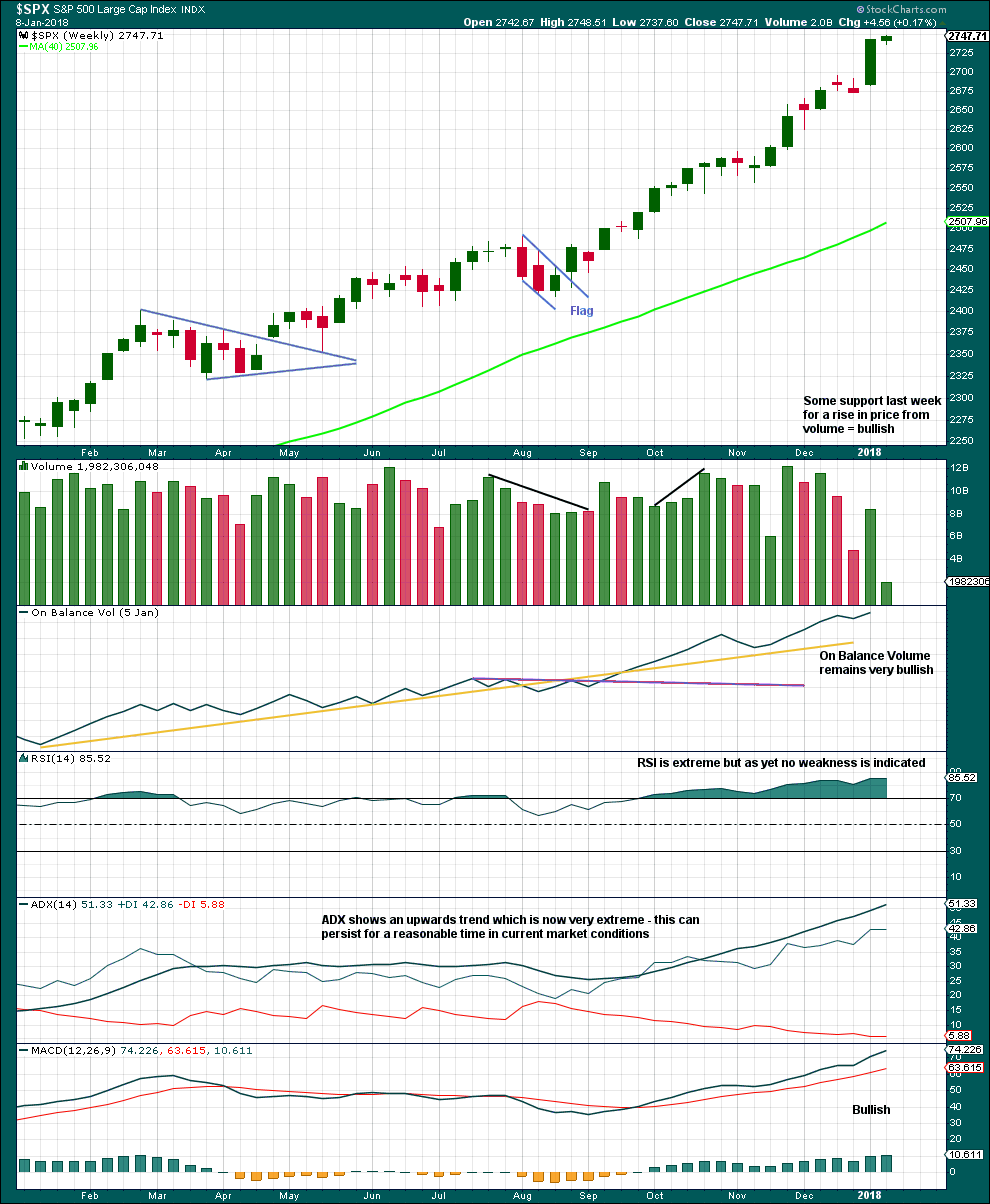
Click chart to enlarge. Chart courtesy of StockCharts.com.
Indicators should be expected to be extreme as a third wave at four degrees comes to an end.
When third waves are ending they fairly often will show weakness at the weekly chart level. There is no evidence of weakness at this time. When intermediate wave (3) is close to or at its end, then we may expect to see some weakness.
DAILY CHART
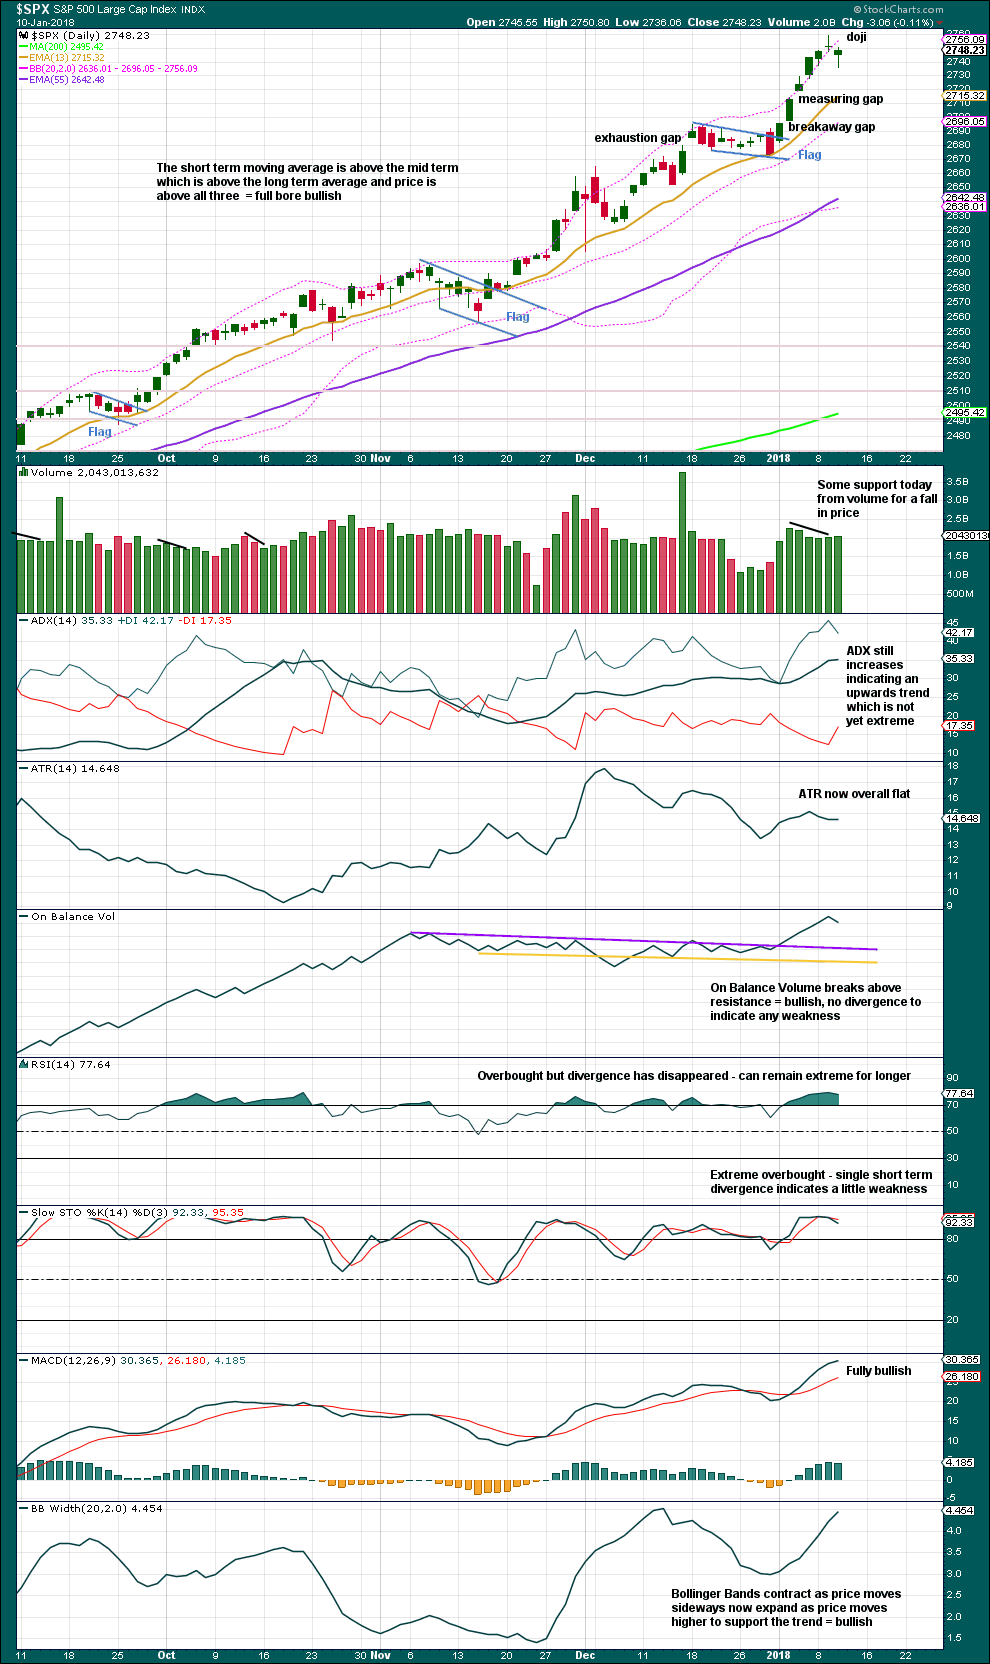
Click chart to enlarge. Chart courtesy of StockCharts.com.
The flag gives a target at 2,755. The measuring gap gives a target at 2,760. The high yesterday at 2,759.14 perfectly meets this small 5 point target zone.
Price has not completed a red candlestick, and the real body is very small, although price has moved lower today. No candlestick reversal signal has completed. There is no indication of a trend change. The longer lower wick of today’s candlestick is slightly bullish.
RSI and Stochastics may continue for much longer although they are still extreme. There is not enough divergence at this stage to indicate weakness enough for a multi week pullback or consolidation here.
VOLATILITY – INVERTED VIX CHART
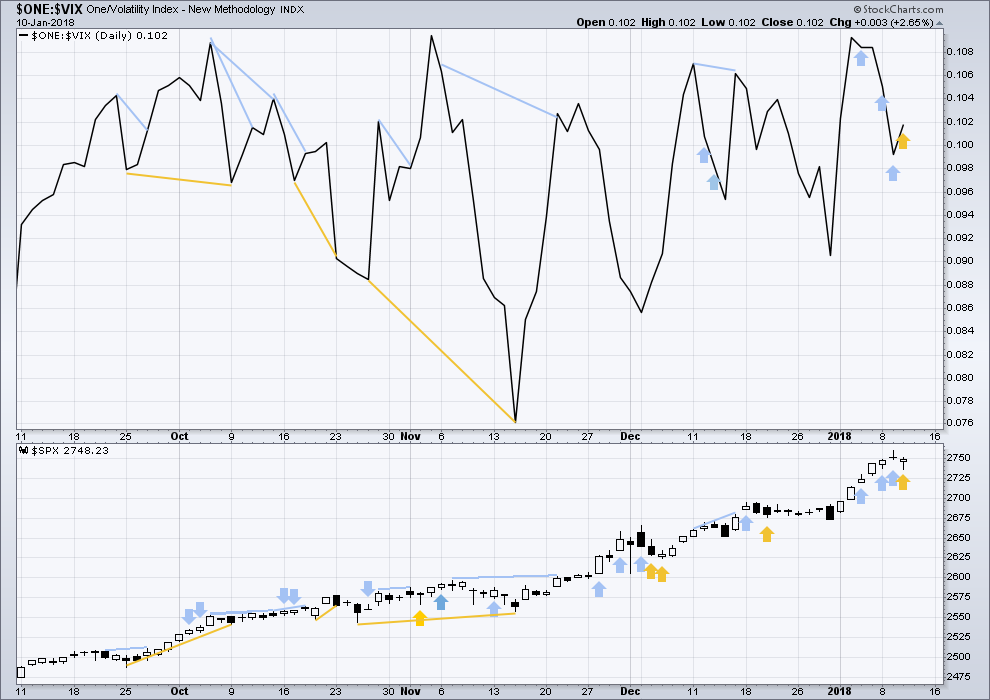
Click chart to enlarge. Chart courtesy of StockCharts.com.
So that colour blind members are included, bearish signals will be noted with blue and bullish signals with yellow.
Normally, volatility should decline as price moves higher and increase as price moves lower. This means that normally inverted VIX should move in the same direction as price.
The last three instances of bearish divergence have now been followed by a downwards day from price. This divergence may be resolved here, or it may need another downwards day before it is resolved.
Price moved lower today, but inverted VIX increased. The downwards movement in price did not come with a normal corresponding increase in volatility; volatility has declined. This divergence indicates weakness today in price and is bullish.
BREADTH – AD LINE
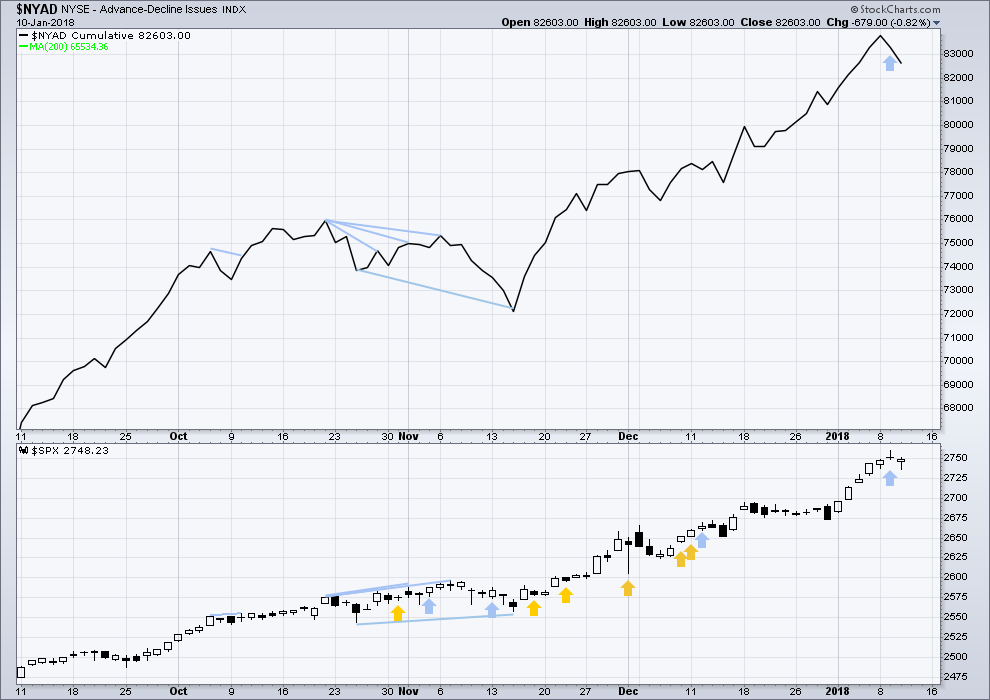
Click chart to enlarge. Chart courtesy of StockCharts.com.
There is normally 4-6 months divergence between price and market breadth prior to a full fledged bear market. This has been so for all major bear markets within the last 90 odd years. With no longer term divergence yet at this point, any decline in price should be expected to be a pullback within an ongoing bull market and not necessarily the start of a bear market.
Only mid and large caps made new all time highs last week. There is some weakness with small caps unable to make new all time highs; this is slightly bearish.
Breadth should be read as a leading indicator. Bearish divergence noted in yesterday’s analysis has now been followed by one downwards day. It may be resolved here, or it may need another downwards day to resolve it.
Price moved lower today and breadth declined. The fall in price has support from falling market breadth. This is bearish.
DOW THEORY
The S&P500, DJIA, DJT and Nasdaq last week all made new all time highs. The ongoing bull market is confirmed.
The following lows need to be exceeded for Dow Theory to confirm the end of the bull market and a change to a bear market:
DJIA: 17,883.56.
DJT: 7,029.41.
S&P500: 2,083.79.
Nasdaq: 5,034.41.
Charts showing each prior major swing low used for Dow Theory are here.
Published @ 06:53 p.m. EST.

If that subminuette count is right… good God. 86 points up for a I? And then just 23 points down for a II? I don’t know why I keep being astonished by these upward moves because they happen all the time now, but it’s still quite a thing to behold.
Quick shallow corrections do seem to be a feature of this market ATM
Accelerating into the close!!
The alternate hourly is invalidated, more confidence in the main hourly chart.
The classic TA targets were met and there a small pullback did develop, but it lasted one day only.
Next target 2,858.
Keep redrawing the acceleration channel as price moves higher.
Acceleration channel is the pink one.
Use the lower edge of the slightly adjusted yellow base channel for support.
Front page business section NYTimes this morning, “Investors Fear End of Binge on Bonds”. Worth a look-see. I’m in TBT myself…
Main wave count holding up well! All systems to far indicating impulse action upward, though that may change to “more 4” quickly. However, the low yesterday now looks rather solid. NAIL scored for me overnight. Into UL (countertrend), JPM and GS this morn. Best of luck all.
Right on. It looks to me as though Hourly Alternate III is invalidated and we are onward and upward.
Labeling may be invalidated, but yesterday’s overlapping upward chop still has me suspicious of a possible downward c just ahead, before the uptrend resumes in earnest.
Standing by at the moment by for a wee bit more confidence…
You asked for it, and it’s here, all markets popped up to new ATH’s. It’s corporate profits ahead party time in the market I’d say.
Yep. That was quick!
I’ll add to Lara’s justification for the primary wave count today that not only is the trend up and there’s no evidence of trend change of significance…the trend isn’t just up. It’s obscenely, aggressively and relentlessly UP. Crazy up. After a crazy up year, after 7-8 years of strong up. Even the last 3 week “pullback” in December barely registered as down at the weekly level. What we are seeing is what is a longer term process of pricing in of those cuts, and the overarching result may be, BY FAR, an extreme extension of this already extreme bull market. Don’t get me wrong: I also am confident in Lara’s larger count, that we’ll see a sequence of increasingly large 4 waves that will quickly get everyone crying “end of the bull market!”, only to have fresh impulse 5’s back to new ATH’s. Overall, we are witnessing one of, and what I believe will become THE greatest bull market in modern history. Of course it’s a bubble: all bulls become bubbles in their final stages. However, it’ll take several very big blows before it truly pops. Managed well, it should be a tremendous market for long side profits. “Use the Wave Count Luke!”.
Successful Thursday trading all.
I definitely agree the end is likely to arrive later rather than sooner. Volatility should begin to diverge toward the end of the bull market, but instead of divergence we are seeing even more and more VIX records being set. I despise conspiracy theories, but I do wonder about Powell’s comments alluding to the Fed having a short volatility position. What exactly does that mean? Has the Fed actually been selling massive quantities of VIX futures contracts? Has their plan been to keep the market beasts tame in preparation for the current balance sheet unwind? The rest of the market has been quite happy to jump on the short VIX train. People are seriously talking about the VIX printing a 6 handle before it ever reaches 20 again.
Acknowledging there’s disagreement about it…I do not view the VIX as in any way “controlling”, nor “leading”, nor a means for “manipulation”. It’s reactive. To the SPX price change. End of story as far as I’m concerned. Perhaps CB’s etc. are manipulating the market. Perhaps they are taking advantage of the power of short volatility trades. But they are not manipulating the market via volatility trades, because that’s simply not how the market works. In my opinion, based on the simples mechanics of how the VIX itself is calculated. The VIX is a function of SPX put and call option pricing, which is itself driven by recent market action and computed (that’s the key word) potential for price changes over time. So while CB holdings of VIX instruments could end up part of an intertwined collapse, the purchase of VIX instruments wasn’t a means for their “managing the market”. To manage the market they have to directly buy/sell the market. In my opinion.
Well, a little internet search and I’ve found some scholarly material indicating I am wrong, that VIX prices are manipulated once a month at settlement time. Search for “Study uncovers large-scale volatility index (VIX) manipulation”. When a financial system can be gamed…it will be. Note however, this isn’t longer term market manipulation, it’s short term/instantaneous to leverage profits on closing positions, per the short description. I’m still trying to grok the implication of this re: retail traders, and how to dodge it. Any insights welcome!
I used to get really annoyed with people confidently dismissing the notion of ANY price manipulation in markets. Now I just ignore them. And yes Kevin, quite a few articles were written about the annomalous VIX spike last Dec 20. Not only does every experienced trader know and understands that this can and does happen, the good ones actually develop strategies to deal with it. I guess I can understand that people who have not actually done a lot of trading or traded for a long time could miss it. When I learned about the “stink bid” from master trader Jeff Clark, he told us he had developed it based on the exact idea of these occasional, but deliberate price anomalies. I have used it effectively dozens of times. I have a friend who lost his precious metals business ( J.S. Mint) because someone dumped 120 naked short Gold contracts overnight into the market. If you have never seen price manipulation, you have not traded much. What do you think is going on when your stops get run, and price immediately reverses….co-incidence?
I view stop runs not as manipulation (though I suppose technically it is), but merely as a recurring behavior that we have to deal with. Anyone who trades for more than a few months figures that out right quick (or doesn’t I suppose, there are blythe people in every domain). Heck, I actively look for crazy ass downspikes that more often than not result in a quick V bottom and fast run up, great way to score some quick dough; jiu-jitsu the stop runner by working in line with their actions! What appears to be unique about this monthly vix manipulation is distortion of pricing at one “layer” of the derivative structure to temporarily jack the next layer in synchrony with monthy settlement events to get highly leveraged profits. Sneaky. That all said, this is not “holding the market up” manipulation, not that I can see. Holding the market up requires direct purchasing action on the market itself. In my (current) opinion. I just see no other way to do it. Temporarily jacking around SPX option prices isn’t going to do it, nor will temporarily jacking around the VIX futures markets.
Yeah, it’s games within games within games. The more we master it all, the better we can play at a higher level of strategy and tactics! As I used to tell my engineering teams often: “we’re going kick our competitors ass at the level of technology strategy, and we are going to kick their ass at the level of hustle and execution, and we are going to WIN!”. Knowledge based strategy and hustle can get you far!
Kevin–I have to disagree here. It is well documented that divergences in both volatility and breadth precede downturns. This is not to say that VIX “controls” the market on an immediate level. VIX is indeed a function of SPX options pricing. But on a higher level, we would expect to see volatility diverge from price to some extent before there is a significant drop.
Yes, the theory behind that is that the SPX option players have more “knowledge” of what’s coming. I don’t dispute that at all. I just don’t see a significant means by which SPX option pricing can be manipulated to actually “hold up the market” in any significant, longer term manner. I’m open to hearing how it could be done.
Well like I said, I’m not a fan of conspiracy theories, so I don’t think it could be either.
However, if I were more conspiratorially-minded about it I would theorize that the Fed is aware that the market is largely a function of its own internal dynamics. I.e. volatility begets more volatility. Snuffing volatility out by flooding the futures market would be a good way to keep the bull market from unraveling. Easy access to cheap VIX hedging allows SPX market makers to continue doubling down on overextended long positions. Sell puts, buy calls, roll futures contracts to hedge.
After all, what business does the Fed have in carrying a short volatility position in the first place? Why would they do so if not to suppress volatility?
I can see how I misstated what I meant to say, re the VIX “not leading” the market. Of course it leads the market, in that it generally discounts the next 30 days of market action. What I should have said was that the VIX does not “drive” the market. While the VIX may indicate short term market direction, I can’t see how it in any significant way compels the market. The predictive aspect of the VIX is not a compelling aspect. That I can see or understand at this point in time. This is what I mean when I say “SPX price action is the head, VIX is the tail”. I don’t how the VIX can compel the price action, and given that, how it could be used to manipulate the “market” (which is the price action of SPX/it’s components).
I’m pushing the point because if there is a mechanism (aside from self-fulfilling prophecy…) by which the VIX compel market prices, I’d sure like to understand it!
I sure hope you are right Kevin.
I hope I am wrong in thinking that even a mild correction will be fatal due how freakish the myriad tools of leverage have become.
Verne you know that’s not the case; I’ll state this again and hopefully clearer, the VIX is wielded as a control mechanism on both algo/hft and risk parity. Like Kevin said, ultimately this will be part of an intertwined collapse, but certainly not sure how or when that would begin. Another way they are “managing the market” is through cash settled futures; see overnight vol, and opening gaps.
Amusing. I guess because that is what the guidelines and regs state that must make it so!
Kevin,
Crypto bubble hasn’t even bloomed yet so a reasonable correction is ways away and the crypto bubble is way bigger than the internet bubble and very disruptive. That is why banks are now changing their tune to be more accomodating to blockchain and bitcoin. Actions by government is another indication of the disruptive force likely to b released by crypto…
I do suspect the crypto bubble, as crypto investment gets intertwined with other investments, could be a hugely destabilizing force, a “big bubble” within the larger bubble if you will, which will just add to the ultimate explosion. Seems likely the timing for that lines up fairly well with overall with Lara’s GSC wave count reaching a final wave 5 maxima in a few years. We are cursed with having to live in “interesting times”!
I do suspect the crypto bubble, as crypto investment gets intertwined with other investments, could be a hugely destabilizing force, a “big bubble” within the larger bubble if you will, which will just add to the ultimate explosion. Seems likely the timing for that lines up fairly well overall with Lara’s GSC wave count reaching a final wave 5 maxima in a few years. We are cursed with having to live in “interesting times”!
Lara,I’ve posted this on EWSM as it’s not loading on EWG
Thanks
Today’s high in April Gold futures was higher than that on Jan 4 whereas this high was not breached on the Cash.
Am I right in assuming this is bearish and that April’s chart is an expanded flat or a triangle compared to the regular flat in the Cash?
Peter,
I am not on EWG but both GOLD and SILVER are giving SELL signals and likely to the hit over the coming weeks.
Anyone looking into crypto currencies lately as now JP Morgan Dimon says that he was wrong about bitcoin/blockchain…..if money moves into crypto etc. it will be drained from GOLD and SILVEr IMHO.
I don’t know why your comment was in moderation on EWG. It’s released now and I’ve answered it. With a comment there now released you should have future comments automatically published.
On Silver, why did the longer target of 21.18 change from the last public view?
Is 21.18 no longer in play?
Back into AG this morning.
A pullback probably on deck. If you have 100 or more shares sell calls and buy puts. Use put profits to build your long position. I built a great position in GORO with this approach as a long term hold. You should average 1.5 to 2% monthly.