
The daily Elliott wave count is new. It was published in comments over the Christmas / New Year holiday.
The hourly Elliott wave count expects the correction to continue and now has a target using a Fibonacci ratio.
Summary: Some downwards movement to find support at the lilac / purple trend line is expected, about 2,211. If this target is wrong, it may be a little too low. Use the trend line as a preference. If downwards movement ends in four days, then the consolidation would have totalled a Fibonacci 21 days. Thereafter, the bull market should resume.
This bull market is strong and healthy. Use this correction as another opportunity to join the trend.
New updates to this analysis are in bold.
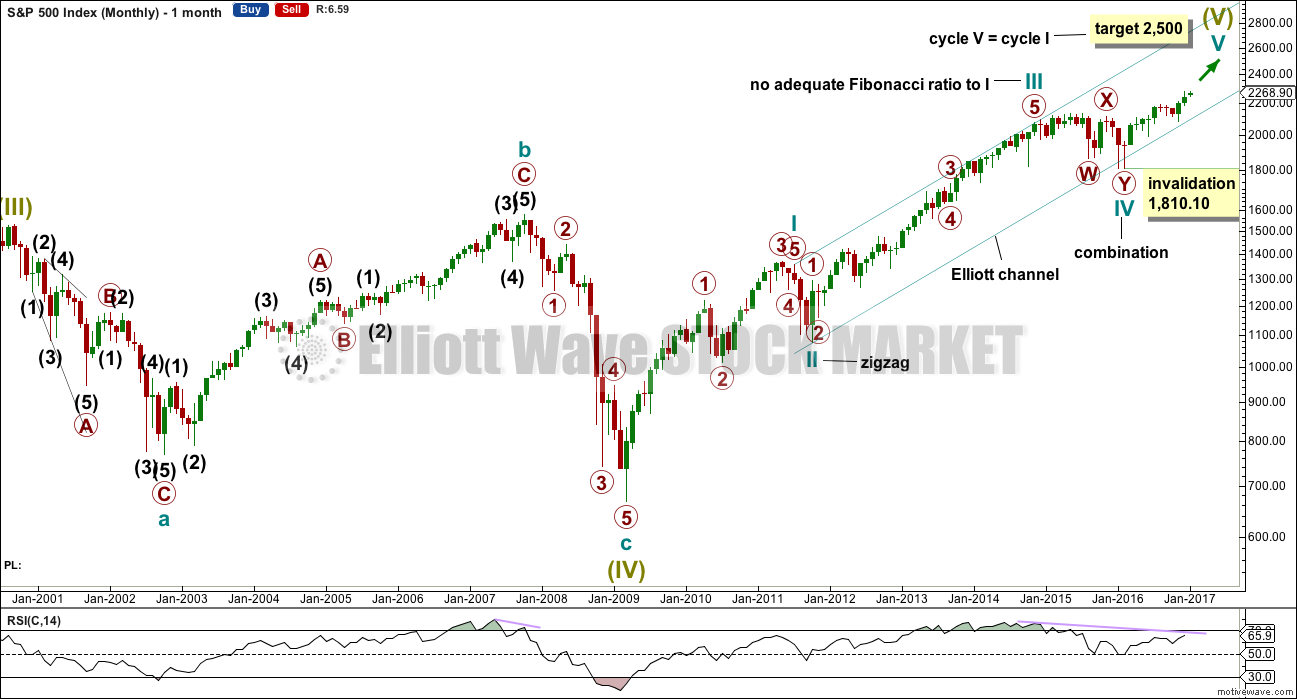
MONTHLY CHART
Click chart to enlarge.
The large expanded flat labelled Super Cycle wave (IV) completed a 8.5 year correction. Thereafter, the bull market continues for Super Cycle wave (V). The structure of Super Cycle wave (V) is incomplete. At this stage, it is subdividing as an impulse.
There is no Fibonacci ratio between cycle waves I and III within Super Cycle wave (V). This makes it more likely that cycle wave V will exhibit a Fibonacci ratio to either of cycle waves I or III. The most common ratio for a fifth wave is equality with the first wave, which gives a target at 2,500. The probability is increased with this target calculation being a round number.
The teal channel is drawn using Elliott’s first technique about an impulse. Draw the first trend line from the ends of cycle waves I to III (from the months of July 2011 to December 2014), then place a parallel copy on the low of cycle wave II. Cycle wave IV has found support very close to the lower edge of this channel, so the channel looks about right. The lower edge should continue to provide support, and the upper edge may provide resistance if price gets up that high. For the S&P500, its fifth waves commonly end mid way within these channels, so in due course a mid line may be added.
Copy this large channel over to weekly and daily charts, all on a semi log scale. The lower edge will be important.
Cycle wave II was a shallow 0.41 zigzag lasting three months. Cycle wave IV is now seen as a more shallow 0.28 double combination lasting 14 months. With cycle wave IV nearly five times the duration of cycle wave II, it should be over there.
Cycle wave I lasted 28 months (not a Fibonacci number), cycle wave II lasted a Fibonacci 3 months, cycle wave III lasted 38 months (not a Fibonacci number), and cycle wave IV lasted 14 months (one more than a Fibonacci 13).
If the target for cycle wave V is for it to be equal in length with cycle wave I, then it may also be expected to be about equal in duration. So far cycle wave V is in its eleventh month. After this month, a further sixteen months to total twenty eight seems a reasonable expectation, or possibly a further ten months to total a Fibonacci twenty one.
Within cycle wave V, no second wave correction may move beyond the start of its first wave below 1,180.10.
While the current bull market looks strong and healthy in terms of rising breadth and strong buying power, it does exhibit long term divergence with RSI at the monthly chart level. This on its own is not an indicator of a trend change as divergence can persist for long periods of time, but it is a concern for the long term health of this market. This supports the Elliott wave count which sees an impending trend change at Super Cycle degree in coming months.
WEEKLY CHART
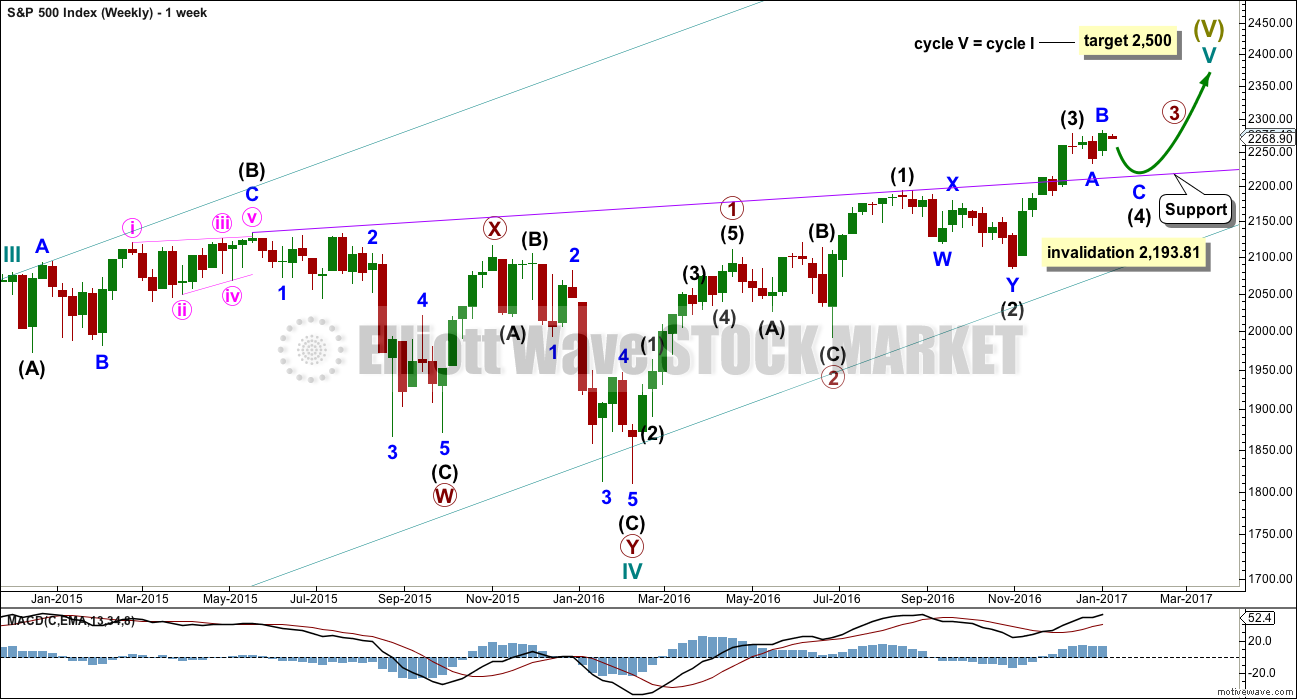
Click chart to enlarge.
The teal channel is copied over from the monthly chart. If price gets down that low, then it may find support finally there.
A new trend line is added in purple. This trend line is the strongest piece of technical analysis on all charts and should be expected to provide strong support. Intermediate wave (4) may end about there.
The structure of cycle wave V is changed. It looks like it has begun with two overlapping first and second waves for primary waves 1 and 2, and intermediate waves (1) and (2).
Intermediate wave (3) is complete and slightly shorter than intermediate wave (1). This will limit intermediate wave (5) to no longer than equality in length with intermediate wave (3) at 193.74 points.
Intermediate wave (4) is incomplete. It may not move into intermediate wave (1) price territory below 2,193.81.
DAILY CHART
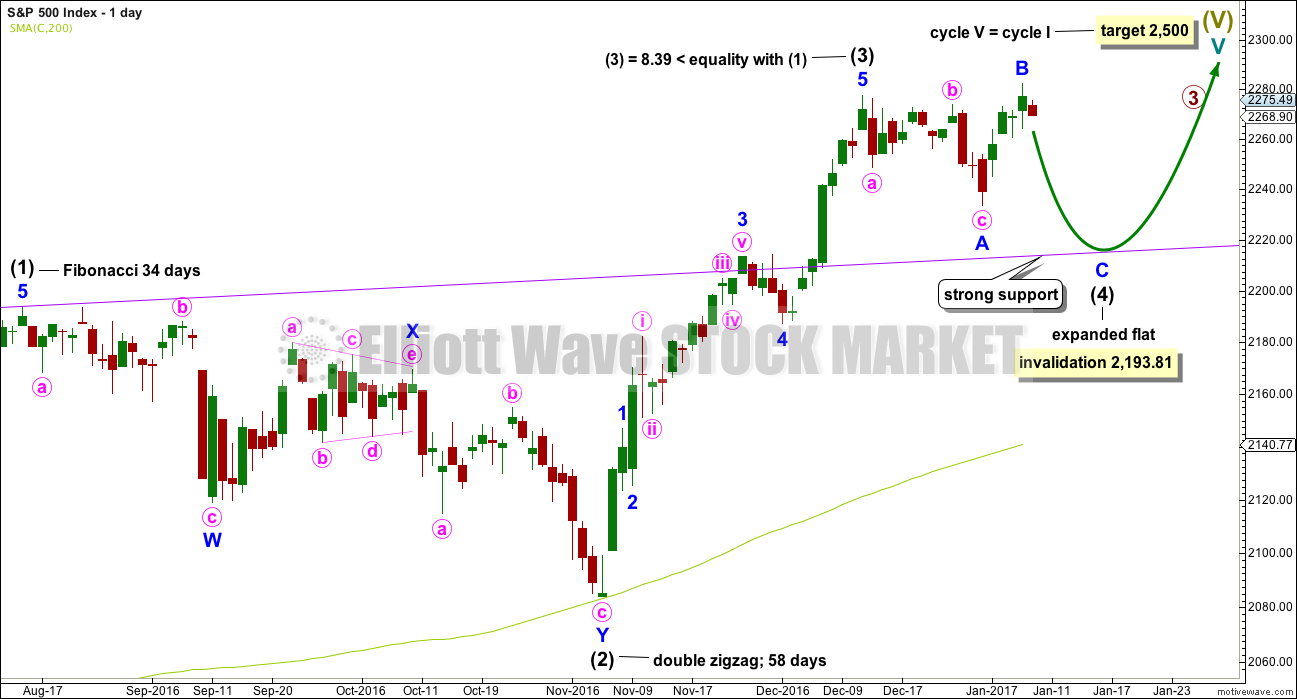
Click chart to enlarge.
Intermediate wave (4) is exhibiting alternation with intermediate wave (2). Intermediate wave (2) is a double zigzag and intermediate wave (4) is an incomplete expanded flat.
Along the way up to the final target at 2,500 a more time consuming fourth wave correction for primary wave 4 would be expected for this wave count.
HOURLY CHART
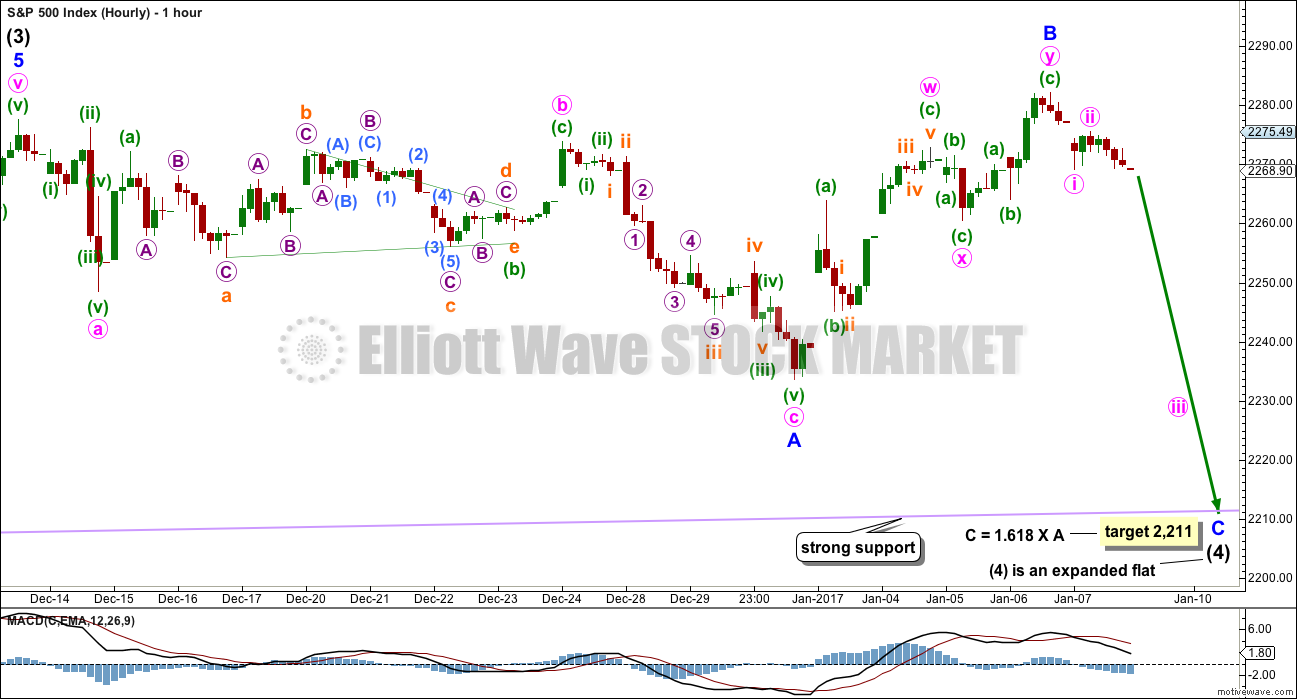
Click chart to enlarge.
The hourly chart today shows all the structure of intermediate wave (4) so far. Tomorrow it will zoom in to show only the structure of minor wave C.
So far minor wave B may be a complete double zigzag. Downwards movement for Monday’s session has taken price too far below a channel which was previously drawn about minor wave B, so this looks like a new wave down and not a correction within a continuing upwards wave.
If the target calculated is wrong, it may be too low. Price may find strong support just above the target at the lilac trend line.
Minor wave C must complete as a five wave structure. It is extremely likely to make at least a slight new low below the end of minor wave A at 2,233.62 to avoid a truncation and a very rare running flat.
TECHNICAL ANALYSIS
WEEKLY CHART
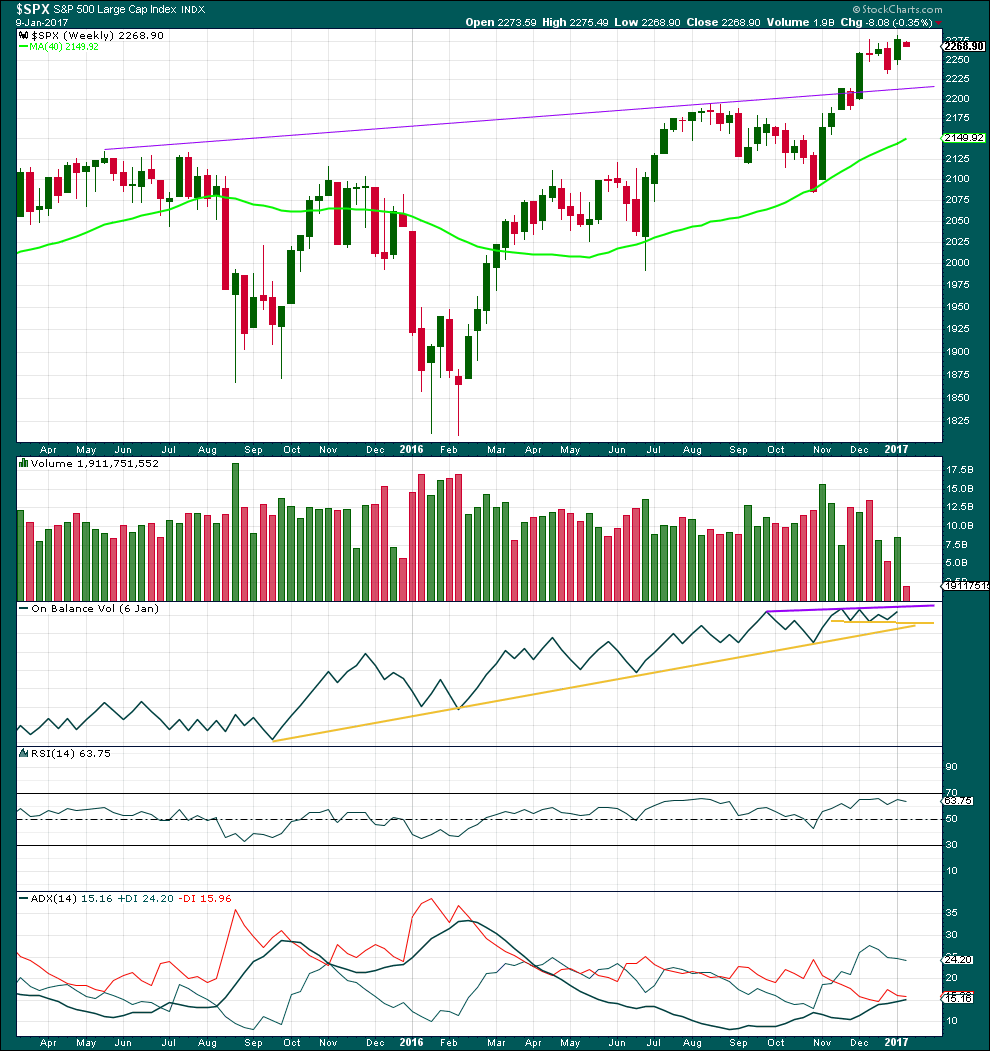
Click chart to enlarge. Chart courtesy of StockCharts.com.
The last three complete weeks show lighter volume than the three weeks prior. This makes sense as a consolidation. Volume has an upwards bias and makes sense if the larger trend is still up.
On Balance Volume is still constrained below resistance and above support.
RSI is not extreme and still in bullish territory.
ADX indicates a new trend; it is above 15 and rising. The trend is up.
DAILY CHART

Click chart to enlarge. Chart courtesy of StockCharts.com.
What looked like a small pennant pattern in last analysis has failed. Normally, these are reliable continuation patterns, but they do not always work. Nothing in technical analysis is certain; it is all an exercise in probability.
Sideways movement over the last seventeen days has brought ADX down from extreme. ADX is declining, indicating the market is not currently trending. The +DX line remains above the -DX line, so only a consolidation is indicated.
ATR is low and overall flat. This is normal for a consolidation.
There is divergence between price and RSI at the last high. This supports the Elliott wave count, which sees the last high the end of a B wave. B waves will typically show a lack of strength.
On Balance Volume remains constrained below resistance and above support.
Stochastics is overbought and also exhibits multiple regular bearish divergence with price at highs. This supports the Elliott wave count.
MACD is bearish.
Bollinger Bands are tightly contracted. This also supports the Elliott wave count. This is more normal for a consolidation.
The picture for the S&P today looks fairly clear: price is consolidating. Expect support at the purple trend line on the weekly TA chart.
VOLATILITY – INVERTED VIX CHART
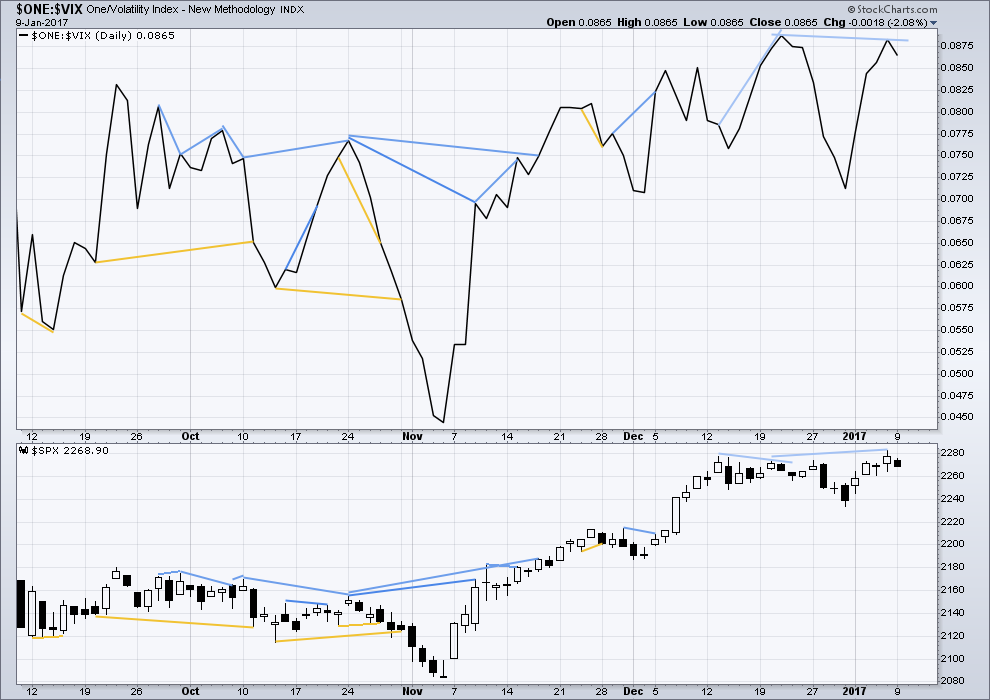
Click chart to enlarge. Chart courtesy of StockCharts.com.
There are a few instances of multi day divergence between price and inverted VIX noted here. Bearish divergence is blue. Bullish divergence is yellow. It appears so far that divergence between inverted VIX and price is mostly working to indicate short term movements spanning one or two days. While this seems to be working more often than not, it is not always working. As with everything in technical analysis, there is nothing that is certain. This is an exercise in probability.
Some short term divergence today between price and inverted VIX is noted. This is regular bearish divergence. This supports the Elliott wave count short term. Some downwards movement for one or two days may result.
BREADTH – AD LINE
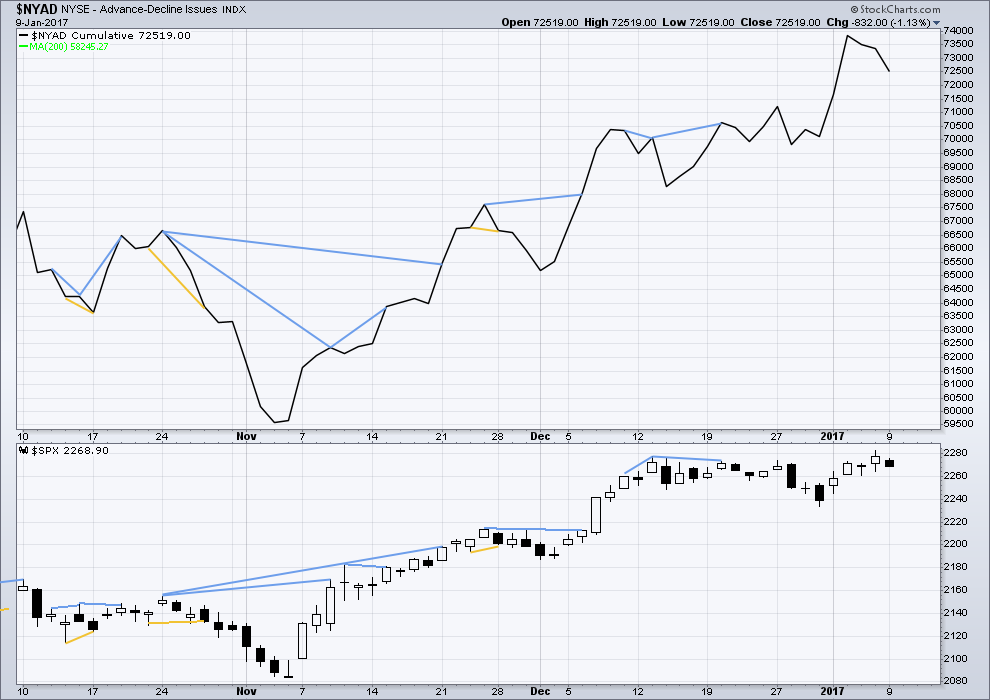
Click chart to enlarge. Chart courtesy of StockCharts.com.
Short term bullish and bearish divergence is again working between price and the AD line to show the direction for the following one or two days.
There was an instance of single day divergence yesterday between price and the AD line: while price moved to a new high and completed a green / white candlestick, the AD line declined slightly. This has now been followed by one day of downwards movement. It may need at least one more day before it is resolved.
I subscribe to Lowry’s On Demand service to keep a track of the health of the market in terms of market breadth. They conclude that this bull market is strong and healthy, and is likely to continue for at least three or four months, if not substantially longer.
DOW THEORY
The DJIA, DJT, S&P500 and Nasdaq have made new all time highs in December of 2016. This confirms a bull market continues.
This analysis is published @ 09:44 p.m. EST.
BB compression suggests an explosive C wave to the downside. I think we are going to slightly overshoot the purple trendline.
That’s entirely possible. The last test on November 25th to 30th wasn’t perfectly at the trend line.
Did not get a good entry trigger on my trades today. I do not like these cagey false breakdowns that reverse higher. In fact I scalped the move higher with a few SPY226 calls bought at the lows as the move down looked fishy Waiting for a true impulsive move down.
Happy and Healthy New Year everyone!!! Good to have you back Lara
Thanks Sundeep! It’s great to be back at work.
Great to have you back Lara!
The 1.618 re-tracement target of wave A at 2211 for wave C offers some excellent trade set ups. I plan on executing two trades to take advantage of the move down. One is via the Janauary 18 expiration SPY 27 strike puts. The other will be via
a January 20 25/27 bearish call spread, with the idea of closing the 25 strike short call while remaining positioned for the resumption of the bullish trend. I will post my fill prices.
This week’s price action also has the potential to finally and fully negate the idea of an ED with a reversal prior to a break below 2193.81. If that break happens, it will probably shake out a few bulls just prior to the commencement of the other zig zag. Frankly, it would be the wiliest thing this long-in-the-tooth bull could do to keep folk off balance.
Cheers Verne, it’s good to be back 🙂
I’m keeping my ED charts updated weekly and will publish if they look good, but as you say they so far don’t. The best one I have needs a new low below 2,193.81 which of course the wave count published here would be invalidated by.
It’s technically possible though, so I’m watching the idea.
Welcome Back
Bull- Bear lets all make some Profit!!
Happy Trading Folks
Thanks Paresh 🙂
I’m looking forward to making some money out of this market. If minor C completes and looks good, and price remains at or above the trend line, then I think we’ll have a gift from Mr Market.
Mr Market and I have some scores to settle this year.