
A small shallow correction was expected to end and be followed by upwards movement. This is what happened. Targets remain the same at this time.
Summary: The weight of evidence today is overly bullish. Corrections are an opportunity to join the trend.
The target for a short term interruption to the trend is now calculated using classic technical analysis methods, at 2,755 to 2,760. But if this is wrong, it may not be high enough; the next target is an Elliott wave target at 2,858.
The only indicator giving any bearish signal is VIX, but that has not been very reliable lately.
Last monthly and weekly charts are here. Last historic analysis video is here.
The biggest picture, Grand Super Cycle analysis, is here.
MAIN ELLIOTT WAVE COUNT
WEEKLY CHART
Click chart to enlarge.
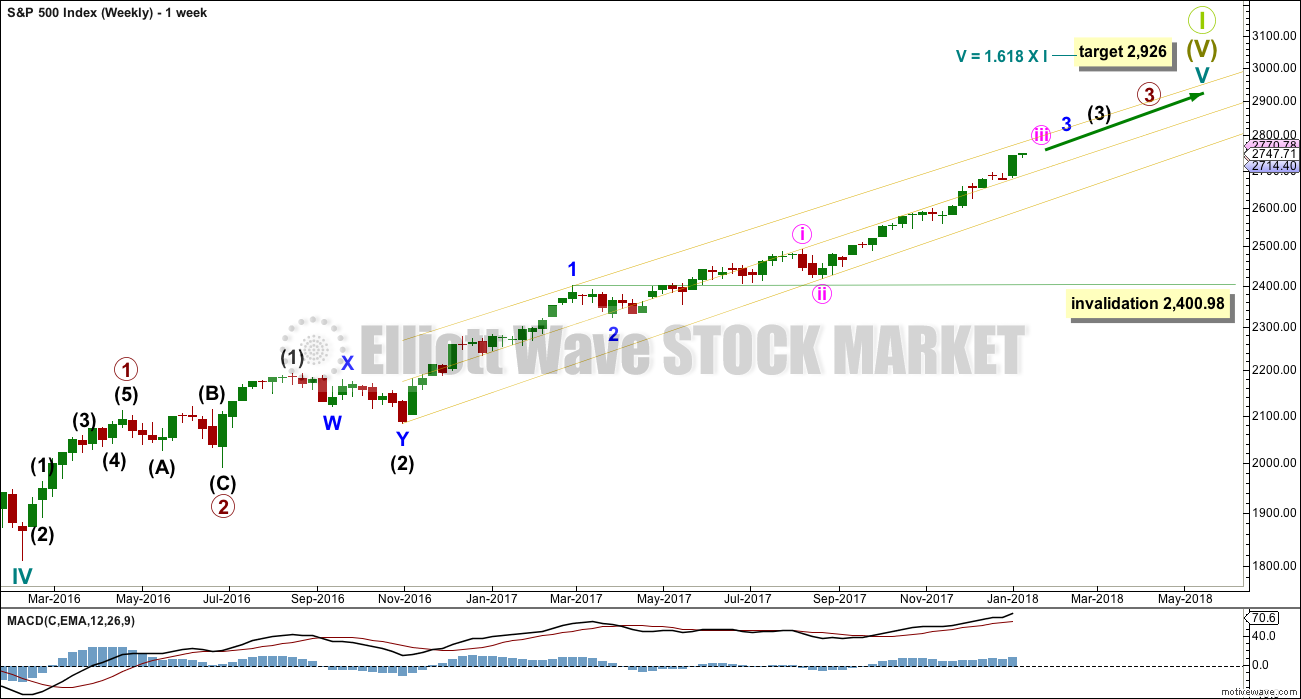
Cycle wave V must complete as a five structure, which should look clear at the weekly chart level. It may only be an impulse or ending diagonal. At this stage, it is clear it is an impulse.
Within cycle wave V, the third waves at all degrees may only subdivide as impulses.
Within cycle wave V, the corrections for primary wave 2 and intermediate wave (2) both show up clearly, both lasting several weeks. The respective corrections for intermediate wave (4) and primary wave 4 should also last several weeks, so that they show up at weekly and monthly time frames. The right proportions between second and fourth wave corrections give a wave count the right look. This wave count expects to see two large multi week corrections coming up.
Cycle wave V has passed equality in length with cycle wave I, which would be the most common Fibonacci ratio for it to have exhibited. The next most common Fibonacci ratio would be 1.618 the length of cycle wave I.
Intermediate wave (3) has passed equality in length with intermediate wave (1). It has also now passed both 1.618 and 2.618 the length of intermediate wave (1), so it may not exhibit a Fibonacci ratio to intermediate wave (1). The target calculation for intermediate wave (3) to end may have to be done at minor degree; when minor waves 3 and 4 are complete, then a target may be calculated for intermediate wave (3) to end. That cannot be done yet.
When minor wave 3 is complete, then the following multi week correction for minor wave 4 may not move into minor wave 1 price territory below 2,400.98. Minor wave 4 should last about four weeks to be in proportion to minor wave 2. It may last about a Fibonacci three, five or even eight weeks if it is a time consuming sideways correction like a triangle or combination. It may now find support about the mid line of the yellow best fit channel. If it does find support there, it may be very shallow. Next support would be about the lower edge of the channel.
A third wave up at four degrees may be completing. This should be expected to show some internal strength and extreme indicators, which is exactly what is happening.
DAILY CHART
Click chart to enlarge.
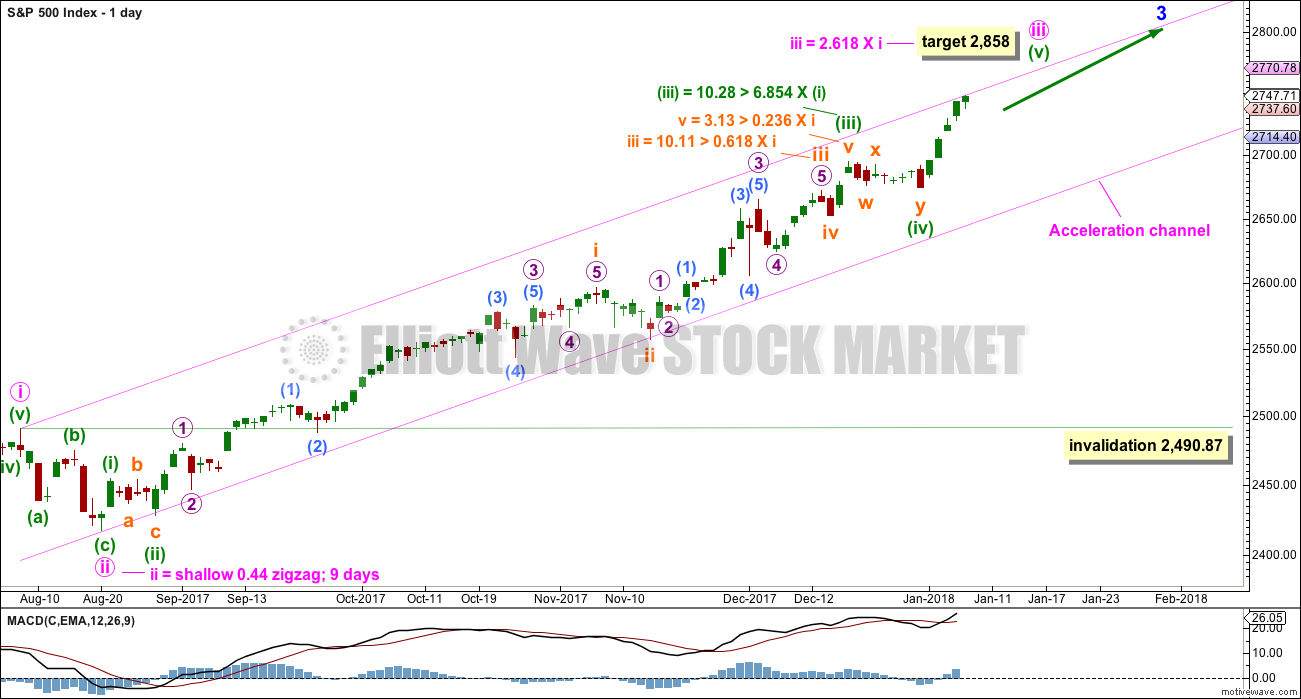
The degree of labelling within the last multi day correction is now moved down one degree.
Keep redrawing the acceleration channel as price continues higher: draw the first line from the end of minute wave i to the last high, then place a parallel copy on the end of minute wave ii. When minute wave iii is complete, this would be an Elliott channel and the lower edge may provide support for minute wave iv.
Minute wave iii has passed 1.618 the length of minute wave i. The next Fibonacci ratio in the sequence is used to calculate a target for it to end.
Minute wave iv may not move into minute wave i price territory below 2,490.87. However, minute wave iv should most likely remain within the channel and not get close to the invalidation point. It may end within the price territory of the fourth wave of one lesser degree, that of minuette wave (iv) from 2,694.97 to 2,673.61.
HOURLY CHART
Click chart to enlarge.
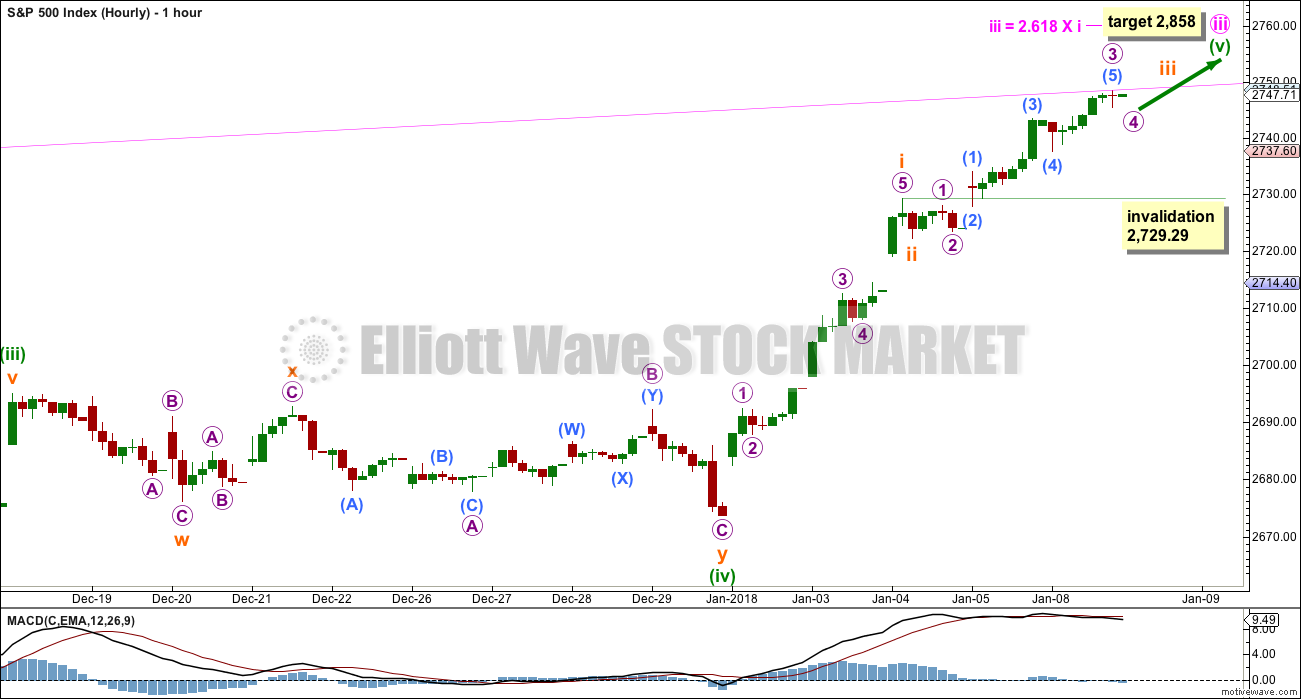
Minuette wave (iv) will subdivide well as a double combination. This provides alternation with the possible zigzag of minuette wave (ii).
Attention now should turn to the structure of minuette wave (v). This movement does not fit well at all into a channel no matter how it is drawn.
Assume minuette wave (v) is incomplete while price remains above 2,729.29. A break below the invalidation point would see the wave count changed to seeing minute wave iii over.
Subminuette wave iv may not move into subminuette wave i price territory below 2,729.29.
TECHNICAL ANALYSIS
WEEKLY CHART
Click chart to enlarge. Chart courtesy of StockCharts.com.
Indicators should be expected to be extreme as a third wave at four degrees comes to an end.
When third waves are ending they fairly often will show weakness at the weekly chart level. There is no evidence of weakness at this time.
DAILY CHART
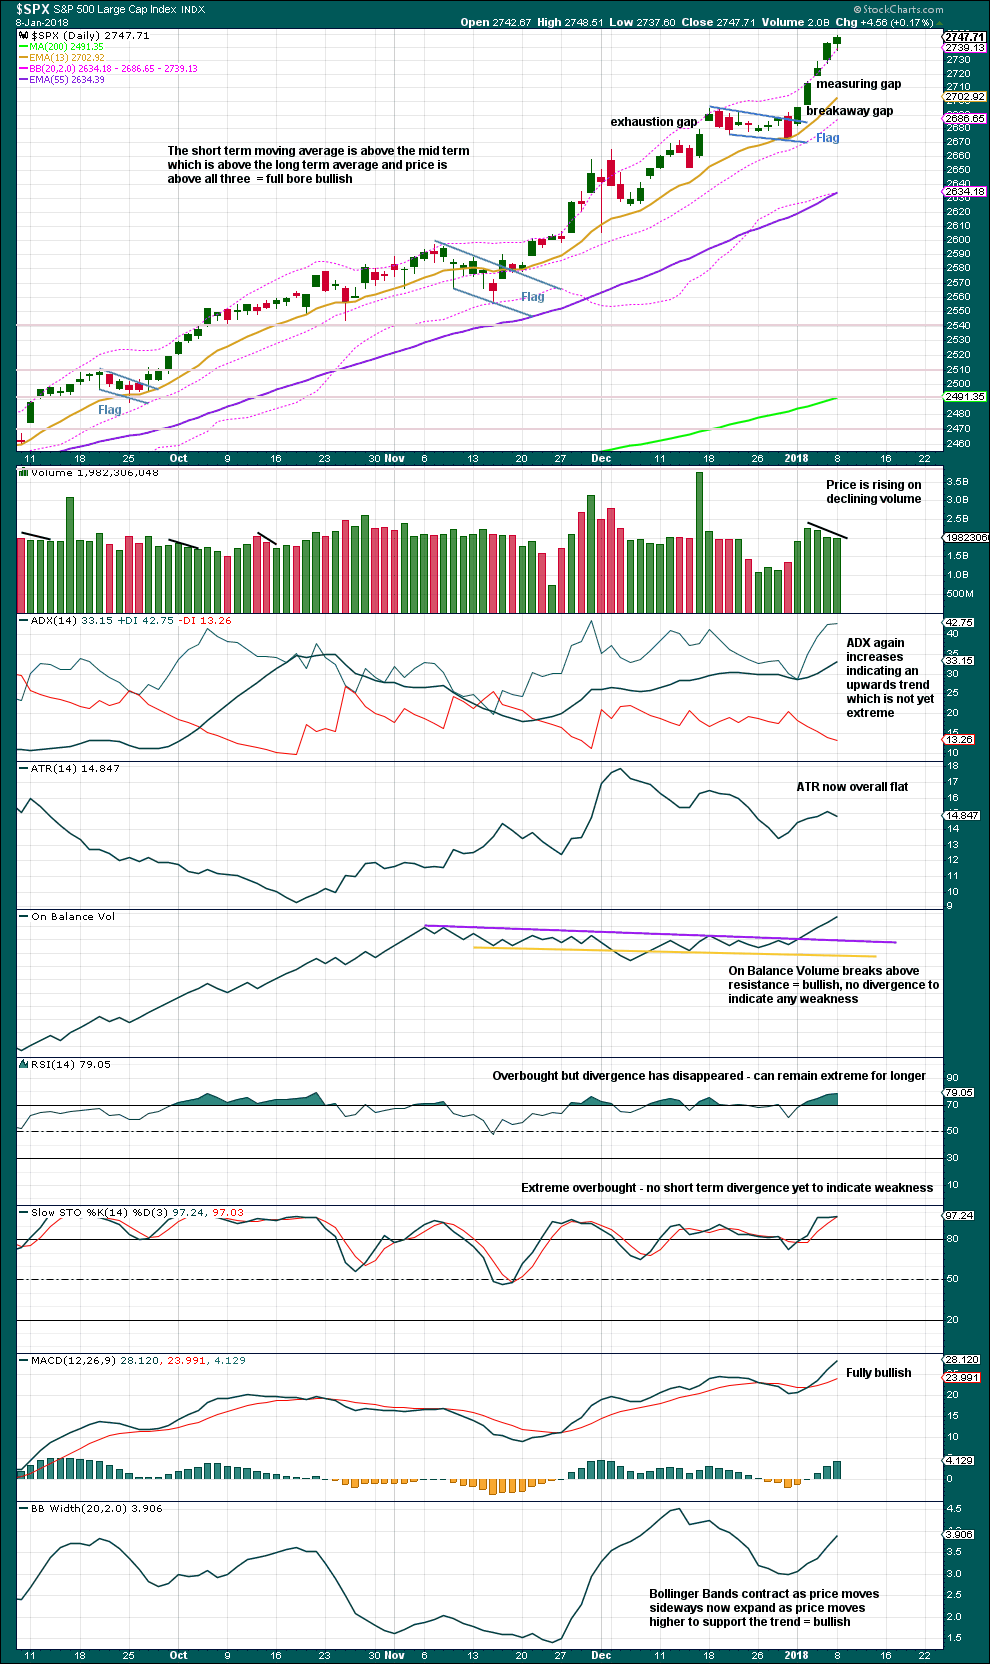
Click chart to enlarge. Chart courtesy of StockCharts.com.
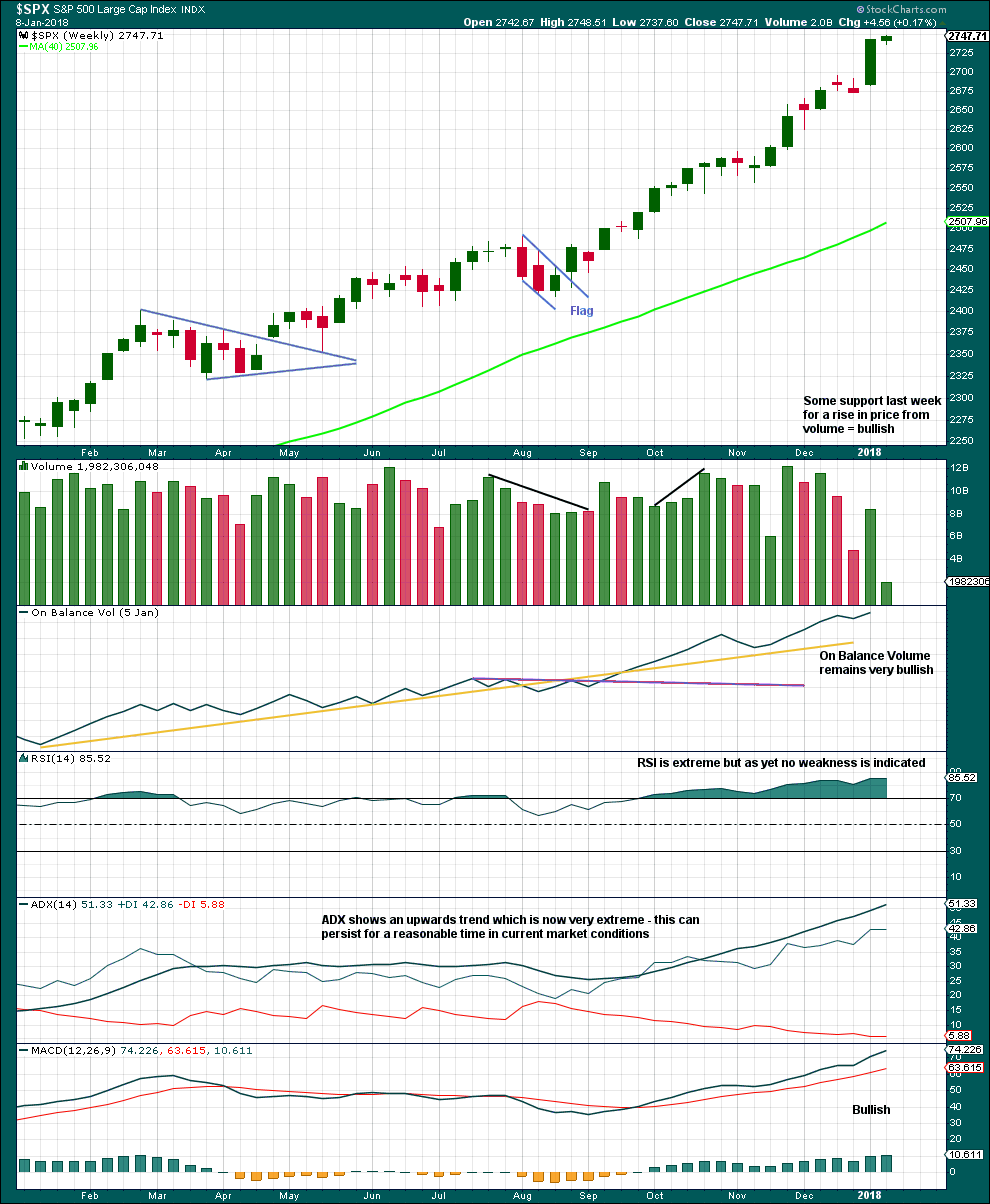
The upwards day of the 2nd of January was a classic upwards breakout with support from volume.
The measuring gap gives a target at 2,760. The flag gives a target at 2,755.
Volume not offering good support to this upwards movement has been a feature of this market for many months now. Upwards movement does not appear to be requiring support from volume in current market conditions; price seems to be drifting upwards due to a lack of overhead resistance. It may continue to do so for a reasonable period of time.
The trend clearly remains up. This chart is very bullish. As yet, there is no evidence of exhaustion. Extreme indicators may remain extreme for weeks yet.
Trading advice: Do not focus on a possible market crash. While that could happen, it ignores what is in front of us right now and has been in front of us for some time. Focus on the trend, which is up. Use corrections as opportunities to join the trend. Be prepared to revise targets upwards as price nears targets, unless the market is showing weakness.
Allow the market a little room to move; corrections may last a few days. As Douglas Adams says, “Don’t Panic”.
VOLATILITY – INVERTED VIX CHART
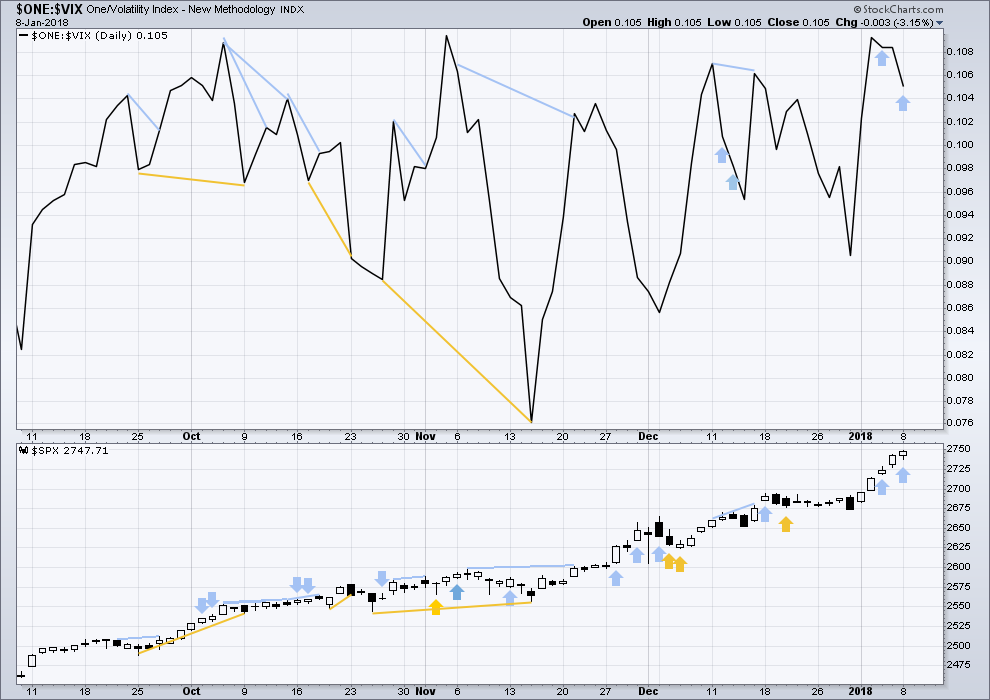
Click chart to enlarge. Chart courtesy of StockCharts.com.
So that colour blind members are included, bearish signals will be noted with blue and bullish signals with yellow.
Normally, volatility should decline as price moves higher and increase as price moves lower. This means that normally inverted VIX should move in the same direction as price.
There are two very recent instances of bearish divergence between price and VIX: on both the 4th and 8th of January price moved higher but inverted VIX moved lower. The rise in price on these days did not come with a normal corresponding decline in market volatility. Volatility has increased.
This is the only reasonable bearish signal at this time. It indicates traders should be cautious, that a small correction may be coming sooner rather than later.
BREADTH – AD LINE
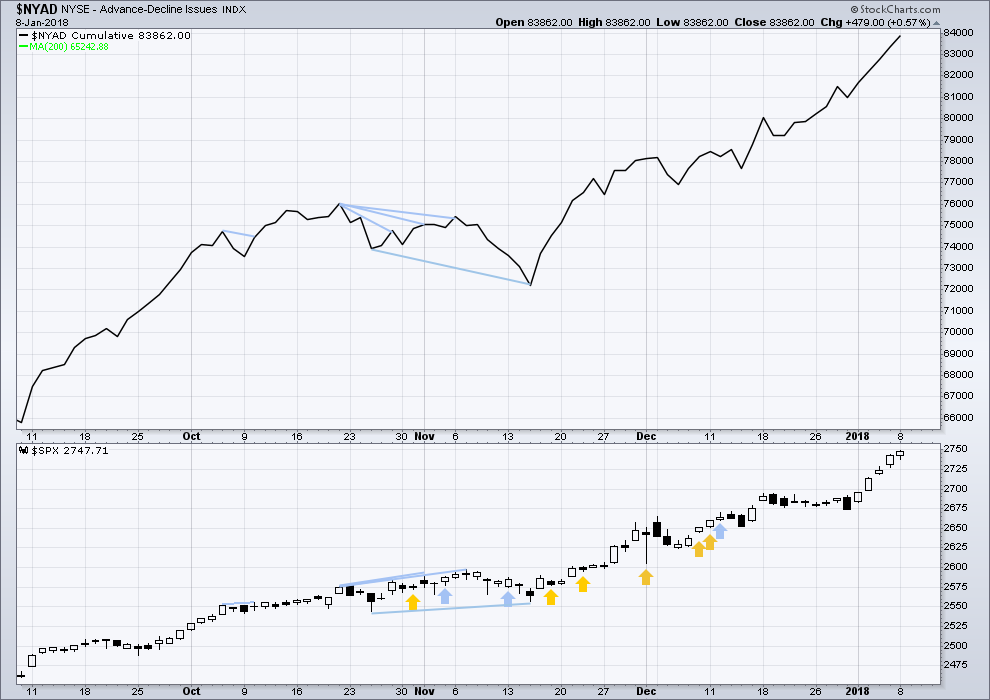
Click chart to enlarge. Chart courtesy of StockCharts.com.
There is normally 4-6 months divergence between price and market breadth prior to a full fledged bear market. This has been so for all major bear markets within the last 90 odd years. With no longer term divergence yet at this point, any decline in price should be expected to be a pullback within an ongoing bull market and not necessarily the start of a bear market.
Only mid and large caps made new all time highs last week. There is some weakness with small caps unable to make new all time highs; this is slightly bearish.
Breadth should be read as a leading indicator. At this stage, there is no divergence between price and the AD line to indicate weakness. The AD line is extremely bullish. This rise in price has strong support from market breadth.
DOW THEORY
The S&P500, DJIA, DJT and Nasdaq last week all made new all time highs. The ongoing bull market is confirmed.
The following lows need to be exceeded for Dow Theory to confirm the end of the bull market and a change to a bear market:
DJIA: 17,883.56.
DJT: 7,029.41.
S&P500: 2,083.79.
Nasdaq: 5,034.41.
Charts showing each prior major swing low used for Dow Theory are here.
Published @ 12:08 a.m. on 9th January, 2018.
updated hourly chart:
as it continues the labelling within it may change, the only part of this labelling that I’m comfortable with today is subminuette i, that looks very good
keep redrawing the acceleration channel
I’m making a tentative attempt to draw a channel about this upwards movement, it doesn’t fit so well because it’s actually curved, not straight
subminuette i was 55.78 points in length, so subminuette iii would reach only equality with i at 2,827.88. it hasn’t got there yet, so let us expect it to be at least equal with i and most likely longer
Is this a typo, or am I misunderstanding: “subminuette i was 55.78 points in length, so subminuette iii would reach only equality with i at 2,827.88”
When I add 55.78 to the bottom of the subminuette ii, I get to roughly 2781. Am I doing that wrong?
At this rate, we’ll be there by Friday.
I don’t believe this rate is going to continue. Some larger players are going to want to take some profits off, and will drive a 4.
A test of 2557 pivot is highly likely, however I believe even a move of that magnitude will set off the very real structural problems with the market and end up with a much larger event. Many of the larger players I know have folded and left already. Central Bankers and Vangard large and in charge.
I am keeping a sharp eye on SNB. If there is even a hint of them cashing in you know what that means.
I agree with your take. I think an ordinary correction at this stage is untenable…
https://www.zerohedge.com/news/2018-01-09/snb-made-55-billion-2017-foreign-currency-holdings-soared
Remember, “Old Man’s” DOW 25,549.24 and time Jan 2018 still in play.
Today’s High 25,439.78 within 109.46 of it. Close Enough to consider it met.
That’s it as all other ranges above that he calls “Crazy” “Commodity Like”.
So we shall see.
As I thought, a little profit taking. I don’t expect a whole heck of a lot though, and already have the start of a new upro position. Eyeing XIV as well, but I’ll hold for a more clear bottom, since XIV has such high volatility itself. We only expect a subminuette 4 here; tomorrow should exhaust it, but we’ll see.
So sorry everybody, and well spotted Kevin.
That was a mistake. I get 2,777.88
2,722.20 + 55.68 = 2,777.88
That’s the way I feel lately as soon as I execute a trade… it either immediately goes the other way or does so in a few days.
Then I pick two individual stocks… the one that makes the bigger move RIG, I get stopped out of and then goes on to make a big move over the course of the next 3 weeks. Still made money on AG… but didn’t do what I had expected.
Just can’t do anything right when I actually execute a trade. The paper trades do great.
Very difficult market for disciplined trading. SPX is likely the easiest way to get the best bang for the buck for the remaining upside, paired with either vix calls or tail protection in long dated puts.
3 of a 3 of a 3 of a 3 of a 5.
Wow! A lot of 4’s headed our way soon!!!! And 5’s.
“Fasten your seat belts please, the ride may be getting bumpy from here on in.”
I could use the first of those 4’s right about now; holding VIX calls that are steadily losing premium. Need a little SPX sell off to spike the VIX so I can at least get out BE. Wouldn’t you know when I finally buy VIX calls, the market goes into it’s most steady and consistent rise in what, all of history? Well maybe not but it feels like it. Just a little sell off is all I ask for….maybe it’s starting???
Did the same and have my first ever Vix Position.
Will be out if we get this 4 and BE
Then another leg up in the S&P would be most welcome
I COULD solve this for us Paresh.
All I have to do is go long SPX. Guaranteed instant 4 time. Maybe it’s the right thing to do…in the end, the SPX will come back, and in the interim, out of the VIX calls. I hate going both ways but…aarrgggh. Okay, bought just a little UPRO, let’s see what happens here. Looks like the bull is setting up to charge again…
Added to my SPX long and now the truck is full!!
It has been my best trade since 2008-2009
Stops in place if we get a change of trend but happy to go along with the trend is your friends for the near term
What vehicle are you using for the SPX long?
first of the year,,, Happy New Year,,,, sqwauk,, that was my noise maker
Happy New Year Doc!