
Downwards movement for Wednesday’s session has closed the last gap, which must now be considered as an exhaustion gap.
A new Elliott wave count with excellent Fibonacci ratios, and a new short term target, is presented today.
Summary: A small fourth wave correction may continue for a few more days overall, and may end within the fourth wave of one lesser degree price territory from 2,671.88 to 2,652.01. When there is more structure to analyse within this possible fourth wave, then a smaller target may be calculated.
For the very short term, look for a small bounce tomorrow that may not move above 2,694.97.
Last monthly and weekly charts are here. Last historic analysis video is here.
The biggest picture, Grand Super Cycle analysis, is here.
MAIN ELLIOTT WAVE COUNT
WEEKLY CHART
Click chart to enlarge.
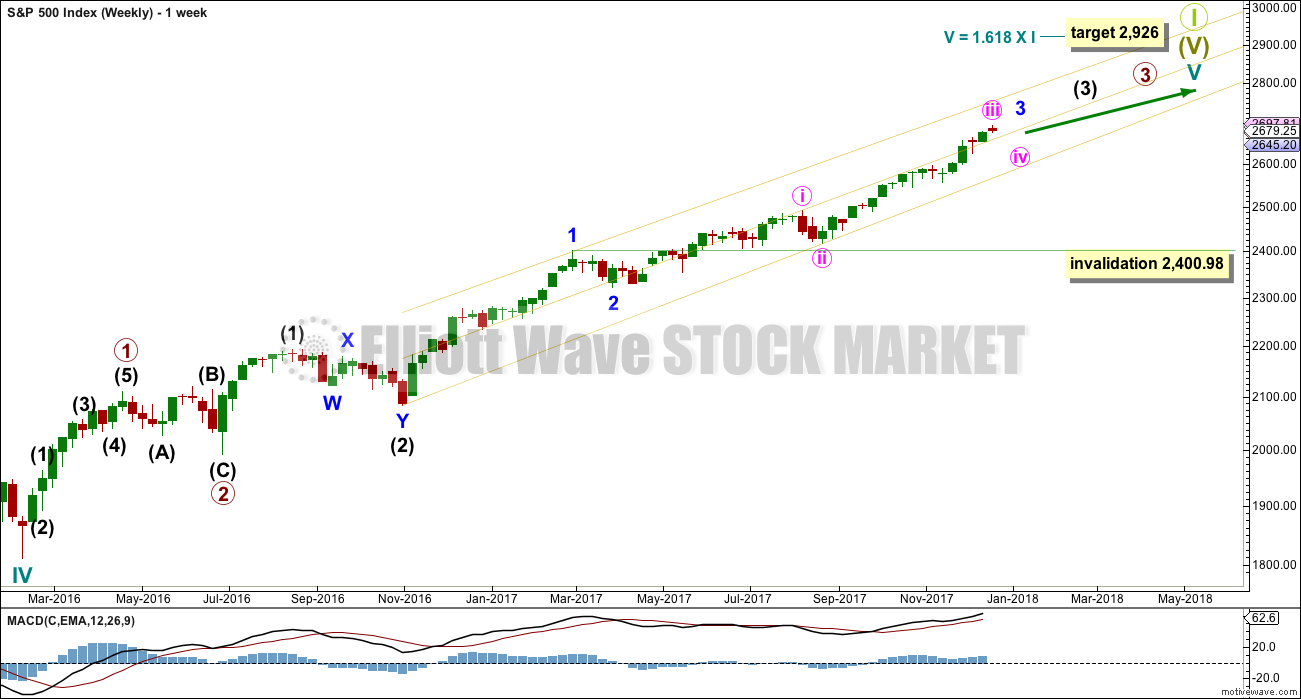
Cycle wave V must complete as a five structure, which should look clear at the weekly chart level. It may only be an impulse or ending diagonal. At this stage, it is clear it is an impulse.
Within cycle wave V, the third waves at all degrees may only subdivide as impulses.
Within cycle wave V, the corrections for primary wave 2 and intermediate wave (2) both show up clearly, both lasting several weeks. The respective corrections for intermediate wave (4) and primary wave 4 should also last several weeks, so that they show up at weekly and monthly time frames. The right proportions between second and fourth wave corrections give a wave count the right look. This wave count expects to see two large multi week corrections coming up.
Cycle wave V has passed equality in length with cycle wave I, which would be the most common Fibonacci ratio for it to have exhibited. The next most common Fibonacci ratio would be 1.618 the length of cycle wave I.
Intermediate wave (3) has passed equality in length with intermediate wave (1). It has also now passed both 1.618 and 2.618 the length of intermediate wave (1), so it may not exhibit a Fibonacci ratio to intermediate wave (1). The target calculation for intermediate wave (3) to end may have to be done at minor degree; when minor waves 3 and 4 are complete, then a target may be calculated for intermediate wave (3) to end. That cannot be done yet.
When minor wave 3 is complete, then the following multi week correction for minor wave 4 may not move into minor wave 1 price territory below 2,400.98.
DAILY CHART
Click chart to enlarge.
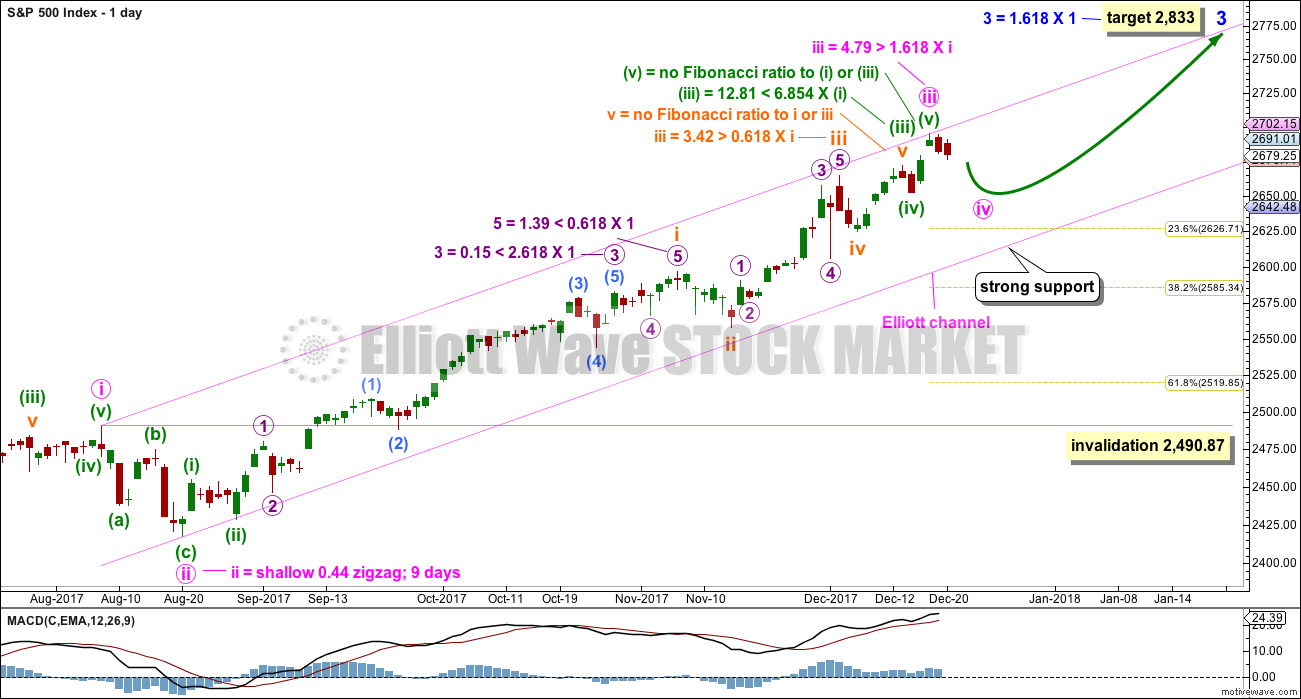
This wave count is new today.
This new wave count looks at the possibility that minute wave iii may have ended at the last high and minute wave iv may have just arrived.
There are even better Fibonacci ratios in this new wave count when compared to the one published yesterday, which is now an alternate.
Draw an Elliott channel about this impulse. Minute wave iv may find strong support and remain within the channel, if it gets down that low. Minute wave iv may end within the price territory of the fourth wave of one lesser degree; minuette wave (iv) has its territory from 2,671.88 to 2,652.01.
Minute wave ii lasted nine days. For the wave count to have the right look (reasonable proportion), minute wave iv may be expected to most likely last either a Fibonacci five, eight, or possibly even thirteen days.
Minute wave ii was a zigzag. To exhibit alternation minute wave iv may most likely be a flat, combination or triangle. But it may also be a zigzag though because the S&P does not always exhibit perfect alternation and a zigzags is the most common corrective structure.
Minute wave iv may not move into minute wave i price territory below 2,490.87.
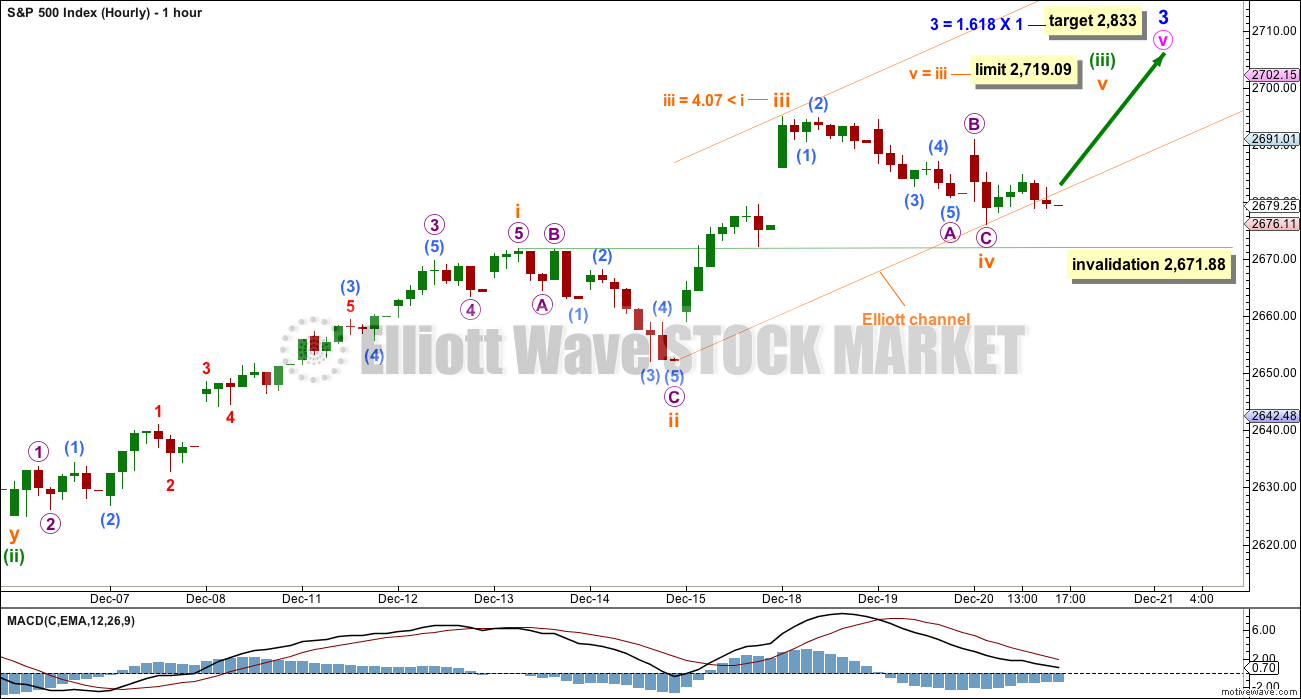
HOURLY CHART
Click chart to enlarge.
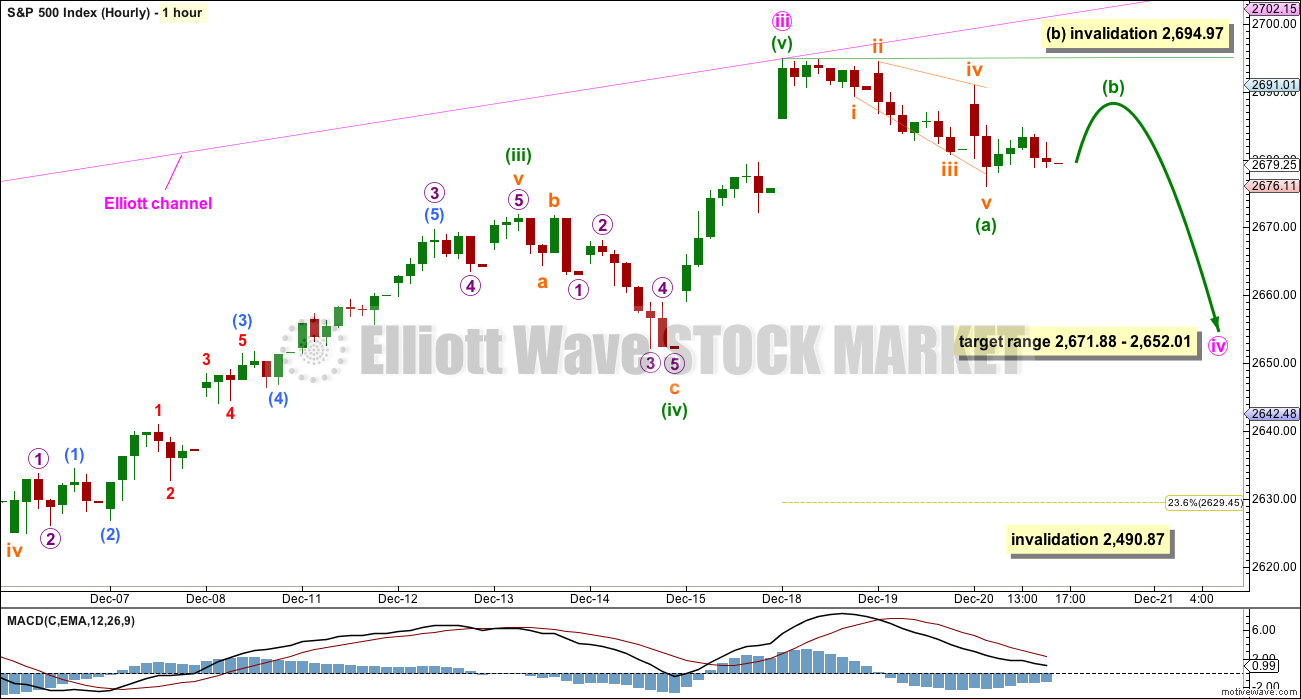
At this stage, I will leave the degree of labelling open to being reduced. It is possible that minuette wave (a) is complete as labelled, or this may be moved down one degree and only subminuette wave a or i may be complete.
Either way, the last wave down will subdivide as a leading expanding diagonal.
There are more than 23 possible corrective structures that minute wave iv may take. As it unfolds, the labelling within the structure will change. It is impossible at the early stages to tell which structure may unfold, so the focus should be on identifying when it may be complete and not on all the possible small movements within it.
At this stage, it looks most likely incomplete.
Confidence in this main wave count may be had if price makes a new low below 2,671.88
ALTERNATE DAILY CHART
Click chart to enlarge.
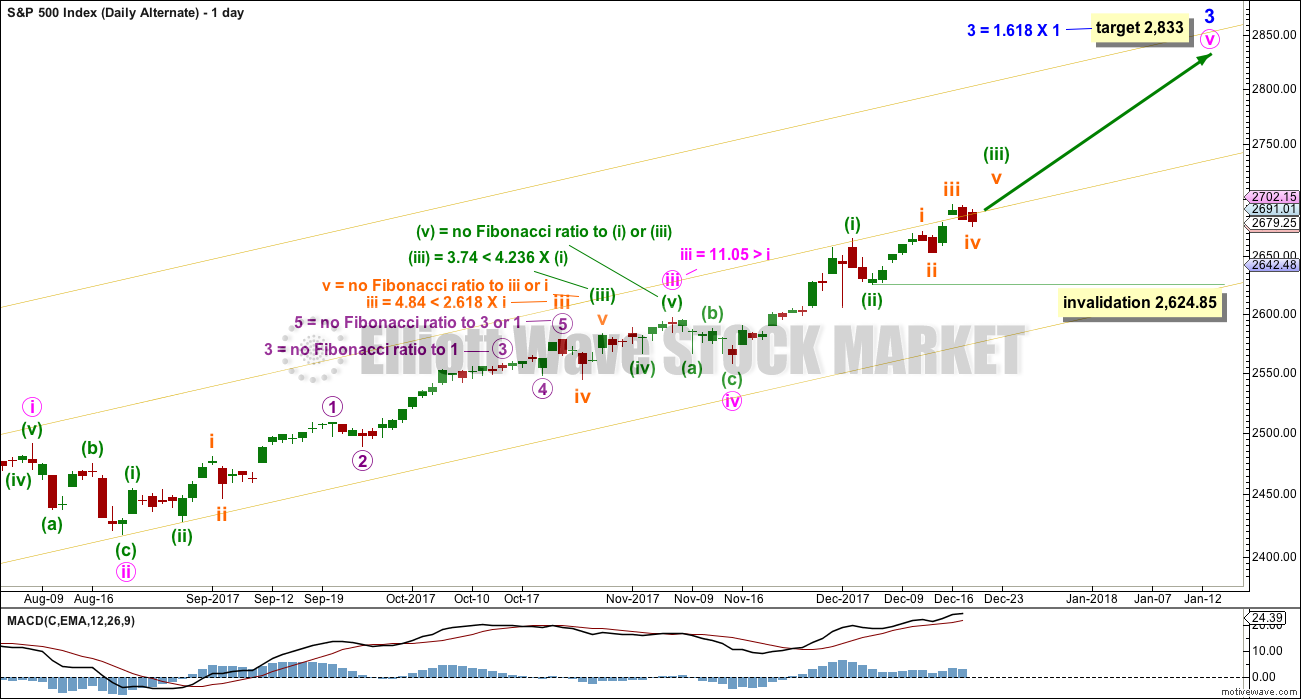
Both daily charts are identical to the high labelled minute wave i, and the low labelled minute wave ii.
This wave count was the main wave count yesterday. Today, it is an alternate.
The daily chart looks at the middle and end of minor wave 3. There are some excellent Fibonacci ratios within this wave count.
Minor wave 3 may only subdivide as an impulse. Within minor wave 3, minute waves i, ii, iii and iv may all be complete. The final fifth wave of minute wave v then looks incomplete.
Minute wave iii is longer than minute wave i, so minute wave v is not limited. Minute wave iii will meet the core Elliott wave rule stating it may not be the shortest actionary wave.
The target for minor wave 3 expects to see the most common Fibonacci ratio for a third wave.
There is good proportion here between the corrections of minute waves ii and iv: minute wave ii lasted nine days and minute wave iv lasted six days. Both show up at the weekly chart level, and the wave count has the right look.
Within minute wave v, minuette waves (i) and (ii) may be complete. Minuette wave (iii) may be incomplete.
Minuette wave (iii) may only subdivide as an impulse. Within minuette wave (iii), subminuette waves i and ii may be complete. Within subminuette wave iii, no second wave correction may move beyond the start of its first wave below 2,652.01.
ALTERNATE HOURLY CHART
Click chart to enlarge.
This wave count follows on from yesterday’s main wave count. If a new all time high is seen, then this would be again the only wave count.
Subminuette wave iv may not move into subminuette wave i price territory below 2,671.88.
The target for minor wave 3 may now be too high. At the limit for subminuette wave v, minuette wave (iii) would be 94.24 points in length. Minuette wave (i) was 107.74 points in length, so minuette wave (iii) would be shorter than minuette wave (i). This would limit minuette wave (v) to no longer than 94.24 points, which would probably yield a target reasonably below 2,833.
For this wave count, when minuette waves (iii) and (iv) are complete, then the target for minuette wave (v) to complete the whole of minor wave 3 may be calculated at minuette degree. At that stage, the target would change.
TECHNICAL ANALYSIS
WEEKLY CHART
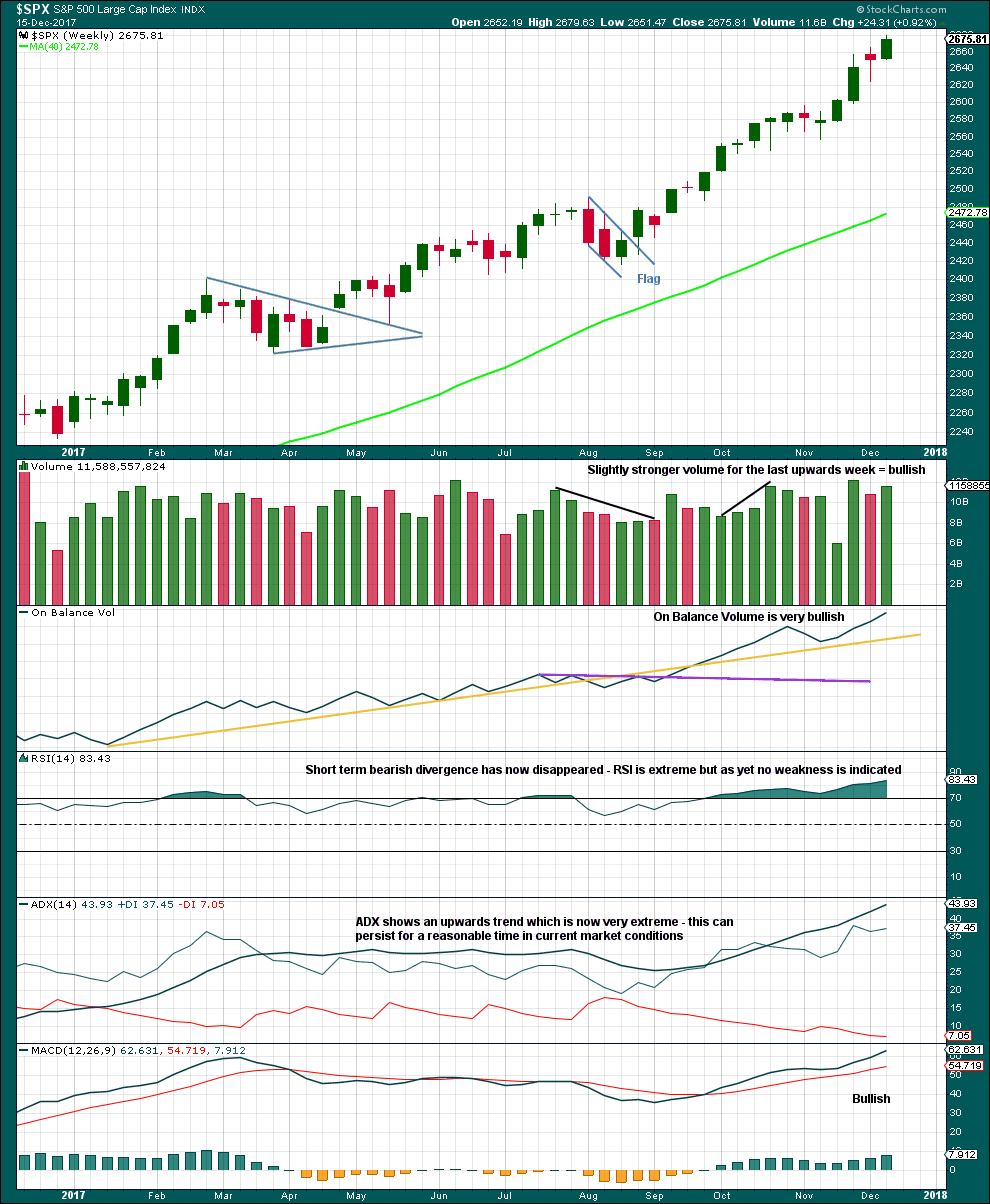
Click chart to enlarge. Chart courtesy of StockCharts.com.
There is still no candlestick reversal signal at highs. The trend is now very extreme and overstretched, but this can continue for longer before price is ready to turn.
Overall, at this time frame, this market remains very bullish.
DAILY CHART
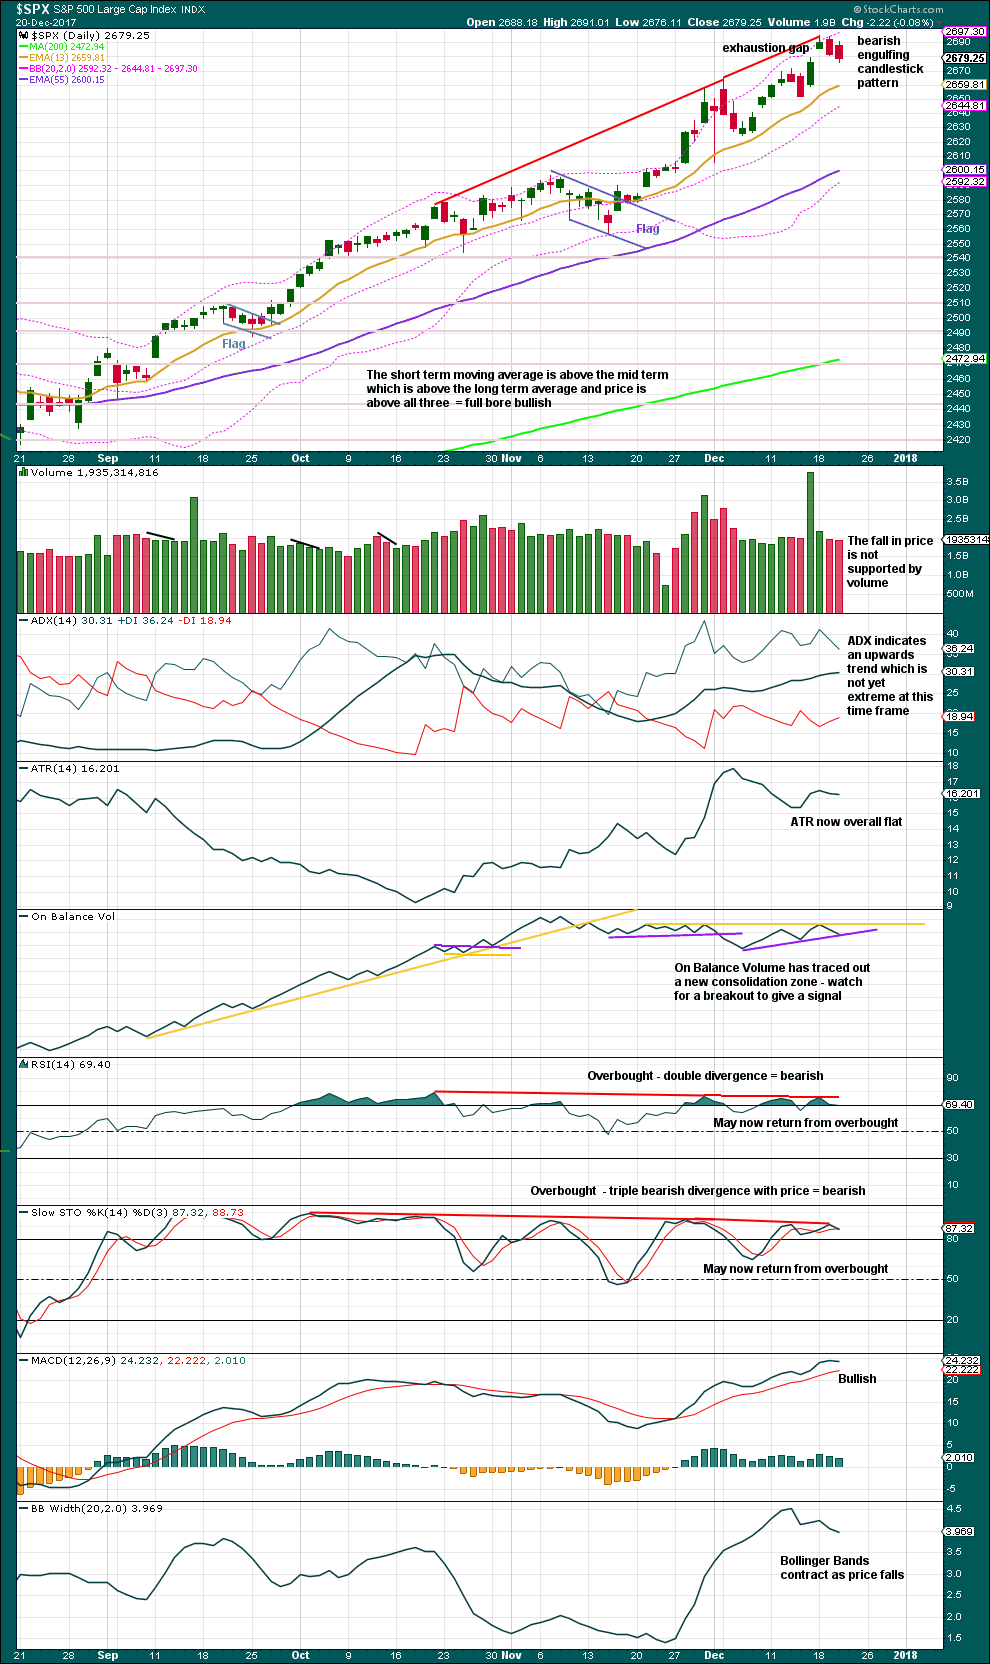
Click chart to enlarge. Chart courtesy of StockCharts.com.
The last gap is now closed. It is now indicated as an exhaustion gap and not a breakaway gap. This is a bearish signal, at least for the short term.
The last few signals from On Balance Volume were bearish. RSI and Stochastics are bearish. But ADX indicates the trend is not yet extreme at this time frame.
The trend could still continue for longer before price turns, but today there is now a little more bearish indication with the closing of the last gap.
VOLATILITY – INVERTED VIX CHART
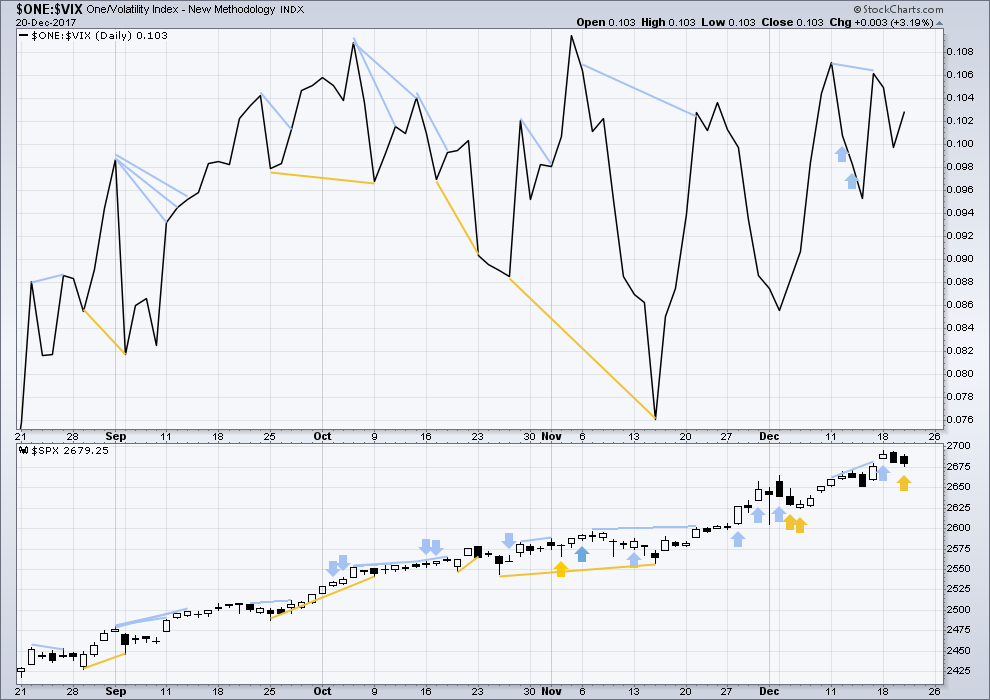
Click chart to enlarge. Chart courtesy of StockCharts.com.
So that colour blind members are included, bearish signals will be noted with blue and bullish signals with yellow.
Normally, volatility should decline as price moves higher and increase as price moves lower. This means that normally inverted VIX should move in the same direction as price.
Price moved lower today, but inverted VIX moved higher. The fall in price did not come with a normal corresponding increase in volatility. This divergence is bullish and supports at least a little more upwards movement here.
BREADTH – AD LINE
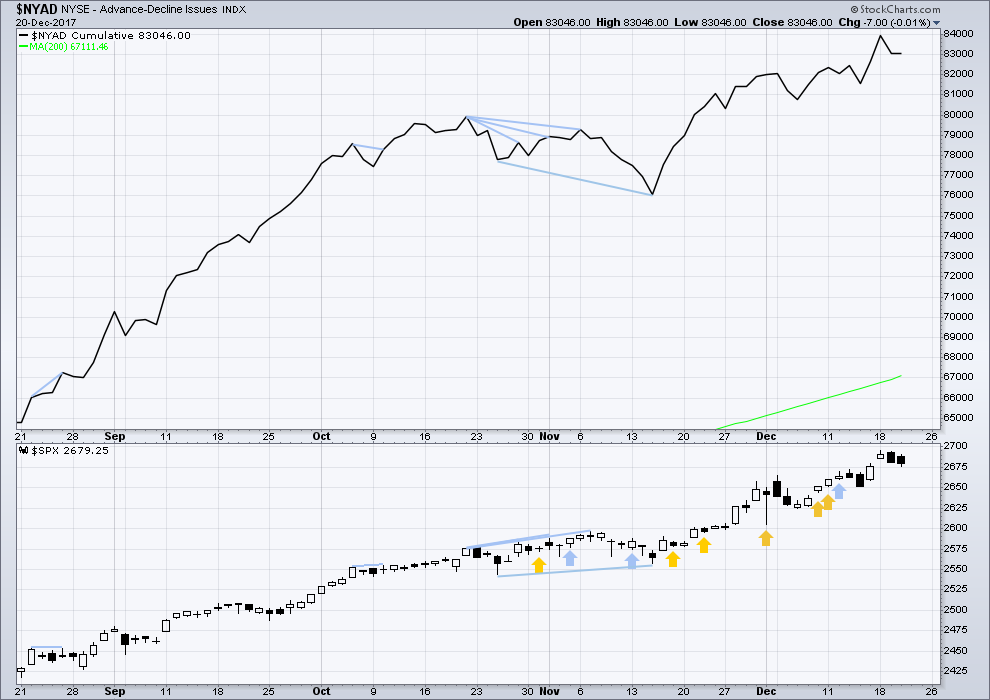
Click chart to enlarge. Chart courtesy of StockCharts.com.
There is normally 4-6 months divergence between price and market breadth prior to a full fledged bear market. This has been so for all major bear markets within the last 90 odd years. With no longer term divergence yet at this point, any decline in price should be expected to be a pullback within an ongoing bull market and not necessarily the start of a bear market.
Only large caps made new all time highs last week. There is some weakness with mid and small caps unable to make new all time highs; this is bearish.
Breadth should be read as a leading indicator. The fall in price today came with the AD line remaining flat. This is not enough difference to be read as divergence, so it will be interpreted as neutral.
DOW THEORY
The S&P500, DJIA and Nasdaq last week all made new all time highs. DJT now also made a new all time high, confirming the ongoing bull market.
The following lows need to be exceeded for Dow Theory to confirm the end of the bull market and a change to a bear market:
DJIA: 17,883.56.
DJT: 7,029.41.
S&P500: 2,083.79.
Nasdaq: 5,034.41.
Charts showing each prior major swing low used for Dow Theory are here.
Published @ 07:37 p.m. EST.
Either a three up is complete, or a five up is developing.
If a five up is developing then micro 4 may not move into micro 1 price territory:
Which means that a new low below 2,684.80 invalidates the first chart above (which is from the alternate wave count) and confirms this chart below (from the main wave count).
I hope that makes sense!
This should be useful in trading. If this analysis is right then long positions may not want to be held if price moves below 2,684.80 and for the more adventurous a short position may be tried.
To the upside, a new ATH means the structure is incomplete and price should keep on going up to the target.
I note the bottom of the late day move down was exactly the 62% retrace of the Dec 18-20 high-low swing. Might hold.
is it possible that wave iii could end in the range of 2712 – 2833?
Or are you still thinking like 2773 – 2833?
I know you don’t know the answer but would anything above 2712 still fit into as you would say the right look on the chart.
Thank You
All comments welcome
which degree of labelling are you referring to Eric? if you aren’t sure then name the colour and I’ll figure it out
Im referring to the end of wave 3
is it possible that it could end between 2712 – 2833?
there are multiple third waves, which colour label? the blue one on the daily chart? or the maroon one on the weekly chart? or the green one on the alternate daily chart?
so you see why I need you to be more specific?
Im color deficient so i don’t see the different colors.
okay, so which chart and how is it shown?
on the weekly chart there are two third waves ending: the first (the next to end) is intermediate degree (3) (three with brackets)
after that primary 3 – 3 with a circle around it
on the daily chart the next one to end is minor 3 (no brackets nor circle, just 3)
on the daily alternate chart minuette (iii) (roman numerals with brackets)
which one of those Eric?
When you say a multi week correction is coming for wave 4
Do mean Wave 4 from the 2009 Low or
do you mean we are in Wave 5 now from the 2009 lows and these are just subwaves in the big wave 5?
I mean we are in a fifth wave currently which began at the 2009 low
within that fifth wave impulse there should soon be a big fourth wave correction for intermediate (4)
these are just subwaves in the big fifth wave
the big fifth wave is cycle wave V.
I think though your comment refers to minor wave 4?
that too should be a multi week correction, but only about 4 to 6 weeks
Sorry guys, I’ve gone ahead and deleted a bunch of comments.
Pretty much anything to do with Trump will be deleted, and anything that classifies large groups of people as less than others on the basis of political beliefs or geography.
In those comments were some pieces of interesting information and some interesting links.
Unfortunately that’s all gone too.
I am sorry for it, but I’m going to moderate hard on this so that we retain a harmonious environment for trading here.
I am sorry for removing comments that people here spent time crafting with links to back up points made. I think it had to be done though.
As you were.
Bitcoin on my chart (I look at GBTC) has now lost 50% of it’s value over the last 3-4 days. High of 3523, now at 1813. No surprise! But price will stabilize and a new 5 wave up will start, sooner or later. Some people out there who recently raised money to buy bitcoin are going to have a very unhappy holiday.
Bitcoin’s made an important new swing low and breached a channel….
I’ll update my charts today and post probably in comments of the next analysis for all
Come on “Old Man” be spot on!
For the snowflakes. I am old and he is older than me by at least a decade… So I can use the term.
LOL
what’s old Joseph? LOL I’m thinking I too may fit the description 🙂 🙂 🙂
58 < 1 year 3 mo from 60
ah ha
I’m not quite there yet… 🙂
The recent gaps up in TBT resulted from the the precipitous unwnding of leveraged positions. Those gaps will probably all get filled…. 😉
Thanks for helping convince me to bail on TBT yesterday. Nice exit!!
😉
Selling 1/4 TBT puts for 1.05, holding rest for more downside….
This is looking rather impulsive to the upside, again. Though maybe it’s an X wave…if it turns here at 2690 (76.4% retrace of Dec 18-20 high-low), my suspicions of that will grow.
VIX is acting divergently today. If it “corrects”, there should be a very nice pop in XIV/SVXY soon.
http://aspirecharteracademy.com/
Here’s the link Kevin, we’d be happy to accept your Holiday donation!
Yes, Merry Christmas to all!
and Happy Holidays to those that have other traditions.
I will be here throughout the next two weeks, even though there will be no analysis after the 24th.
Remember, certain stocks will bounce over the next two weeks as their tax loss selling subsides and investors re-boot them for 2018. AG is one of those. Will rally into mid to end January. Re-evaluate in that Jan range. But that is my main trade for the Holiday season.
Have a Healthy and Happy New Year as well if you are taking off.
Should have re-entered RIG… but the “Old Man’s” new report held me back for now on other individual stocks as RIG would probably trade with the market.
AG would move on it’s own at least into mid Jan.
Pray do tell; what is the Old Man of the sea envisioning these days? 🙂
“Throw-overs likely to end in this 91 point DJI range 24,808 – 24,899”. (report date 12-19 – night of).
In and out of this range the last 2 days.
Has other higher ranges but is calling them “crazy”.
BTW: I looked back 3 years on VIX and next 2 weeks pretty volatile.
2016: Week Starting:
12-19 H 12.52 L 10.93 C 11.44
12-26 H 14.68 L 11.84 C 14.04
2015:
12-21 H 20.21 L 14.45 C 15.74
12-28 H 20.39 L 15.63 C 18.21
2014:
12-22 H 16.88 L 14.01 C 14.50
12-29 H 20.14 L 15.06 C 17.79
Yep. Amazing to see this extended stay below 10.00
Just look at the ranges for VIX above for the last part of Dec 1st few days of Jan. for the last 3 years.
VIX at 9.57 right now and below 10 last 5 days.
Therefore, I have put on a volatility trade for the Holiday’s.
It looks like a low risk trade right here. But what do I know about VIX trades.
Thanks Joe. A very Merry Christmas to you as well!
Predictably, the banksters will now whipsaw the bulls. Buying DIA 248 puts for 0.38. 🙂
Sold remaining 247 DIA calls for 0.92. Holding TBT puts.
I read in yesterday’s comments where Joe announce AT&T would spend $1 Billion in 2018 for infrastructure etc. Shortly after I heard on TV that Comcast said they would spend $50 Billion over 5 years!
Folks, this may be just the beginning. I remember when President Reagan made the last major tax reform law cutting taxes. I was a young man in the construction business in Chicago. Business boomed and grew at an accelerating rate for years. It eventually led to a budget surplus under President Clinton.
Perhaps on New Year’s Eve many may be singing, “Happy Days Are Here Again”. Lets hope it proves true.
Oh, and yes, Happy Holidays!!! Except, by orders of the Supreme Leader, I think I’m required to say, Merry Christmas, I think in order to promote more purchasing and corporate profits, but as you all know, I’m paranoid. Lol!!!! Now back to the market….
Please don’t stay away…I would really miss you Doc…! 🙂
$1.6 Billion is physical CASH to Iran for one (Plane Loads). Still would like to know how he got his hands on that kind of physical cash. + Who authorized it. Didn’t know the President can direct cash or payments by ex. order without it being appropriated by Congress.
🙂
Awe. What’s up Doc? So you do have some friends with whom you can enjoy the Holy Day / Holiday. Good for you. So what are you having for dessert? Carrot cake?
We will have a full house from very young (2 1/2 years old) all the way to this old man who used to watch Bugs Bunny in black and white. Wow.
Carrot cake it is. Mind if I stop by with a few friends Doc? 🙂
BTW, carrot cake for appetizer, main course, AND dessert! 🙂
Please do stop by. Santa is going to be especially generous this year. He is rather wise. Gold bullion in every stocking!
24 CARROTS, that Gold bullion, no doubt! Eh Doc? 🙂
well looky there, its our group photo,,I am Elmer Fudd, we know who bugs is, the big guy in the back is Rodney, Joe is Yosemite sam,, lets see, Kevin is Porky Pig,,and I will leave it to you guys to figure out who the skunk is,, by the way, Lara took the photo. as you can see Joe and Kevin are actually great friends.
ROTFL
awesome
yeah, I’m definitely behind that camera!
perhaps the skunk is Olga,, hee hee,,,,no offense Olga, skunks are beautiful