
Price continues to move higher towards the targets calculated.
Summary: Upwards movement from the end of intermediate wave (2) on the 4th of November, 2016, is today totally reanalysed.
The new target for minor wave 3 to end is now at 2,833. Minor wave 4 may last a few weeks, possibly a Fibonacci three or five. Along the way up, to the end of minor wave 3, there may be another two corrections which may last about two or so days each.
Stops for long positions may be set just below 2,679.63.
The trend is up. Corrections are an opportunity to join the trend. The market is still extreme and overbought, but the structure is incomplete.
Last monthly and weekly charts are here. Last historic analysis video is here.
The biggest picture, Grand Super Cycle analysis, is here.
MAIN ELLIOTT WAVE COUNT
WEEKLY CHART
Click chart to enlarge.
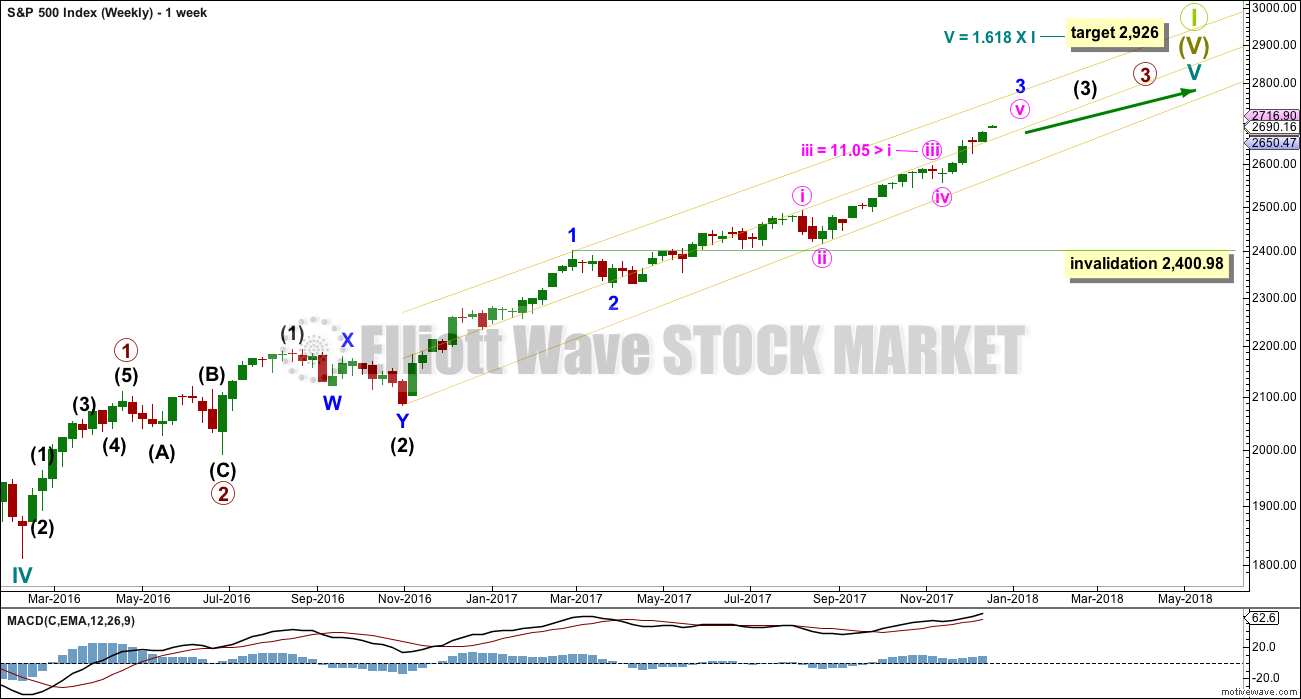
Cycle wave V must complete as a five structure, which should look clear at the weekly chart level. It may only be an impulse or ending diagonal. At this stage, it is clear it is an impulse.
Within cycle wave V, the third waves at all degrees may only subdivide as impulses.
Within cycle wave V, the corrections for primary wave 2 and intermediate wave (2) both show up clearly, both lasting several weeks. The respective corrections for intermediate wave (4) and primary wave 4 should also last several weeks, so that they show up at weekly and monthly time frames. The right proportions between second and fourth wave corrections give a wave count the right look. This wave count expects to see two large multi week corrections coming up, and the first for intermediate wave (4) may now be quite close by.
Cycle wave V has passed equality in length with cycle wave I, which would be the most common Fibonacci ratio for it to have exhibited. The next most common Fibonacci ratio would be 1.618 the length of cycle wave I.
The whole of intermediate wave (3) is reanalysed today.
Intermediate wave (3) has passed equality in length with intermediate wave (1). It has also now passed both 1.618 and 2.618 the length of intermediate wave (1), so it may not exhibit a Fibonacci ratio to intermediate wave (1). The target calculation for intermediate wave (3) to end may have to be done at minor degree; when minor waves 3 and 4 are complete, then a target may be calculated for intermediate wave (3) to end. That cannot be done yet.
The previous problem of poor proportion for minor wave 2 is now resolved. Minor wave 2 now lasts four weeks, which has a much better look at this time frame.
When minor wave 3 is complete, then the following multi week correction for minor wave 4 may not move into minor wave 1 price territory below 2,400.98.
DAILY CHART
Click chart to enlarge.
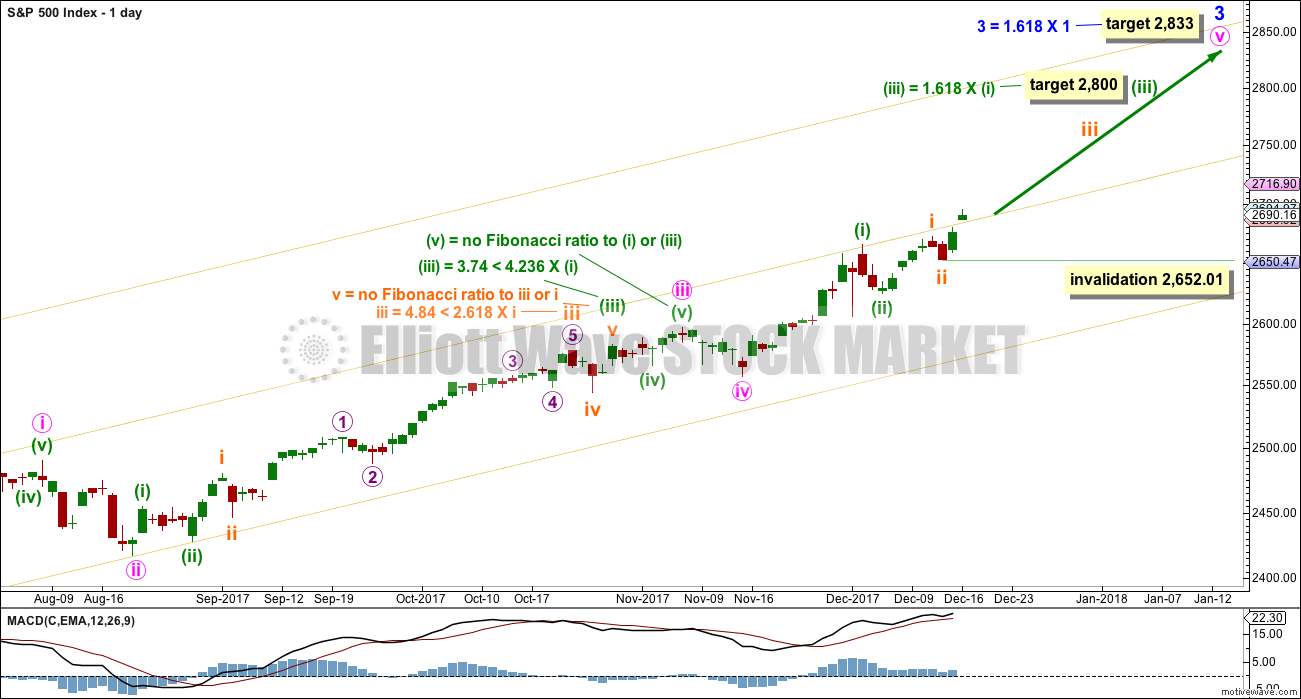
The daily chart looks at the middle and end of minor wave 3. There are some excellent Fibonacci ratios within this new wave count.
Minor wave 3 may only subdivide as an impulse. Within minor wave 3, minute waves i, ii, iii and iv may all be complete. The final fifth wave of minute wave v then looks incomplete.
Minute wave iii is longer than minute wave i, so minute wave v is not limited. Minute wave iii will meet the core Elliott wave rule stating it may not be the shortest actionary wave.
The targets for both minuette wave (iii) and minor wave 3 both expect to see the most common Fibonacci ratio for third waves.
There is good proportion here between the corrections of minute waves ii and iv: minute wave ii lasted nine days and minute wave iv lasted six days. Both show up at the weekly chart level, and the wave count has the right look.
Within minute wave v, minuette waves (i) and (ii) may be complete. Minuette wave (iii) may be incomplete.
Minuette wave (iii) may only subdivide as an impulse. Within minuette wave (iii), subminuette waves i and ii may be complete. Within subminuette wave iii, no second wave correction may move beyond the start of its first wave below 2,652.01.
HOURLY CHART
Click chart to enlarge.
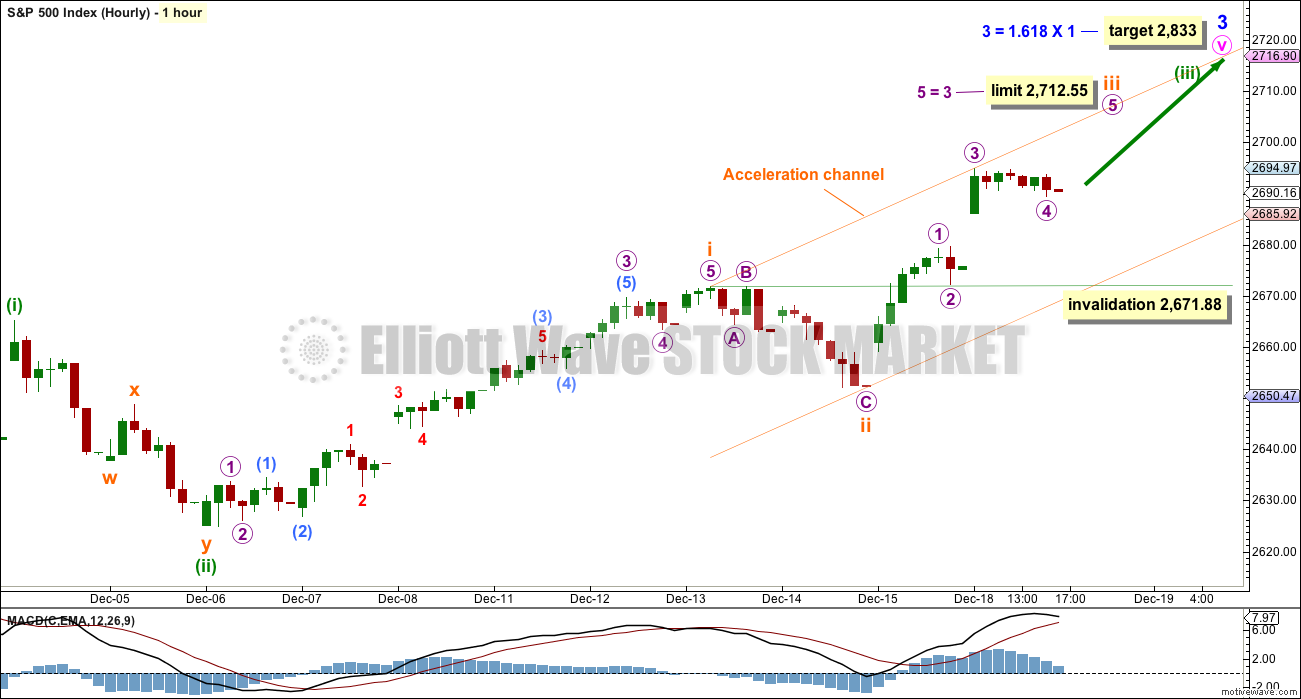
The hourly chart looks at all of minuette wave (iii) so far.
This wave count agrees with MACD. Upwards movement is showing an increase in upwards momentum, which looks like a third wave.
Subminuette wave iii may only subdivide as an impulse. Within subminuette wave iii, micro waves 1 through to 4 may be complete. If this labelling is correct, then micro wave 3 is slightly shorter than micro wave 1. This limits micro wave 5 to no longer than equality in length with micro wave 3, so that micro wave 3 is not the shortest actionary wave and the core Elliott wave rule is met.
The limit at 2,712.55 would see subminuette wave iii longer than subminuette wave i.
When subminuette wave iii is complete, then the following correction for subminuette wave iv may not move into subminuette wave i price territory below 2,671.88.
TECHNICAL ANALYSIS
WEEKLY CHART
Click chart to enlarge. Chart courtesy of StockCharts.com.
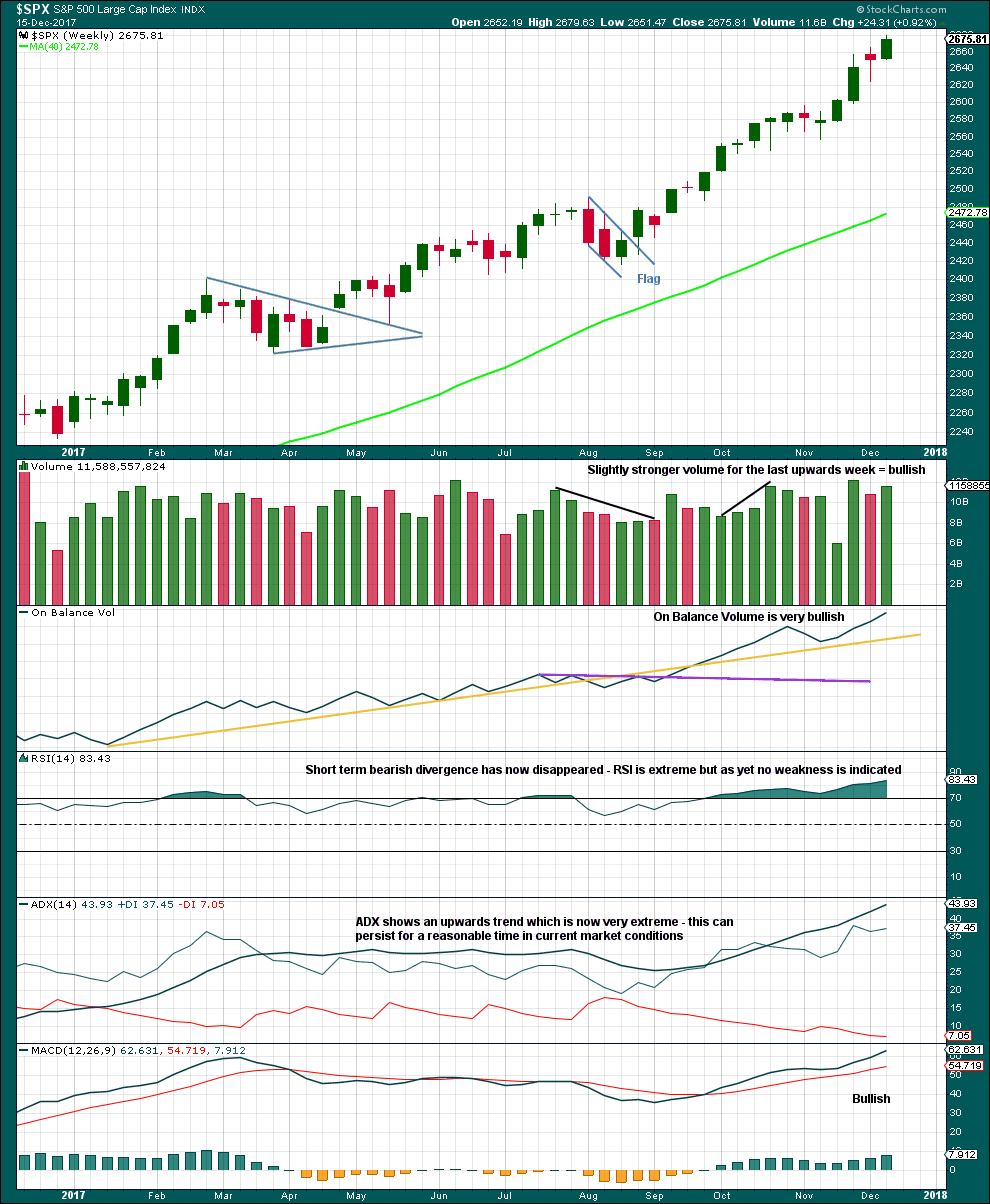
There is still no candlestick reversal signal at highs. The trend is now very extreme and overstretched, but this can continue for longer before price is ready to turn.
Overall, at this time frame, this market remains very bullish.
DAILY CHART
Click chart to enlarge. Chart courtesy of StockCharts.com.
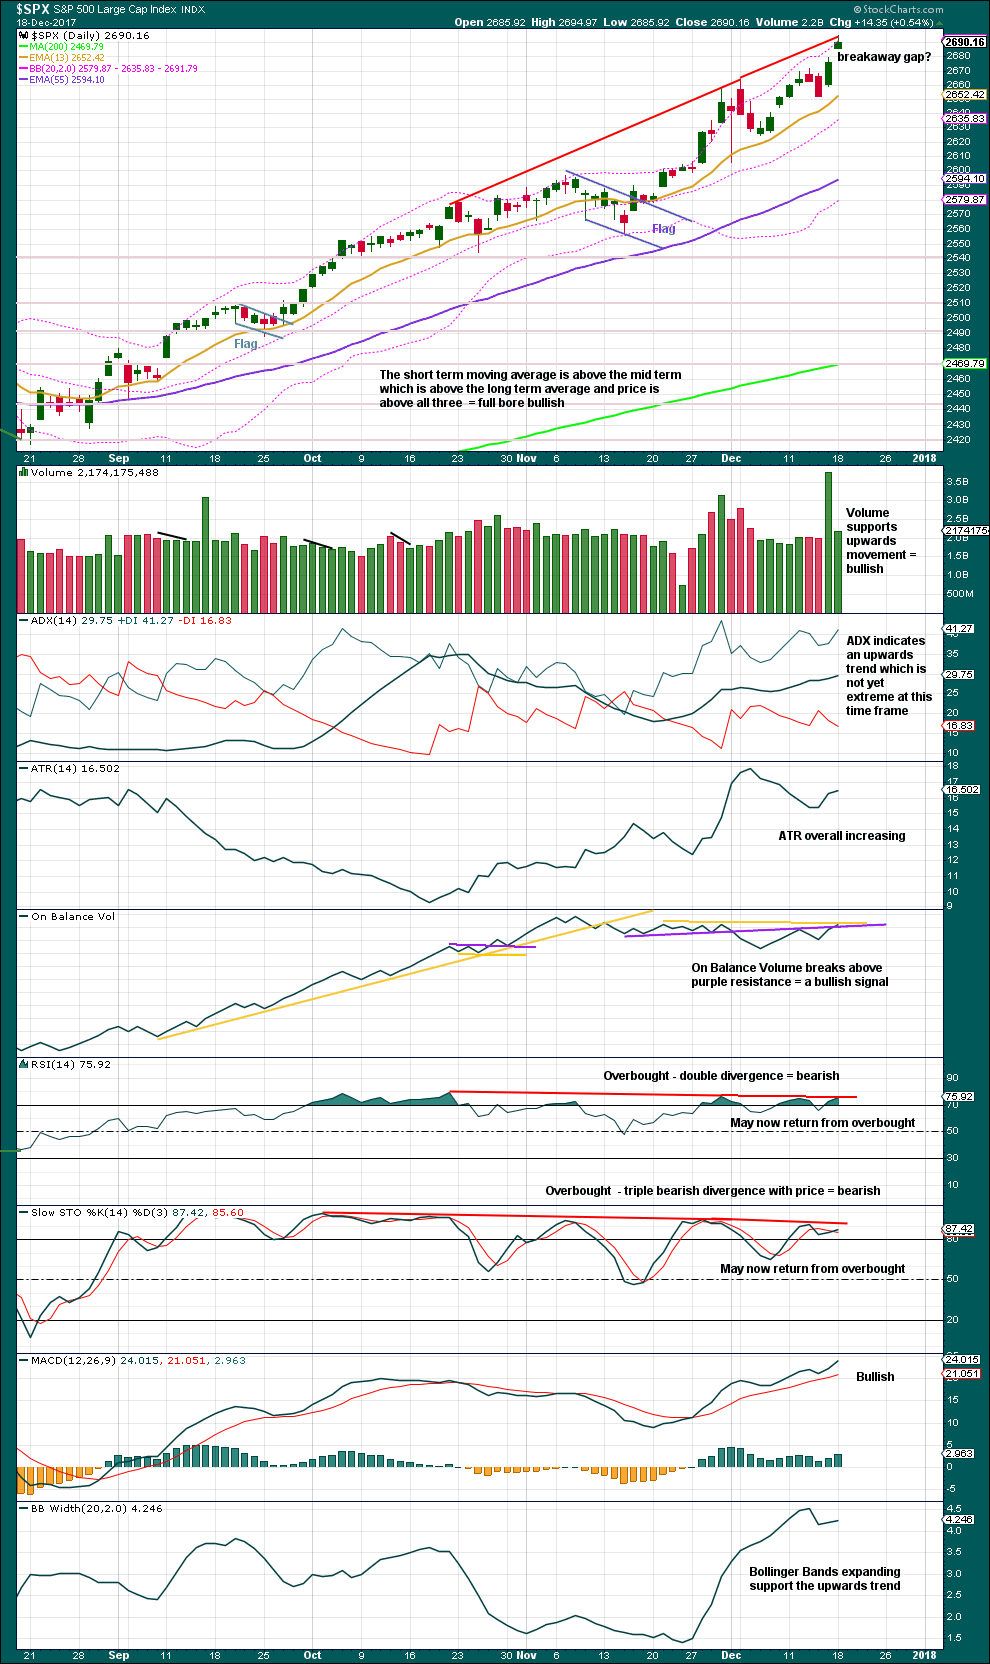
With ADX not yet extreme, there is room for this upwards trend to continue. It is overbought, but that can continue for longer.
There is no reversal signal at this stage.
After four bearish signals, On Balance Volume today gives a bullish signal. It still exhibits some divergence with price, but this may just disappear.
RSI exhibited triple bearish divergence with price in last analysis. That has today been reduced to double divergence. Divergence does not seem to be working to anticipate a trend change because it keeps disappearing.
The gap should be assumed to be a breakaway gap until proven otherwise. If closed, then it would be an exhaustion gap. Gaps may be used for stops which may be set just below the lower edge of the gap at 2,679.63.
VOLATILITY – INVERTED VIX CHART
Click chart to enlarge. Chart courtesy of StockCharts.com.
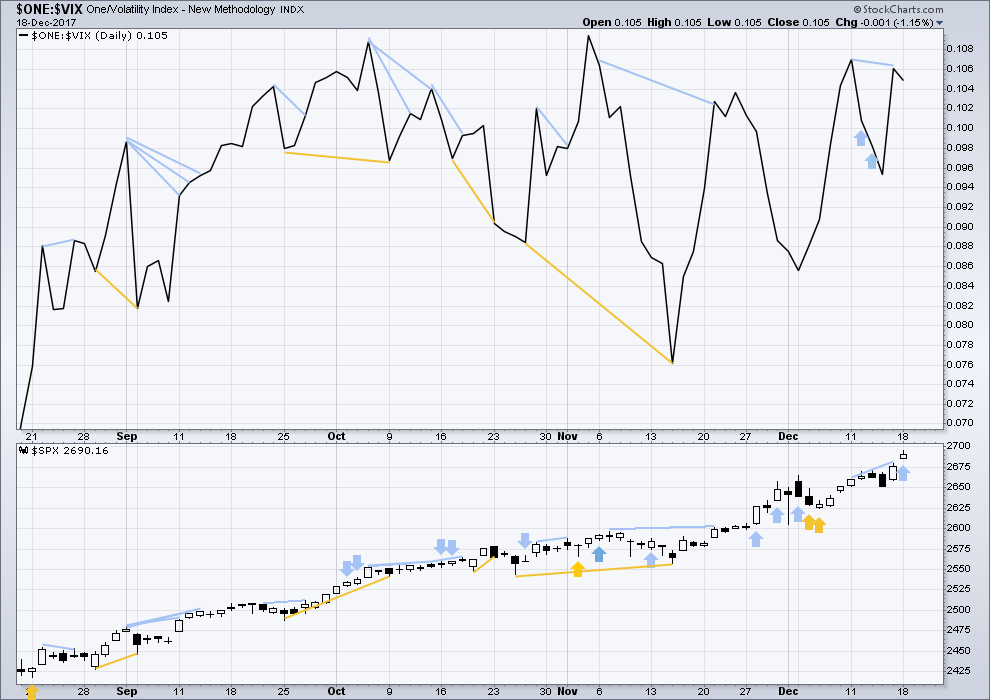
So that colour blind members are included, bearish signals will be noted with blue and bullish signals with yellow.
Normally, volatility should decline as price moves higher and increase as price moves lower. This means that normally inverted VIX should move in the same direction as price.
There is single day bearish divergence today between price and inverted VIX: price has moved higher, but inverted VIX has moved lower. The rise in price today did not come with a normal decline in volatility; volatility has increased.
The last few times this signal has occurred, noted on this chart, it has been followed by at least one or two days of downwards movement, although it did not always come immediately.
BREADTH – AD LINE
Click chart to enlarge. Chart courtesy of StockCharts.com.
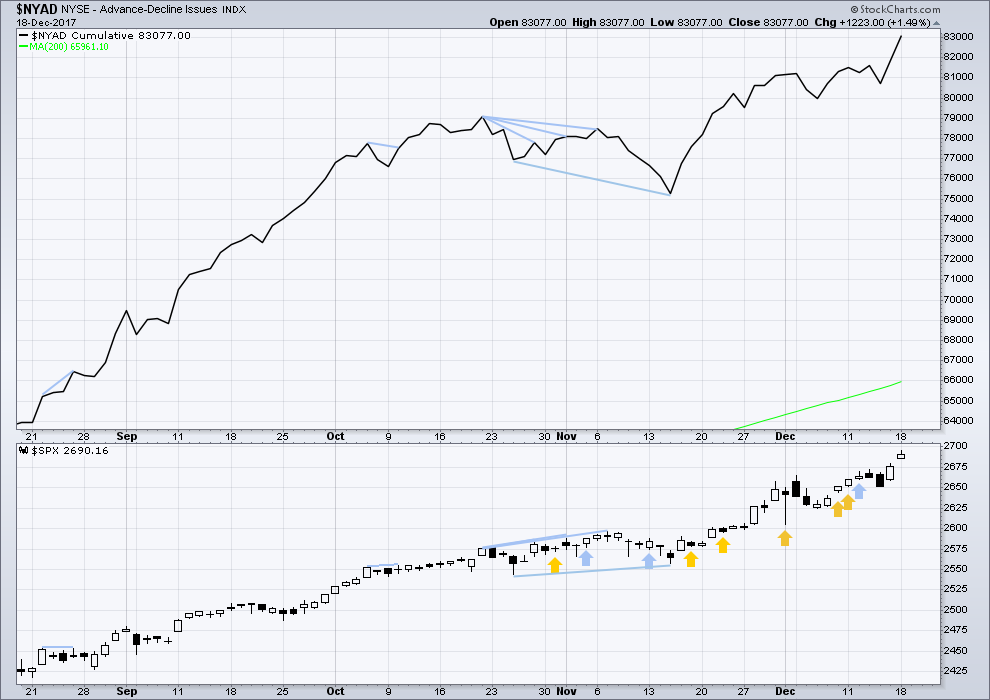
There is normally 4-6 months divergence between price and market breadth prior to a full fledged bear market. This has been so for all major bear markets within the last 90 odd years. With no longer term divergence yet at this point, any decline in price should be expected to be a pullback within an ongoing bull market and not necessarily the start of a bear market.
Only large caps made new all time highs last week. There is some weakness with mid and small caps unable to make new all time highs; this is bearish.
Breadth should be read as a leading indicator. The new all time high today for price is matched by a strong increase in market breadth. The AD line is very bullish.
DOW THEORY
The S&P500, DJIA and Nasdaq last week all made new all time highs. DJT made a new all time high today, confirming the ongoing bull market.
The following lows need to be exceeded for Dow Theory to confirm the end of the bull market and a change to a bear market:
DJIA: 17,883.56.
DJT: 7,029.41.
S&P500: 2,083.79.
Nasdaq: 5,034.41.
Charts showing each prior major swing low used for Dow Theory are here.
Published @ 10:15 p.m. EST.
I’m presuming we are going down in subminuette IV, as subminuette III finished earlier than thought?
Or maybe drop the degree of labeling down one, and we’re in a lower degree 2??? I dunno, but it picked my pocket today.
(Thankfully I managed to grab a nice profit yesterday.)
AG:
(IMO is a tax selling play {Over} with Bounce end of year through Jan 2018 + Good Pure Silver mining play with favorable chart technicals… confirming as I write this)
———
7.54 200DMA – Closed yesterday at 7.56 above 200dma (Tested, passed)
7.56 200WMA – Closed at yesterday and above today. (Tested, passed)
7.58 previous high to 12-18… through it Yesterday (Tested, passed)
7.67 – Breakdown point 8-3-2017… Just went through it this morning.
8.87 – 100WMA… next test. and over $1+ to get there.
9.59 – last high 4-13-2017
10.92 – high 2-7-2017
19.15 – high 8-10-2016
Soon the momo crew will take notice and get on board for move deep into Jan 2018.
You can hear a pin drop today! ???
30 Year Treasury Yield tanking today again!
2.826% at the moment up from a close of 2.71% on 12-14.
But IMO to really be sending a strong signal that rates are going to a higher level going forward. The 30 Year Treasury Yield must go above 3.26% and when it does, it must also accelerate higher at that same moment. Only then is the signal valid!
House is voting right now on Tax conference Bill… result to be know in 15 min.
It will pass… no doubt or suspense at all.
The Senate will Vote tonight after debate is completed. That is also expected to pass… no doubt or suspense at all.
And that is it, it is law right after President Trump signs it… All takes effect January 1, 2018
Correction… Vote to take place in 10 min 2:20PM ET
The Vote is now a 5 min vote!
It has passed {passed 223 Yea’s+}… On to the Senate for vote tonight… expected to pass… no doubt or suspense at all.
I’m thrilled with bonds falling / TBT rising today! May I have some more, please???
Love the new count; much more balanced weekly!! Not sure of the last minute 4, seems kindof short and small, and followed by high momentum price movement that seems more of the minute 3 than a 5; we’ll see. Meanwhile, 2682.2 is 38% today, 2680.8 is 62%. Happy to see the 4 finish and get back into some impulsive action soon.
Looking at the hourly, it appears the last minute 4 was reasonable relative to the minute 2; all goot!!! Looks like we’ve got a 4 here that starts with a flat, then an X wave, and now a zig-zag down? Perhaps it’s close to done if so.
Well, at least bonds (TBT) are going the right way for me today!! Looking forward to the end of this grinding 4. Maybe not until tomorrow though.
I agree, it is a bit short and small.
I’m open to the possibility of changing this portion of the wave count in coming days… lets see how the week closes.
Time for a VIX move up???
Great work, Lara. Thank you! (And thanks also for the extra video.)
You’re welcome 🙂