
Last analysis expected at least a little more downwards movement for Thursday’s session. The main hourly chart expected movement to about 2,654, and the low for the session was just below this point at 2,652.10.
A candlestick reversal pattern on the S&P and another on VIX today indicate strongly what looks most likely to happen next.
Summary: This market is overbought and overstretched. A bearish candlestick pattern today on the S&P and a bullish candlestick pattern on VIX (which is bearish for the S&P), along with bearish On Balance Volume, is strongly indicating lower prices ahead.
How the S&P behaves when the market opens tomorrow will be strongly indicative. While price remains within the yellow channel on the hourly chart, assume the main wave count is most likely correct. The target remains at 2,773.
But if price breaks below the lower edge of that channel (which is now very close by) when markets open tomorrow, then the alternate wave counts will be preferred. That indicates a deeper pullback is underway.
A new low below 2,624.85 would indicate more downwards movement to a target at 2,607 – 2,600.
A new low below 2,557.45 would indicate a multi month pullback or consolidation has arrived.
Last monthly and weekly charts are here. Last historic analysis video is here.
The biggest picture, Grand Super Cycle analysis, is here.
MAIN ELLIOTT WAVE COUNT
WEEKLY CHART
Click chart to enlarge.
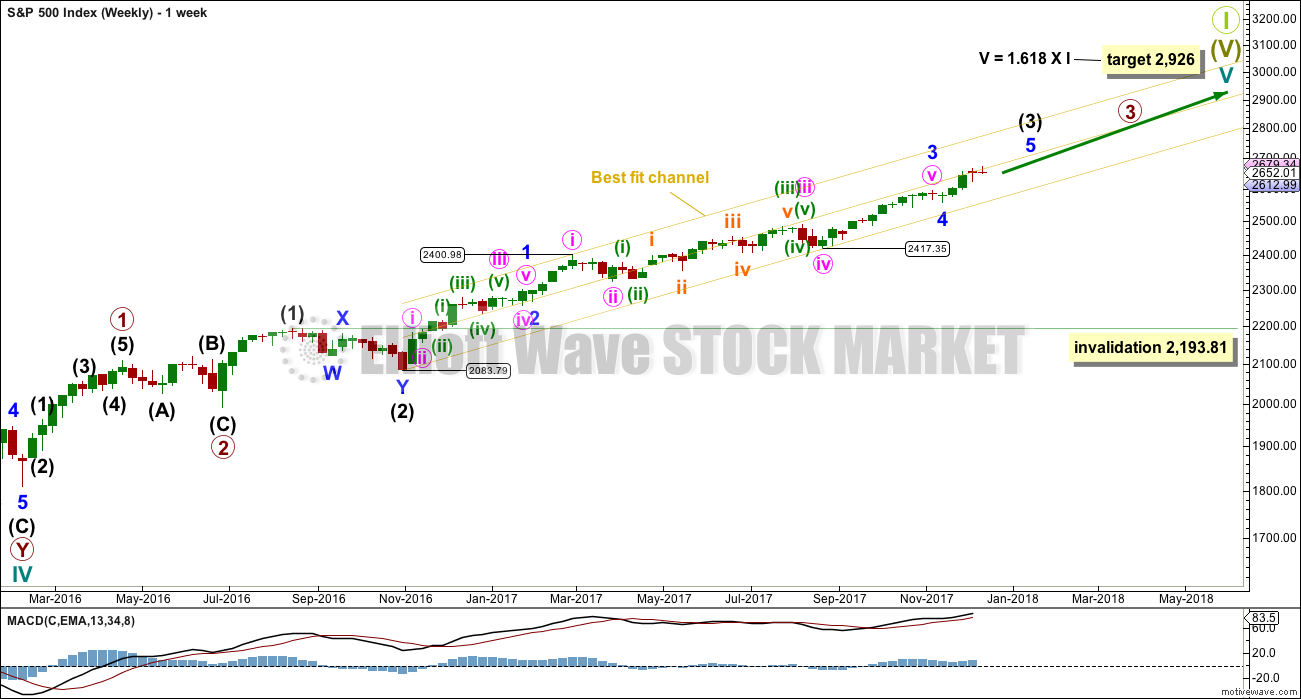
Cycle wave V must complete as a five structure, which should look clear at the weekly chart level. It may only be an impulse or ending diagonal. At this stage, it is clear it is an impulse.
Within cycle wave V, the corrections for primary wave 2 and intermediate wave (2) both show up clearly, both lasting several weeks. The respective corrections for intermediate wave (4) and primary wave 4 should also last several weeks, so that they show up at weekly and monthly time frames. The right proportions between second and fourth wave corrections give a wave count the right look. This wave count expects to see two large multi week corrections coming up, and the first for intermediate wave (4) may now be quite close by.
Cycle wave V has passed equality in length with cycle wave I, which would be the most common Fibonacci ratio for it to have exhibited. The next most common Fibonacci ratio would be 1.618 the length of cycle wave I.
Intermediate wave (3) may now be nearing completion (the alternate hourly wave count looks at the possibility it could be complete at the last high). When it is complete, then intermediate wave (4) should unfold and be proportional to intermediate wave (2). Intermediate wave (4) may be very likely to break out of the yellow best fit channel that contains intermediate wave (3). Intermediate wave (4) may not move into intermediate wave (1) price territory below 2,193.81.
The yellow best fit channel is redrawn. Price points are given so that members may replicate this channel. This channel is copied over to the daily chart.
DAILY CHART
Click chart to enlarge.
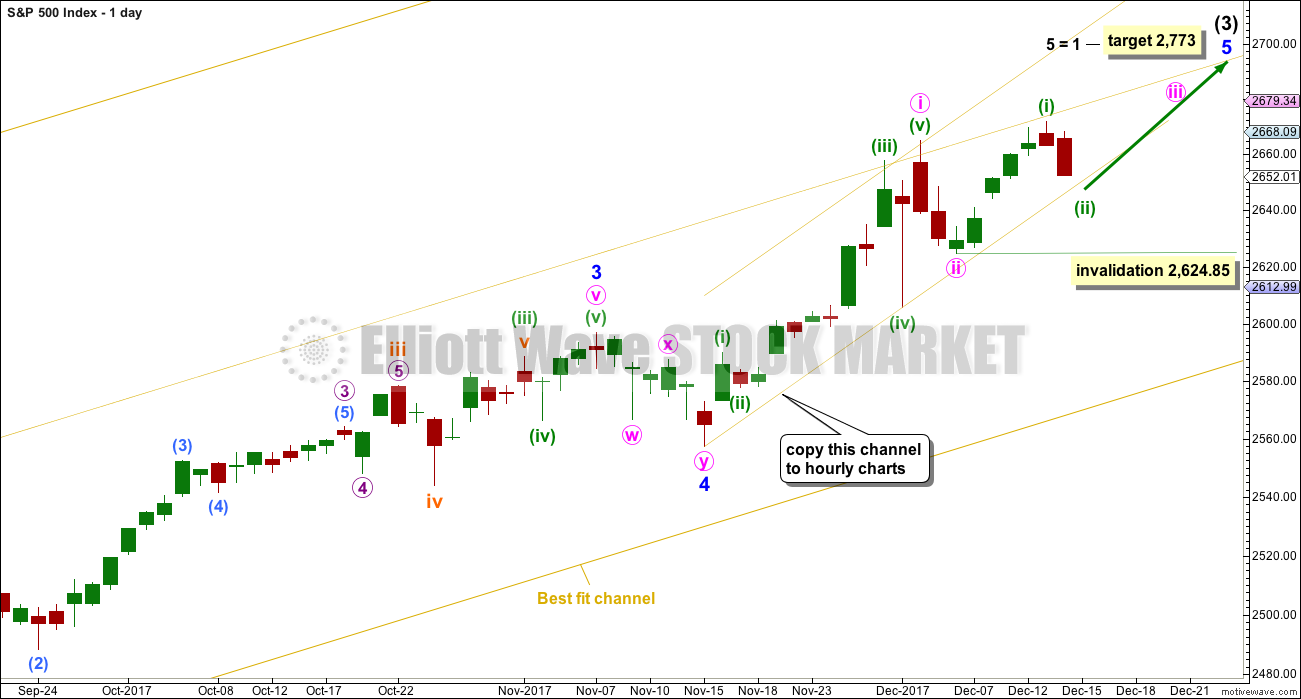
The main wave count will now expect that within minor wave 5 minute waves i and ii are complete.
Within minute wave iii, no second wave correction may move beyond its start below 2,624.85.
The target expects minor wave 5 to exhibit the most common Fibonacci ratio to minor wave 1.
Price is finding resistance about the mid line of the best fit channel.
The narrower channel, which is drawn on the hourly chart, is today added to the daily chart in order for members to see how it is drawn. Copy this channel over to the hourly chart. If minor wave 5 is incomplete, then price should remain within this channel.
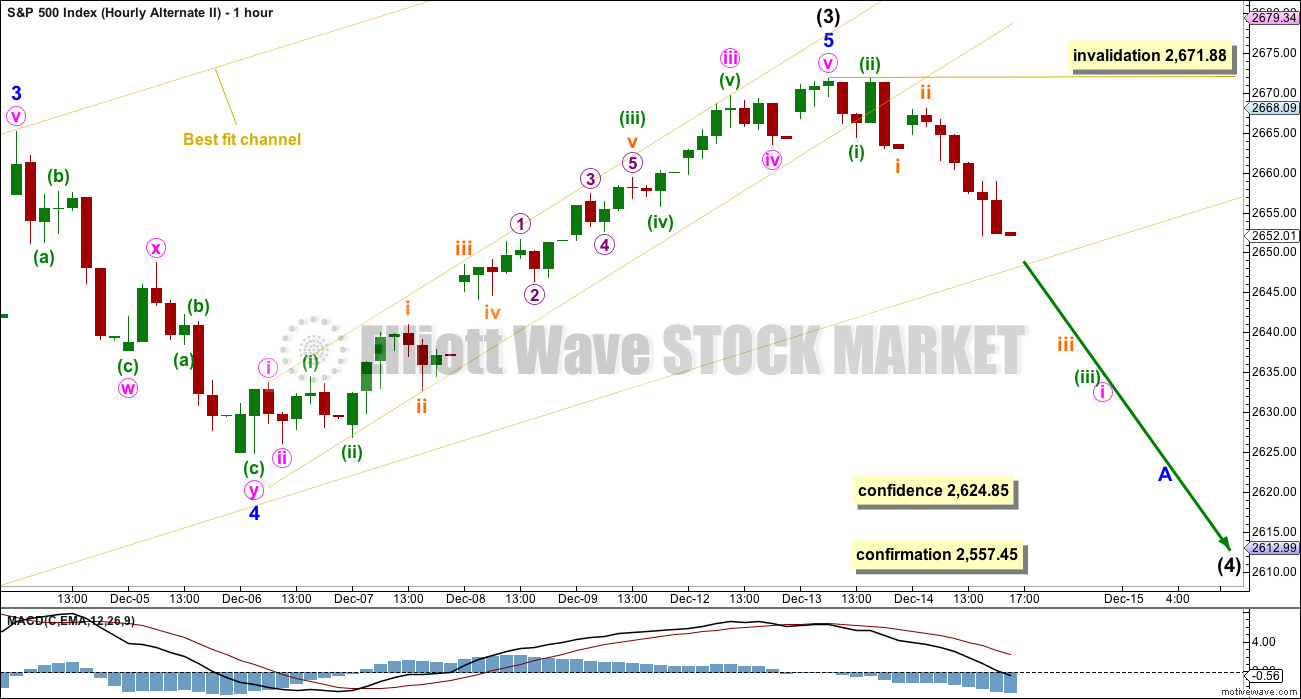
HOURLY CHART
Click chart to enlarge.
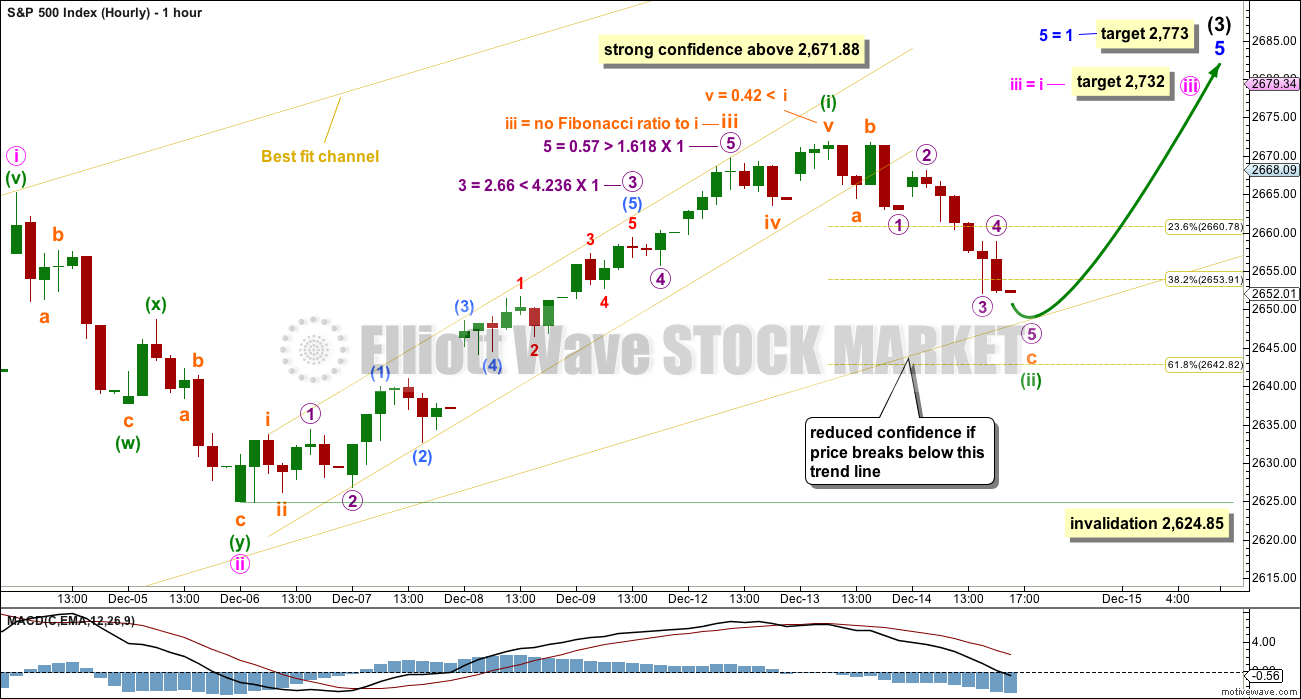
Minute wave iii may only subdivide as an impulse.
Within minute wave iii, only minuette wave (i) may now be complete. Minuette wave (ii) may be extremely close to completion and may find support just at the lower edge of the yellow best fit channel, which is copied over from the daily chart.
Minuette wave (ii) may be subdividing as a zigzag. Within subminuette wave c, the final fifth wave of micro wave 5 has not yet moved below the end of micro wave 3. As soon as price has made a new low below the end of micro wave 3 at 2,652.10, thus avoiding a truncation within subminuette wave c, then minuette wave (ii) may be complete and this wave count would expect a quick reversal.
The next wave up for minuette wave (iii) should exhibit a strong increase in momentum.
If price breaks below the lower edge of the best fit channel when markets open tomorrow, then the two alternate wave counts below would be preferred, even prior to price invalidation of this main wave count.
At this stage, this downwards movement no longer looks very good as a zigzag. Subminuette wave c is now longer than 2.618 the length of subminuette wave a. This is acceptable, but not very common.
ALTERNATE HOURLY CHART
Click chart to enlarge.
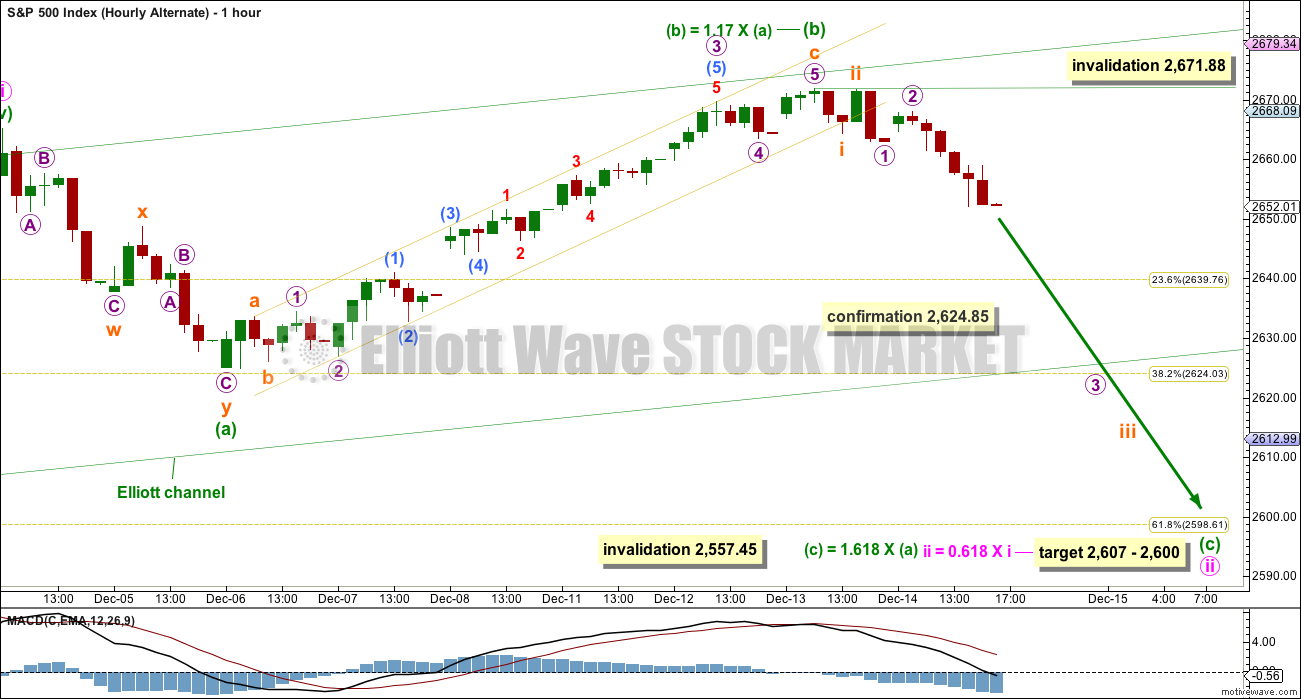
It is still possible that minute wave ii may not be complete and may be continuing as an expanded flat correction.
If price makes a new swing low below 2,624.85, then the target for downwards movement to end would be 2,607 to 2,600. This assumes the most common Fibonacci ratio between minuette waves (a) and (c), and the most common point for minute wave ii to end at.
Minuette wave (c) may last six days if minute wave (ii) exhibits a Fibonacci duration of thirteen.
At this stage, downwards movement fits best as an unfolding impulse than it does as a zigzag. That offers some support now for both of these alternate wave counts.
SECOND ALTERNATE HOURLY CHART
Click chart to enlarge.
A more bearish option is still technically possible. It is possible that intermediate wave (4) may begin here or very soon.
A new low below 2,624.85 would add a little confidence in this idea.
A new low below 2,557.45 is required for confirmation of this idea. Only then should it be taken seriously.
Intermediate wave (4) may last about three months. It may be a choppy overlapping large consolidation, or a deep sharp pullback (which may be over more quickly than three months). It should have some reasonable proportion to intermediate wave (2), so that the wave count has the right look at the weekly time frame.
Four bearish signals in a row now from On Balance Volume offer some support to this wave count. This is joined today by a bullish signal in VIX, which is bearish for the S&P. However, the AD line continues to rise and this contradicts the On Balance Volume bearishness. It would be best to let price tell us if this wave count is correct.
TECHNICAL ANALYSIS
WEEKLY CHART
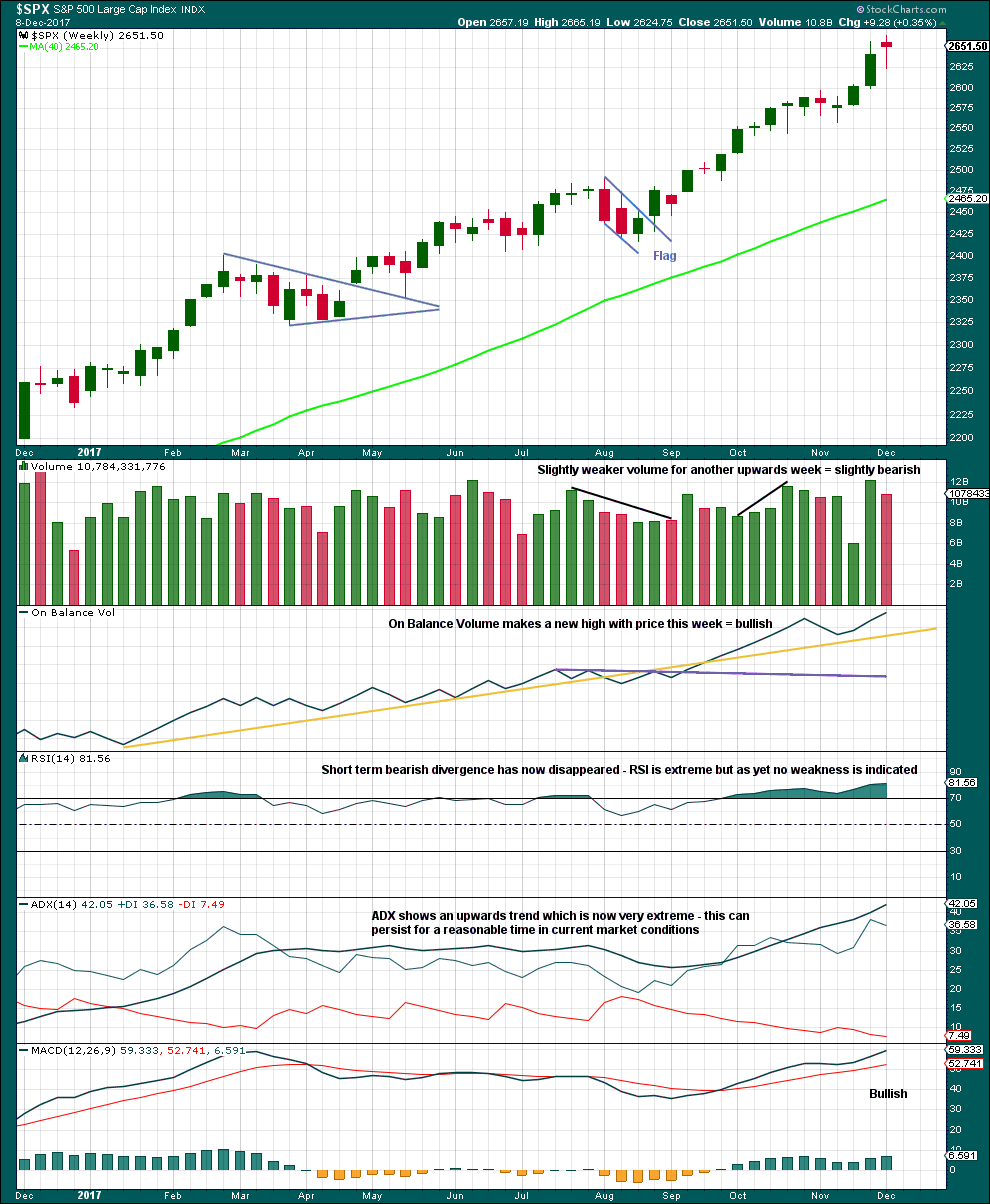
Click chart to enlarge. Chart courtesy of StockCharts.com.
There is no candlestick reversal pattern yet at highs.
Price and On Balance Volume continue to make new highs. This is bullish.
The trend is extreme, but as yet there is no reversal signal at this time frame.
DAILY CHART
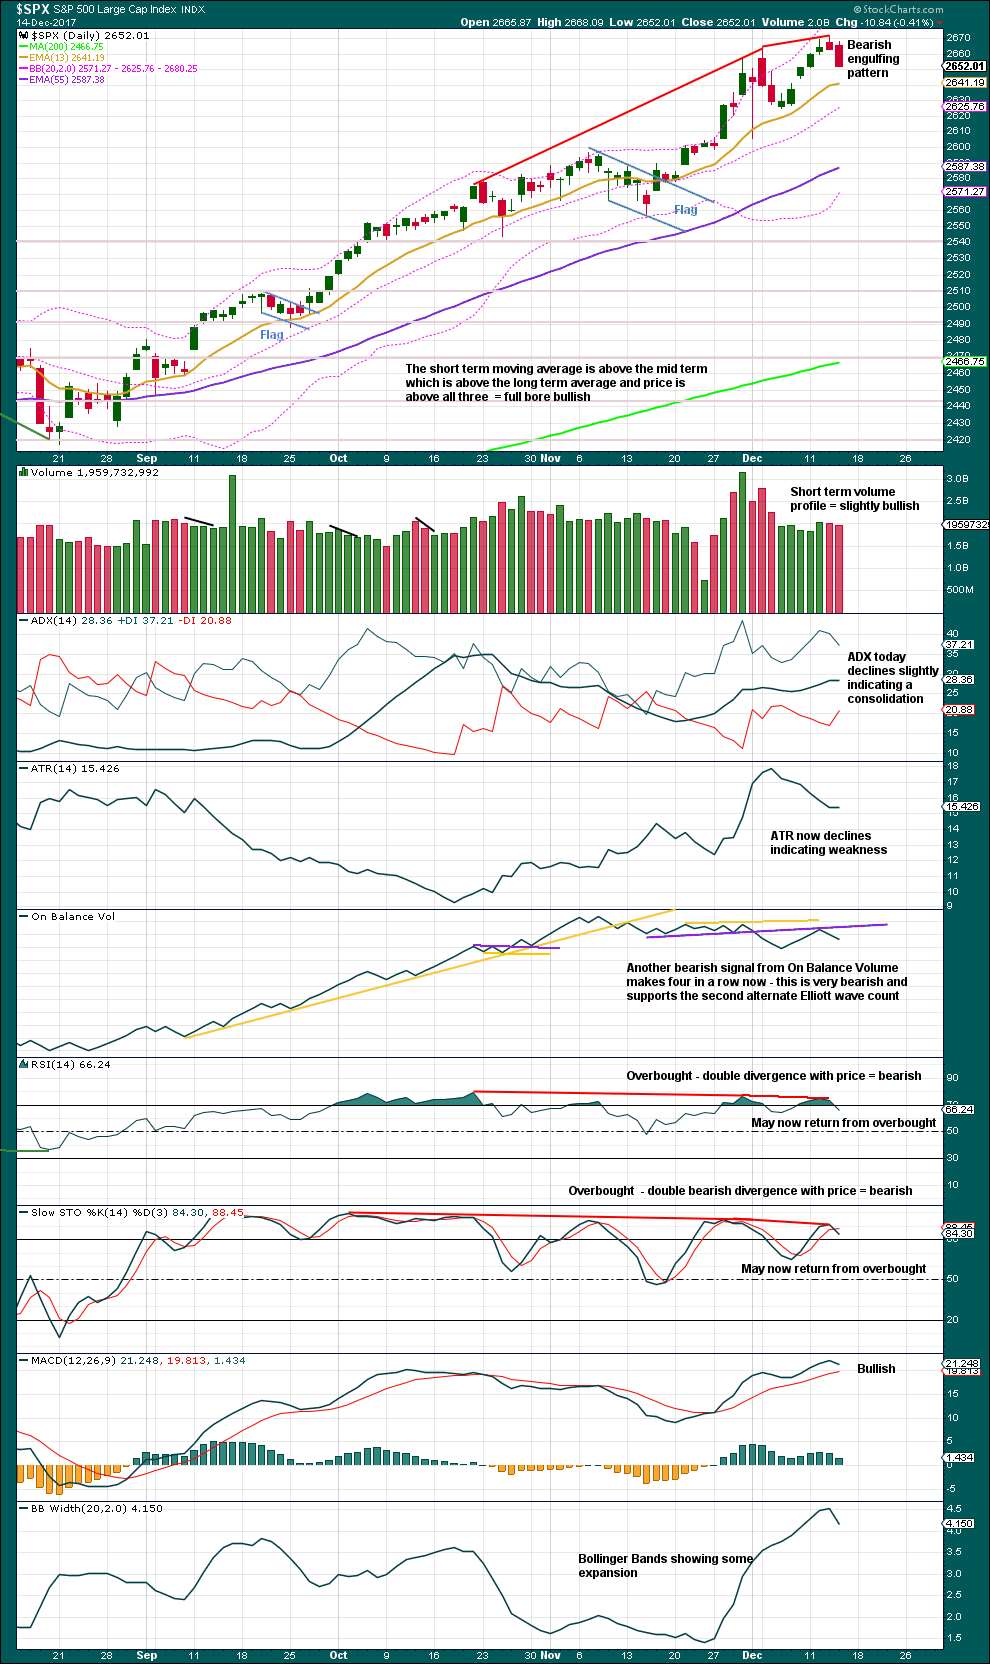
Click chart to enlarge. Chart courtesy of StockCharts.com.
This chart still looks reasonably bearish. This market is overbought and exhibits weakness; it looks susceptible to a reasonable sized correction. Today completes a strong bearish candlestick reversal pattern; this supports the alternate Elliott wave counts. However, candlestick reversal patterns make no comment on the next direction (it could be either down or sideways) nor do they make any comment on how far the next trend may go. And so this bearish engulfing pattern may support either alternate Elliott wave count; it does not favour one or the other.
If price makes a new swing low below 2,624.75, it would then look like a larger correction may have arrived.
There is divergence between price and On Balance Volume, Stochastics and RSI. ATR continues to decline.
VOLATILITY – INVERTED VIX CHART
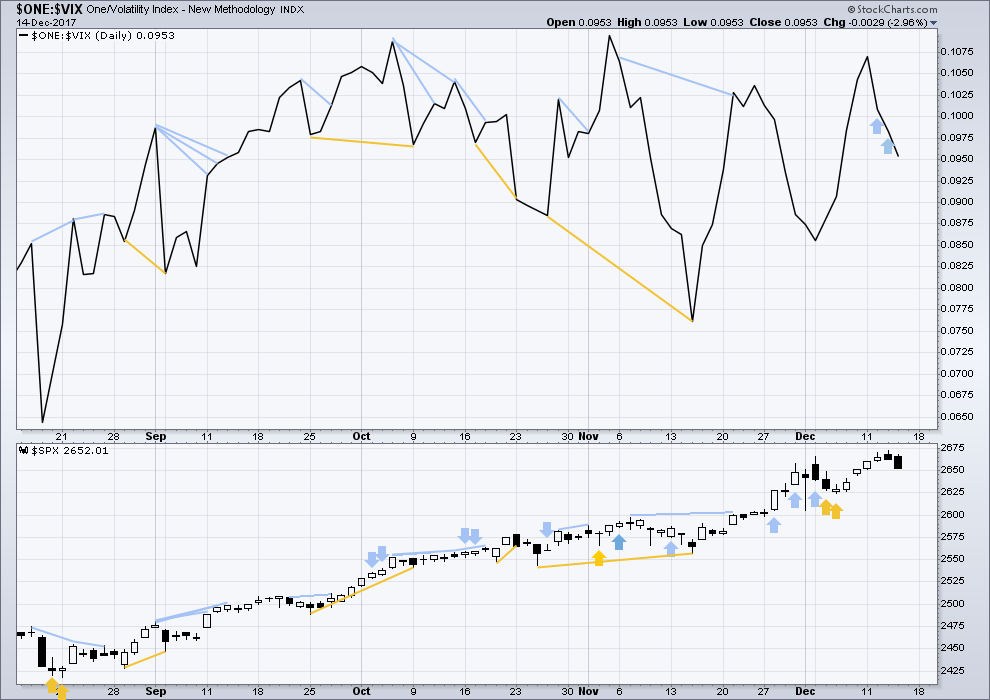
Click chart to enlarge. Chart courtesy of StockCharts.com.
So that colour blind members are included, bearish signals will be noted with blue and bullish signals with yellow.
Normally, volatility should decline as price moves higher and increase as price moves lower. This means that normally inverted VIX should move in the same direction as price.
Inverted VIX has given two bearish signals in a row and now price has followed with a fairly strong downwards day. This bearishness may now be resolved, or it may require another downwards day to resolve it.
VOLATILITY – VIX CHART
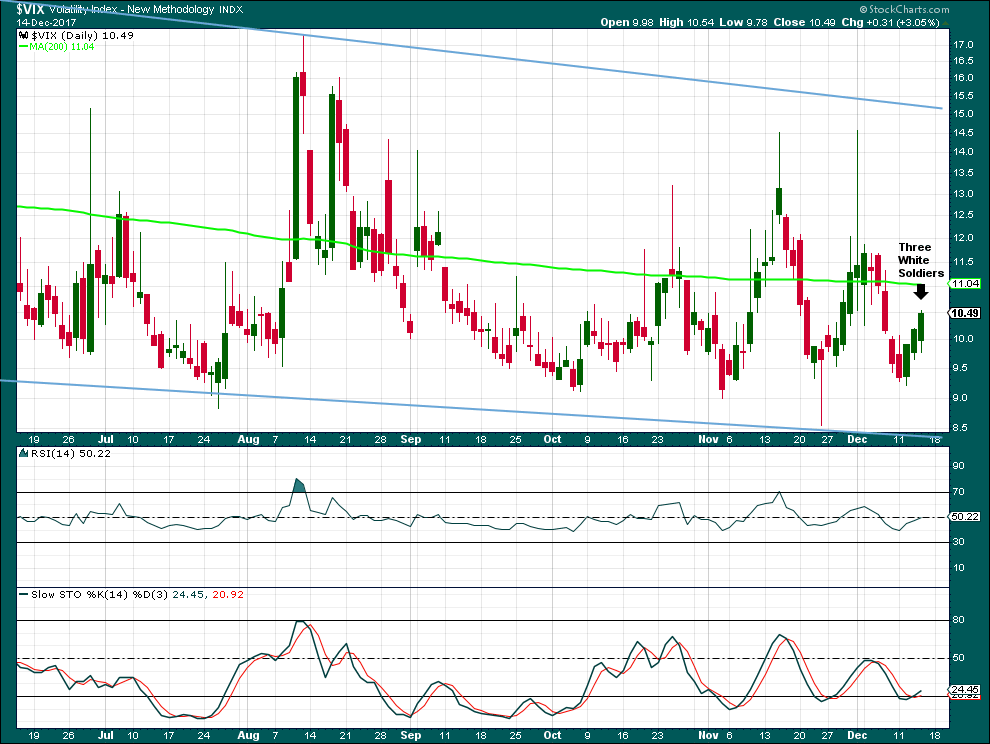
Click chart to enlarge. Chart courtesy of StockCharts.com.
Thank you Joeseph, an EWSM member, for pointing out this candlestick pattern in VIX today.
From Nison: “If this pattern appears at a low price area or after a period of stable prices, then it is a sign of strength ahead”.
In this case, the second and third candlesticks close very close to their highs; the upper wicks are very small indeed. There is no weakness shown here, so this is a bullish reversal pattern.
If VIX is about to move strongly higher, then it looks likely that the S&P may move strongly lower. This supports the alternate Elliott wave counts, and may offer slightly more support to the second alternate Elliott wave count than the first.
BREADTH – AD LINE
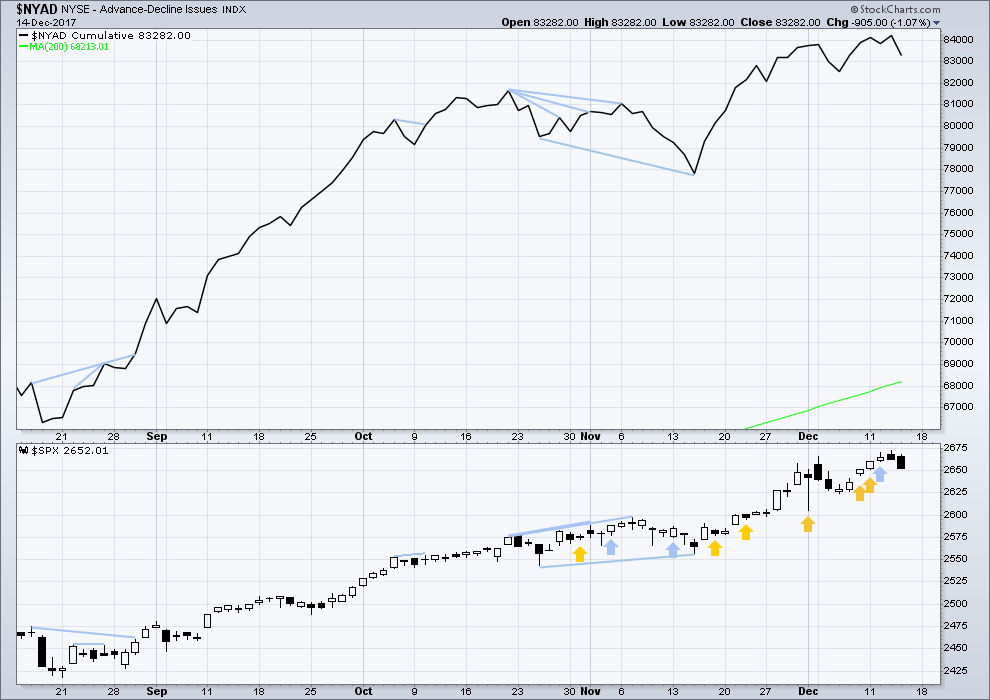
Click chart to enlarge. Chart courtesy of StockCharts.com.
There is normally 4-6 months divergence between price and market breadth prior to a full fledged bear market. This has been so for all major bear markets within the last 90 odd years. With no longer term divergence yet at this point, any decline in price should be expected to be a pullback within an ongoing bull market and not necessarily the start of a bear market.
All of large, mid and small caps last week have made new all time highs. The rise in price has support from market breadth.
Breadth should be read as a leading indicator. Today’s downwards movement from price is supported by a decline in market breadth. This is bearish.
DOW THEORY
The DJIA, DJT, and S&P500 have last week made new all time highs. Only Nasdaq was unable to make a new all time high.
The following lows need to be exceeded for Dow Theory to confirm the end of the bull market and a change to a bear market:
DJIA: 17,883.56.
DJT: 7,029.41.
S&P500: 2,083.79.
Nasdaq: 5,034.41.
Charts showing each prior major swing low used for Dow Theory are here.
Published @ 9:35 p.m. EST.
The Dems and all the Liberal Educated Brainwashed Economists said it was impossible… That more than 2 – 2.50% GDP Growth would never be possible again!
They ALL laughed and mocked Trump all during the campaign when he laid the claim that 3.5% to 4.00%+ GDP growth is possible with the agenda that he would be implementing.
Now with the reporting that 3rd Quarter GDP Growth was 3.30% and now the estimate for 4th Quarter GDP Growth with the following news…
The Trump economic boom is picking up steam as American heads into the final weeks of the president’s first year in office.
The Federal Reserve Bank of New York’s Nowcast, which attempts to estimate economic output based on the latest releases of data, now says GDP appears to be growing at a 4% annualized rate in the fourth quarter. That is the highest level on record for the Nowcast, which was launched just two years ago.
The Nowcast was revised up primarily due to positive impacts of revisions of earlier data, the New York Fed’s website said Friday.
A similar tool from the Atlanta Fed was also revised up earlier this week to 3.3 percent. The Atlanta Fed measure has a track record of being considerably more pessimistic about growth than the New York Fed’s Nowcast.
—————————————
Next the Tax Bill goes into law on Jan 1, 2018… + a continued cut of regulations over the next year back down to pre 1960 totals.
The next American Growth engine foundation will be built over the next 2 – 3 years and then after that time we may have consistant 3.75% to 4.50% GDP Growth for a few years.
What is the price of 20 year treasury bonds based on? Interest rates rising, 20 year treasury bonds are going UP in value. Is that sustainable? Is it the case that bonds will (“must”) start going down at some point reasonably soon? It seems that way to me but the action so far is quite the opposite. Anyone???
Bonds are the smart money.
The Yield curve continues to Flatten. Flattening is not a good signal from the Treasury Yield curve.
Before 2008… you could believe 95% of what the bond market was signaling.
Now… with all the manufactured distortions, who knows!
30Yr is key now 2.678%
I’m theorizing that the interest rate rise was priced in long ago, and now that it’s “only” 1/4 percent and it took so long to arrive and the pace of increases is slower than expected and maybe they’ll even delay those…bond prices are rising vs. what’s been expected re: interest rate changes.
That’s not the way it works.
TD Ameritrade’s system is down. What’s up with this?
How does it work then? Kevin’s hypothesis seems valid. Look at the yield on 30 year T-bonds YTD. It has been falling since March, despite the fact that the Fed has done… literally everything they said they would. Bonds seem to be rising because inflation is low and nobody seems to expect the Fed to be able to raise rates above 3% like they claim they’re going to.
The Fed only controls the Fed Funds Rate, it’s all they have the power to set… the market sets all the other rates.
The Fed will get the Fed Funds Rate to 3.00%… all they have to do is make a decision and raise it there. They could do it all at once in the next meeting if they choose.
Back in the late 70’s early 80’s the Fed would raise or lower the Fed Funds Rate by 1.00% in a single meeting… and they would NEVER telegraph it in advance.
Now if they do raise to 3.00% in the next meeting… that will be the highest rate available. Everything else on the Yield curve will be lower than that.
The Fed should go back to the old days… Raise the FF rate by 1.00% in a meeting and the next raise it .50% and the next .75%.
Keep the markets guessing! That’s how it used to work.
We have been and are in this totally distorted world due to the Fed setting the Fed Funds Rate below 3.00%.
It should never, ever been moved below 3.00%. Moving below 3.00% destroyed the entire system.
A move below 3.00% is like pushing on a string… and that is truly the effect since it was first done.
The Dog used to wag the tail… now the tail contains the dog. Fed use to equal the Dog! Now the Fed is a snowflake!
The 30 Year US Treasury Bond is the only maturity that isn’t being used much in exotic type trades.
That’s the Only Yield that you can trust to tell you if market rates in general are set to move to levels unseen in years.
When and if that Yield goes above a 3.26% and then accelerates higher. That is the sign! That’s the ONLY signal I will trust.
December 2015 and January 2016 were interesting months. In fact, many thought that was just the beginning of a bear market. They believed finally the bears would begin the crushing 2 year or more move to SPX 1300 or so. It did not materialize that way. The bull stomped forward shaking his horns to impale all who resisted. It began to accelerate in Nov of 2016 at the completion of the US 4 year federal election cycle for President and Congress. Now we are way, way above that low in Nov 2016 when the Dow was down 1000 points in overnight trading and the SPX over 100 points lower.
Can we get the start of a similar gut wrenching correction in January 2018? A plethora of indicators are saying it is possible and perhaps likely. Will it be the start of the long awaited bear market? Using Lowry’s and other TA, Lara would say no. We need months to form such a top.
My thoughts are that the US equity markets are in at least a mid term if not long term bullish blow off. Price will march higher until it doesn’t. Then we will have the biggest correction since Dec 2015 to Jan 2016. That potential correction carries a lot of risk for the bulls. I guess such a correction will be followed by at least a test of the ATH’s early in 2018 if not a move much higher, eg. 2900+
As a result, I am not contemplating any position in the US equity markets for the foreseeable future until the plethora of bearish signals and indicators subside. Too much risk for my taste. A move of my trading vehicles to other markets could prove wise and beneficial.
A short on Gold perhaps? It’s completing a big Elliott wave triangle I think, and should break out downwards.
Main hourly chart updated:
So much for the 1.27 extension. The 1.62 is next at 2683.8 or so.
The Force is strong with the market today!
Hi Joe:
Continuing to search for the very rare TWS VIX pattern. The last one was on 5-19-06, and before that 3-10-04.
Wow… that’s a long time ago. Looks to be a dud though… so far today.
This is definitely not true. Unless your requirements for what fits a TWS pattern are extraordinarily stringent.
So what is the time lag? IYO
I agree with Bo. The rarity of this VIX pattern I think makes it quite noteworthy. To dismiss it entirely based on one day of price action following the pattern may be a bit premature. I suspect the plethora of bearish signs we have been seeing are not nrcessarily negated at this point but could be accretive. The trend does indeed remain up. Have a great weekend all! 🙂
The definition is not more stringent or less so. Either the candles meet them or they don’t if you were commenting on the frequency of the pattern. If you found more please tell us when. 🙂
Is VIX ever going to bounce?
The VIX is the tail, not the head of the dog. SPX is the head. VIX will “bounce” (go up) only when SPX price falls. This is why I spend very little attention on the VIX; it’s the SPX wave count and price action that is important. The VIX is merely one of many possible tools for taking advantage of what we know of SPX price action (in my opinion). A 2 is coming shortly, and VIX will then spike a little. But if you are using the ETF’s/ETN’s for trading the VIX, they may react much more mildly, because they discount in more of “the future” (they are priced based on blend of multiple forward month futures market prices) that the VIX proper, and the future sentiment is clearly bullish. Also, those “long volatility” instruments suffer from grotesque daily priced degration due to futures contango, another factor working against you use take them long. VIX very rarely “leads” the market (we saw it a bit for 2 days what, 2 weeks ago? It was very noticeable, but it is infrequent).
No Kevin, there are sinister and manipulative forces at work driving prices of many markets. VIX higher will send stocks lower, period!
This forum sure is entertaining!
Back to the price action and the wave count….
Yep. It can be manipulated in the short term. The higher price goes, the more tenuous artificial contol and suppression becomes. We don’t know with certainty when they will be forced to unwind, only that they will… 🙂
Not always the case Kevin. They can, and sometimes do, both go in the same direction…!
We call that upside capitulation; which you’ve noted, has occurred more than a few times in recent weeks
sub-ten is good enough for me
Yep – 9.42
The 1.27 extension of the prior down move is being approached: 2676.9
A key decision point for SPX and likely high and start of a 2 down.
BTW, every single SPDR sector “green” for the day. New ATH’s in SPX and NDX (and DJIA close). This rally is broad and strong, and the main wave count indicates there will be more, a lot more, coming over the next few weeks.
SNAP!
Not the stock symbol to be clear.
Oh the “pain”… the “pain”… I can’t take the “pain”
STOP… STOP… STOP! PLEASE! PLEASE STOP!
As you can tell… I am very bored. I thought it was going to be an exciting day. The bulk of the move before the market opened.
Update on my current trades.
I am holding AG into January.
RIG … I was stopped out of late yesterday. Not sure, the way the chart currently looks when I will re-enter.
VIX is painful.
I’ve often found counter trend trading painful myself!! I try to avoid it more and more these days.
You might look for a touch on the 62% retrace fibo (lower blue line), and a turn there giving some buy triggers. If that plays out, I think it would be a good set up for a long position.
Lara or others who care to comment, the Alternate hourly chart indicates Minuette (b) is complete and the count is invalidated by today’s new high about 2672. My question is why can’t Minuette (b) continue higher before we turn down to complete Minuette (c) of Minute ii (around the 2600 level)?
It seems to me we have a lot of indicators / signals etc that have given bearish signals over the past two weeks. We have several extreme levels in the oscillators. These do not always work individually speaking. But they very often work when there is a large consensus of readings, in this case bearish.
On the other hand, the daily MACD is still pointing straight up with the hourly about to have a bullish crossover from a relatively low reading having stayed above the zero line. This is strong bullish momentum.
ATM on am on the sidelines with regards to SPX and equities.
Indeed! In my humble opinion, the price action today is intended to have us ignore the CONTEXT in which it is taking place. It is clearly working beautifully! 🙂
But what do I know?
I suspect the reason that new ATH’s invalidate the first hourly alternate is that there isn’t a viable wave count for what should be a “b” wave up in that count that makes sense now. Everything about today’s move screams “hourly main”, in my view. It’s a strong impulsive move up, after a 2 down that counted out well as an ABC correction.
New high today invalidates Lara’s tentative count of an unfolding downward impulse.
This could work Rodney. Now minuette (b) looks better as a three up actually.
But what I cannot see working ATM is an end to intermediate (3).
I’ll be spending a bit of time looking to see if that could work with a reanalysis of the whole of intermediate (3) so far.
I agree with you. There is a cluster of bearish signals at the daily chart level so far. It does look increasingly like a high of reasonable importance is forming. Unfortunately picking that high is proving so far to be ridiculously difficult, price keeps going up.
The thing though about using price as a leader for analysis, is at a high of reasonable importance price will be, well, high. And so point to higher prices. Exactly when it will be very wrong.
They can’t hold back their excitement on all the business news stations as they report all the banks and brokers calling for S&P 3000+ & another 12%+ in 2018.
They “all” everyone of them are Giddy beyond belief… giggling like children.
All that matters is the price action and the wave count. (Okay, and some of the supporting technicals, i.e, “weight of evidence”). Everything else? Irrelevant noise. Who is buying, why they are buying, what the talking heads are saying, what the eternal bears are saying, is all irrelevant noise. The price action and wave count are strongly bullish. That’s the only data of consequence, and the only data that should be focused on as a trader. In my opinion. I could be wrong…
That’s my opinion too. A focus on technicals, the data, and particularly price…
But that’s because Elliott wave is mutually exclusive to fundamental analysis.
Get a grip people. We are moving back up to test prior support and/or resistance areas….
No. Price action is the sole truth. Price is in an impulsive move up. The long term trend is up. The intermediate term trend is up. The short term trend is up. There will be pullbacks. We just had one over the last few days. It’s back to 5 wave up action. If that makes me clueless, so be it.
Please NEVER take anything I say personally unless I specifically attach your name to it.
I completely agree with your observation regarding price, which after all is reflective of SENTIMENT. Where we differ is what that price action means, which is also OK. If I am wrong, it would not be the first time… 🙂
Not taking it personally at all Verne. My concern is that your characterizing “bullish sentiment” (which you gotta have if you are going to get in line with this market, right?) as “clueless” might mislead some members. Getting in line with a raging bull market isn’t clueless (even if the overall move up is driven by a “clueless herd”!). It’s an important distinction. Staying in too long, not being aware of the wave count, not watching the indicators re: a potential overall market top…those are what constitutes “clueless”. Our job is to TAKE ADVANTAGE of the clueless herd, by going with them when they move the market bigly. That’s how I see it, anyway.
Good point. I know most folk on this forum are NOT clueless as we have Lara’s analysis to inform our trading decisions. Nothing at all wrong with trading what you see. We sometime “see” different things… 🙂
I agree with you Kevin. I mean no offense to them, but Verne et al. are making comments indicating they are “permabears”. It’s fine to feel the markets are irrational, but that kind of rhetoric can mislead newcomers. As Keynes famously said, “The market can stay irrational longer than you can stay solvent.” I definitely appreciate your tendency to take a realistic perspective on expected market movements. Your Fibonacci targets have also helped me swing a few successful trades the last few days!
I have to confess that I am amazed at how truly clueless market participants are. Overestimating the intelligence of the herd will cost you. Market gaps open indicate lots (relatively) of bids to go long at market price. The people buying at this morning’s high are already under water….
UNCLE
It’s amazing how they can keep the pressure on VIX’s neck for more than 1 1/2 hours.
The Friday smash down is now an established practice. We should expect it. Very interesting it occurred following a TWS reversal signal. My assummption is that the short sellers are ignorant of, or chose to ignore it, not that today’s decline necessarily nullifies it
So if other things line up, like VIX being below 10 or an established new low level + other… Then the optimal time to put a VIX trade on is very late on a Friday if smash down is in progress?
Thoughts on that?
With this morning move, we have to be looking at the hourly main (sorry bears). Making this up move a subminuette 1 of a minuette 3 I believe? So care, a sharp subminuette 2 back down to close to 2652 shouldn’t be surprising. On the other hand, price has busted the 62% fibo of yesterdays downmove, and the 76.4% is being approached. If THAT goes, my guess is 2672 is cracked today and it’s new ATH time yet again.
Wham bam!!
Kevin,
We have to trade the market that is in front of us. The fireworks are just getting started and I see higher prices with leadership from FAANG. There will be time for some back filling but the current market behaviour is not indicating any. Don’t forget we had the same bullishness in previous bubbles as well and it took a long time for bubbles to pop.
Time for the subminuette 2. Note that the subminuette 3 of this 3 up is likely to occur early next week, as the tax vote occurs. Some think that bill is priced in. I do not, and today’s action is just a bit more confirmation of that view, to my mind. I suspect the bull might seriously roar next week.
“Everything is proceeding as I have foreseen…”
Oh garbage, everything is proceeding as market dynamics say things tend to go. You bust the 74%, you are going to at least the 100%, and usually the 127%. Price is still a tad short of the 127% here, but it just might be “2” time nonetheless. Again, I suspect a 2 sets up and completes just as that vote next week gets to a certainty. That should lead to a 3 of a 3, and I like those.
Kevin,
I see OIL ramping into 2018 summer and am going to play it accordingly.
I see on the weekly oil has been moving up over the last 6 months. That said, there’s resistance up ahead (the highs from a year or more back); you might want to be careful about turns down there, and overall, just a lot more ranging in the established long term range. I don’t directly trade oil; I look for oil to be popping on a daily basis, and use that to inform me that equities/etf’s like OIH or HAL should be popping, and I trade those.
It is not very often that you get to take market makers out back and administer a very royal “spanking”. I am going to be quite busy in that regard today…he! he!
They are stepping on VIX’s neck early in cash market! It reeks of desperation!
AG may break out higher soon… to above 200DMA and new 3 month highs.
Price of Silver up 1.07%
They are toast. And if they don’t know it, they will soon wake up and smell otherwise… 🙂
XIV is going to open at a new ATH, even as SPX is pulled back and in a downtrend in the short term. XIV discounts much further into the future than VIX does, as XIV is a blend of futures across different months, while VIX is strictly based on options with expiry within 30 days. Ergo, XIV seems to be screaming “bull market”. So while there may be more down in the very short term, I’m not really expecting much honestly. Away we go…
9 of 10 SPDR sectors green so far this morn (real estate only slightly red).
Good morning!
As expected, we have a sea of green everywhere with OPEX upon us.
I suspect an awful lot of folk are being set-up for a whole world of hurt.
They are still mightily trying to send VIX back below the 10.00 pivot.
It would seem they have not been paying close attention…!
Have a great day everyone! 🙂
I’m loading up
The strong candlestick pattern on VIX with a Bearish signal for the market may be a false signal??? or NOT???
Or the overnight manipulation crew is out in full force (It takes much less capital to manipulate overnight).
Will they pull off their con job and fool the cash market today???
Whatever, one this is sure, it should be an very interesting day.
The overnight manipulation crew out in full force here in the last 10 min before the open biding up futures.
YM (DOW) went from +60 to +110 in the blink of an eye.
One other quick note–tomorrow is triple-witching day, so volume will be heavy. The resulting impact on the OBV chart will be interesting.
Very interesting to see the downwards signals from OBV. Throughout the current 14 month run, OBV has been a leading signal for some of the most decisive breakouts.
I’ve been keeping a close eye on RUT. It seems to have strong support from trendlines at the current level, but is starting to show weakness at the weekly MACD level. Previous weekly MACD crossovers occurred in late February and late July and gave rise to the two weakest months of this year (March and August).
My current thesis Bo is that daily flickers in OBV aren’t very good short term leading indicators. Ala, today. Weekly, I pay more attention to OBV, but I just suspect the “noise” in OBV at the daily level is too large to make it extremely useful, at least in current market conditions. I could be wrong and getting misled by a small number of recent data points I suppose, but until I see OBV acting reasonably consistently again as a leading indicator, I discount its significance.
I like the way Elliott wave principles spells out what the market is up to. The way it can forecast short and long range patterns is really fascinating content. It is a very complex system but what isn’t in the financial markets. Guidelines of wave formation along with other approaches is not a walk in the park. Market behavior is somewhat like human behavior and unfortunately we all experience ups and downs. We are not programmed to keep on climbing like robots, human nature learns from the mistakes and develops, hence motive and corrective structures. However, most uncertainties can be avoided by developing charts. Just my two since. S&P hit all targets and is still avoiding a corrective wave, just like social nature where we are all looking at good future economic views. When ever we do get a correction I think it’ll just be an exhaustion unless human nature messes with it.
I’m going to be first today with an important message to all members about comments guidelines.
It has been bought to my attention that some comments here are putting some people off participating.
The purpose of having comments is to add value to your membership. Sharing analysis, trades and charts is encouraged. Particularly from experienced members and traders.
However, discussion of divisive subjects like Trump is causing some members to not participate here.
In order for comments to achieve their purpose I will be deleting anything which is not related to the markets and market movement. Apart from innocuous chat amongst members that cannot cause any division.
If any members have found occasion to be put off participation in comments I would love to hear from you. Please email me admin@elliottwavestockmarket.com. If you can be specific with the topics or comments that have put you off that would help me in moderation. I will take all view points into consideration.
Thank you all for your understanding. Let us make this space more supportive of our trading and so lead us all to greater profits.
I see Trump derangement syndrome has made it to the board.
Sorry, I could not resist, feel free to delete what you want… But De-regulation and Tax Policy Matters and it is his agenda.
The Economic agenda of Trump is being implemented as we speak and the expectations of that agenda has driven markets since the election. That’s just a fact! The small business confidence indexes have risen since election day and have been through the roof for several months.
Markets move on expectations and imo may sell on the news. Details on final bill tomorrow and final procedural vote early next week. Then its the law.
My post again from two days ago!
The Proof is in the numbers and they are accurate.
NO Doubt that the Expectation of President Trump’s agenda (Mainly Tax Reform + other) would be implemented…
is ALREADY reflected in current stock prices.
No other way to explain these gains, it’s certainly not the 2%-2.50% increase in GAAP earnings or small revenue top line growth since that 11-8-16 date!
Since 11-8-2016 – Markets Since Election Day
To Close 12-12-2017
DOW
—————–
24,504.80
UP 6,172.06
UP 33.67%
=========
NASDAQ COMPOSITE
———————————
6,862.32
UP 1,668.83
UP 32.13%
========
S&P 500
—————
2,664.11
UP 524.55
UP 24.52%
=========
The Buy and Hold Crew did very, very, very well, I wish I was one of them this time around!
It’s time to sell on the news of final tax bill (final details) being put into law. The Final details may be agreed to later today and I would assume a summary of it will be released. Final full text to be completed over the weekend and released early next week with final vote (procedural) to immediately follow.
I guess I could just use President… instead of his name, Trump.
Miss me Doc?
Fast bunny!
Yes indeed! I am the “Hasty Hare!” who soundly defeated the “Lightening Rod!” 🙂
Well, Bugs, I am here again. Or is is hare again. Either way, first place might not be so easy as we race into Christmas, my fury friend.