
Yesterday’s analysis expected a little upwards movement to a short term target at 2,672, to then be followed by a pullback. Price began the session with a new high to 2,671.88 and from there turned downwards to complete a red daily candlestick.
Summary: For the very short term, at least a little more downwards movement may be expected tomorrow. Assume the trend remains up while price remains above 2,624.85. The target is at 2,773.
A new low below 2,624.85 would indicate more downwards movement to a target at 2,607 – 2,600.
A new low below 2,557.45 would indicate a multi month pullback or consolidation has arrived.
Last monthly and weekly charts are here. Last historic analysis video is here.
The biggest picture, Grand Super Cycle analysis, is here.
MAIN ELLIOTT WAVE COUNT
WEEKLY CHART
Click chart to enlarge.
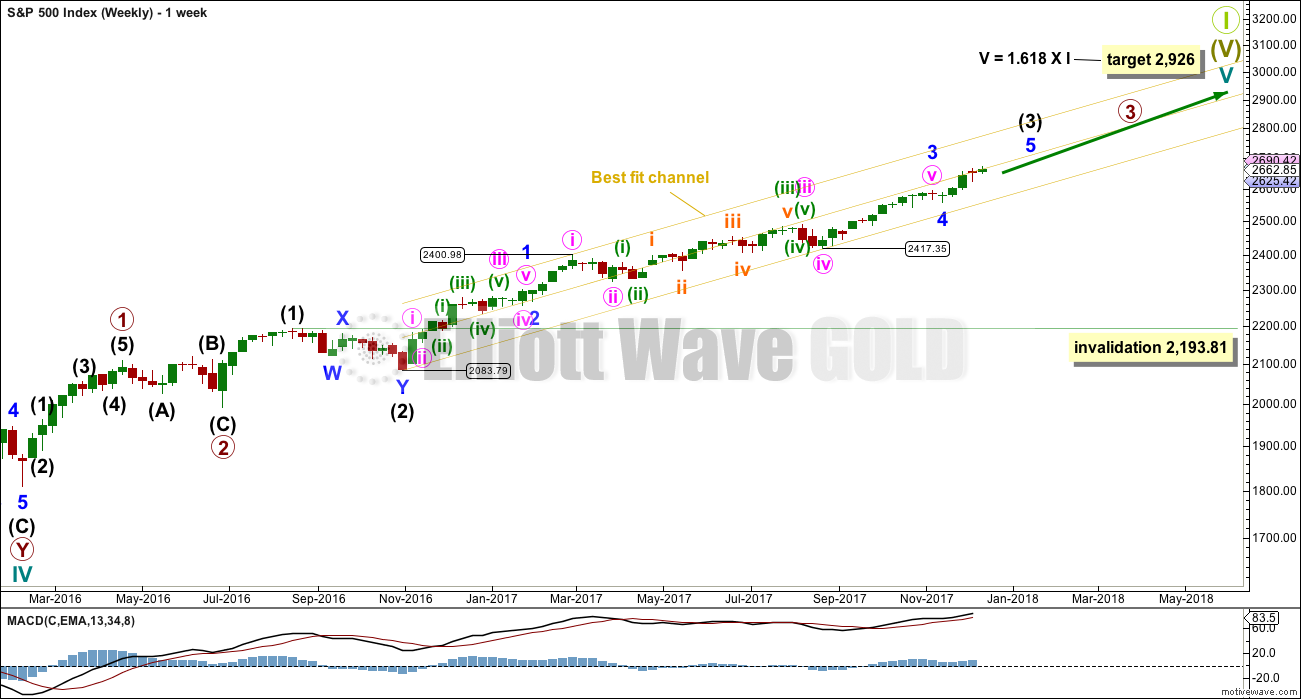
Cycle wave V must complete as a five structure, which should look clear at the weekly chart level. It may only be an impulse or ending diagonal. At this stage, it is clear it is an impulse.
Within cycle wave V, the corrections for primary wave 2 and intermediate wave (2) both show up clearly, both lasting several weeks. The respective corrections for intermediate wave (4) and primary wave 4 should also last several weeks, so that they show up at weekly and monthly time frames. The right proportions between second and fourth wave corrections give a wave count the right look. This wave count expects to see two large multi week corrections coming up, and the first for intermediate wave (4) may now be quite close by.
Cycle wave V has passed equality in length with cycle wave I, which would be the most common Fibonacci ratio for it to have exhibited. The next most common Fibonacci ratio would be 1.618 the length of cycle wave I.
Intermediate wave (3) may now be nearing completion (the alternate hourly wave count looks at the possibility it could be complete at the last high). When it is complete, then intermediate wave (4) should unfold and be proportional to intermediate wave (2). Intermediate wave (4) may be very likely to break out of the yellow best fit channel that contains intermediate wave (3). Intermediate wave (4) may not move into intermediate wave (1) price territory below 2,193.81.
The yellow best fit channel is redrawn. Price points are given so that members may replicate this channel. This channel is copied over to the daily chart.
DAILY CHART
Click chart to enlarge.
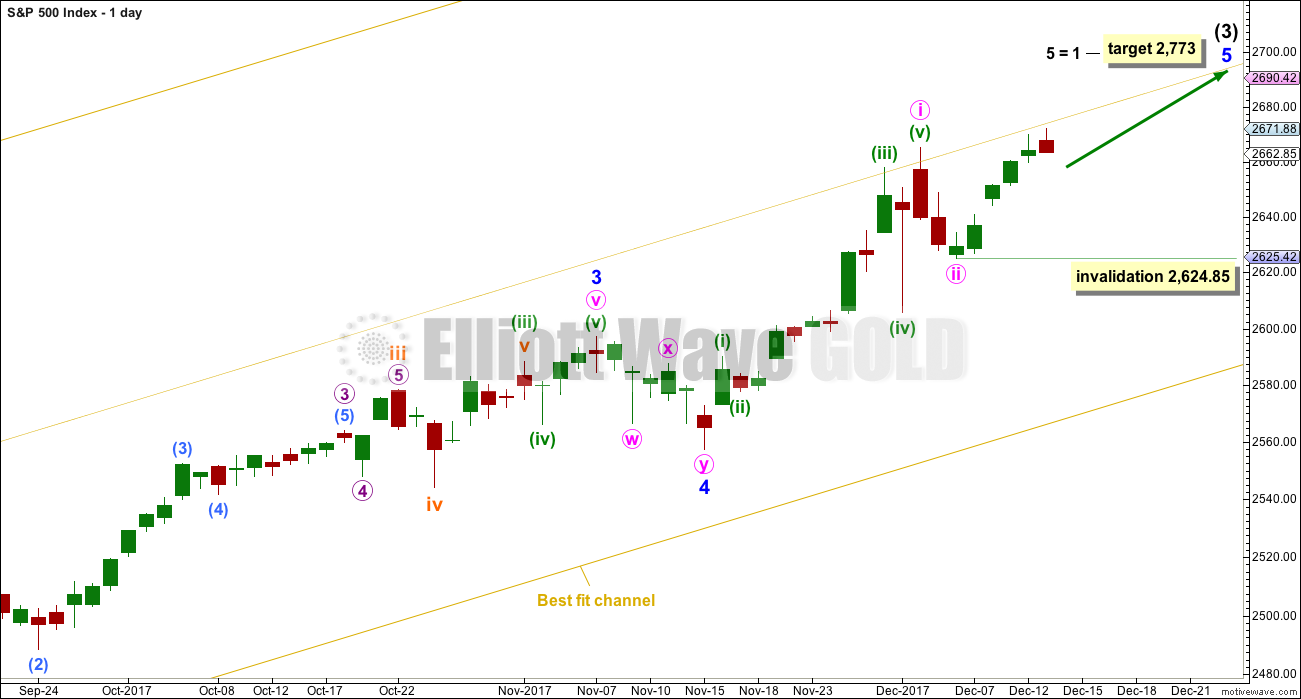
The main wave count will now expect that within minor wave 5 minute waves i and ii are complete.
Within minute wave iii, no second wave correction may move beyond its start below 2,624.85.
The target expects minor wave 5 to exhibit the most common Fibonacci ratio to minor wave 1.
Price is finding resistance about the mid line of the best fit channel.
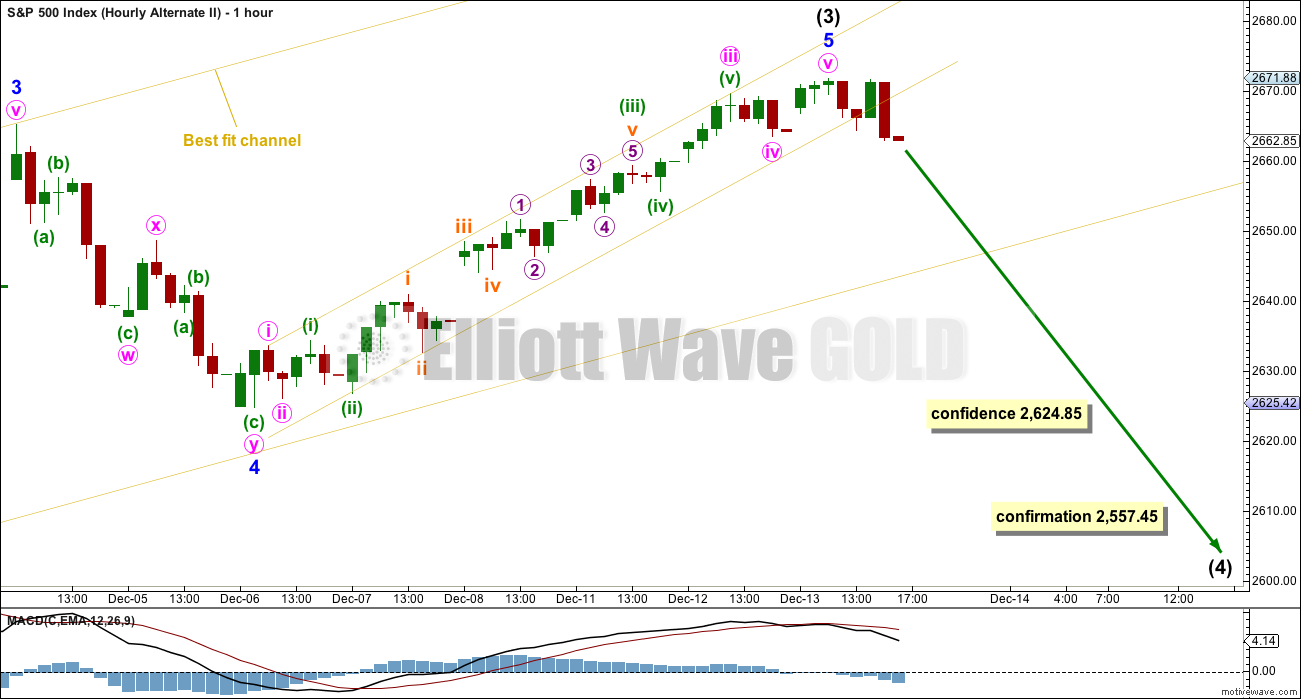
HOURLY CHART
Click chart to enlarge.
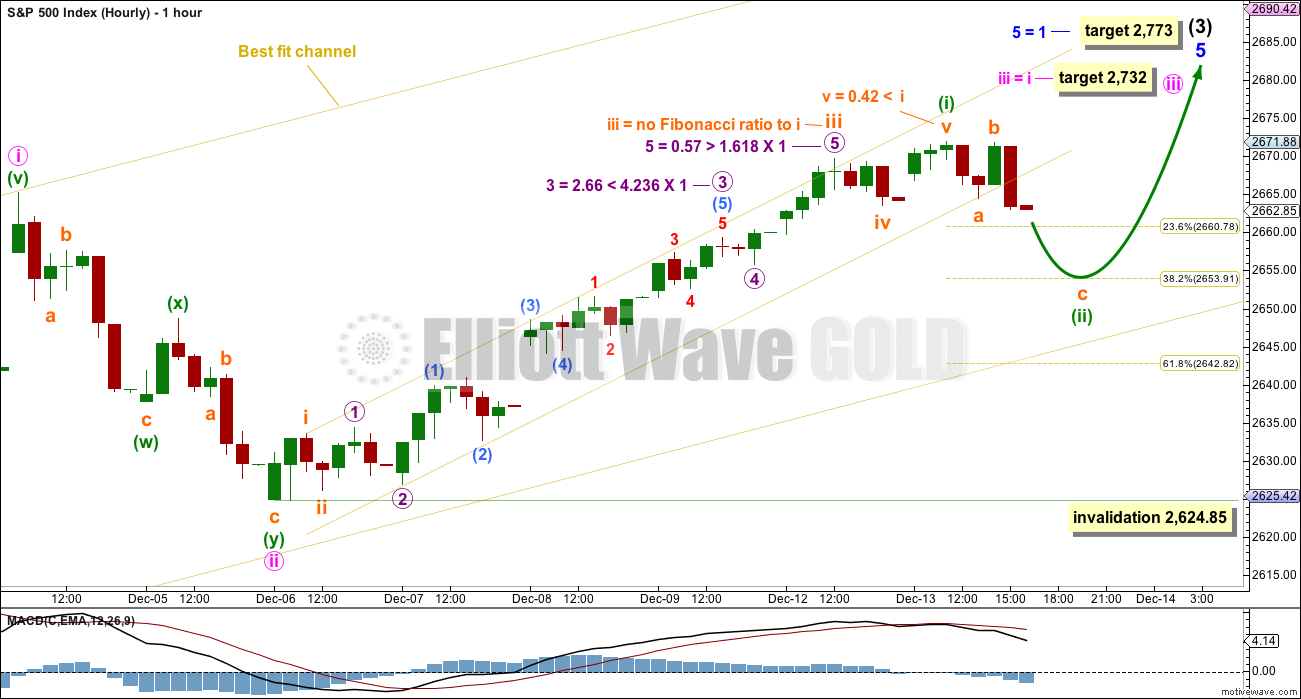
Minute wave iii may only subdivide as an impulse.
Within minute wave iii, only minuette wave (i) may now be complete. Minuette wave (ii) may complete tomorrow, ending about the 0.382 Fibonacci ratio of minuette wave i at 2,654. Close to this point, at 2,652, subminuette wave c would reach 2.618 the length of subminuette wave a. However, the labelling within minuette wave (ii) may change tomorrow as it continues.
When minuette wave (ii) is over, then minuette wave (iii) upwards should exhibit an increase in momentum.
ALTERNATE HOURLY CHART
Click chart to enlarge.
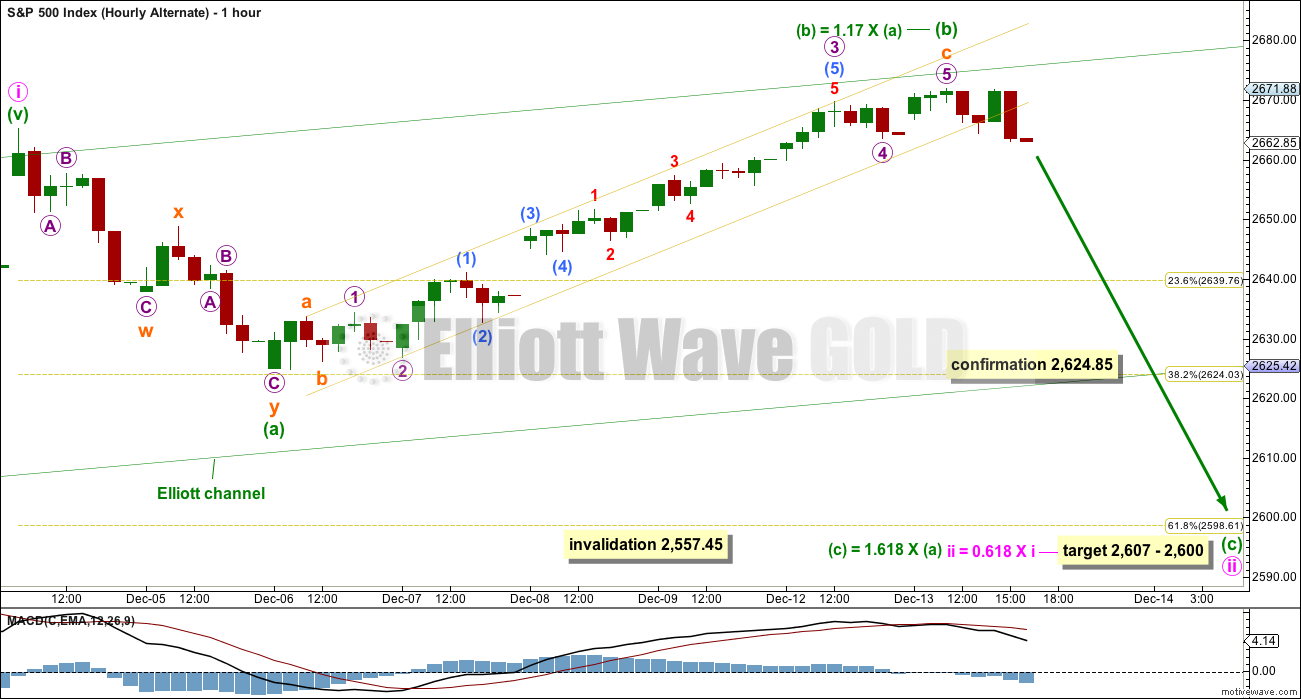
It is still possible that minute wave ii may not be complete and may be continuing as an expanded flat correction.
If price makes a new swing low below 2,624.85, then the target for downwards movement to end would be 2,607 to 2,600. This assumes the most common Fibonacci ratio between minuette waves (a) and (c), and the most common point for minute wave ii to end at.
Minuette wave (c) may last six days if minute wave (ii) exhibits a Fibonacci duration of thirteen.
SECOND ALTERNATE HOURLY CHART
Click chart to enlarge.
A more bearish option is still technically possible. It is possible that intermediate wave (4) may begin here or very soon.
A new low below 2,624.85 would add a little confidence in this idea.
A new low below 2,557.45 is required for confirmation of this idea. Only then should it be taken seriously.
Intermediate wave (4) may last about three months. It may be a choppy overlapping large consolidation, or a deep sharp pullback (which may be over more quickly than three months). It should have some reasonable proportion to intermediate wave (2), so that the wave count has the right look at the weekly time frame.
Four bearish signals in a row now from On Balance Volume offer some support to this wave count. However, the AD line continues to rise and this contradicts the On Balance Volume bearishness. It would be best to let price tell us if this wave count is correct.
TECHNICAL ANALYSIS
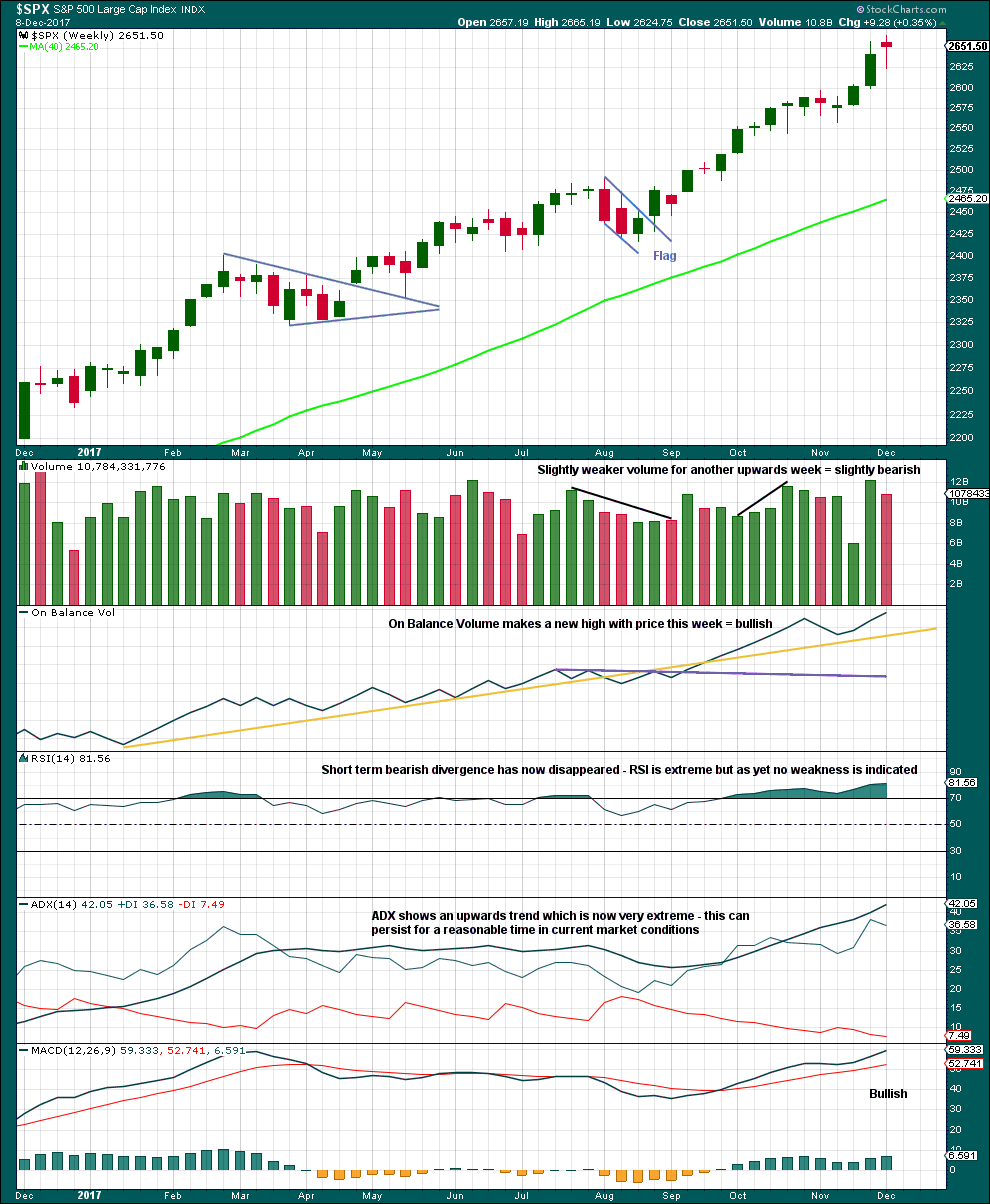
WEEKLY CHART
Click chart to enlarge. Chart courtesy of StockCharts.com.
There is no candlestick reversal pattern yet at highs.
Price and On Balance Volume continue to make new highs. This is bullish.
The trend is extreme, but as yet there is no reversal signal at this time frame.
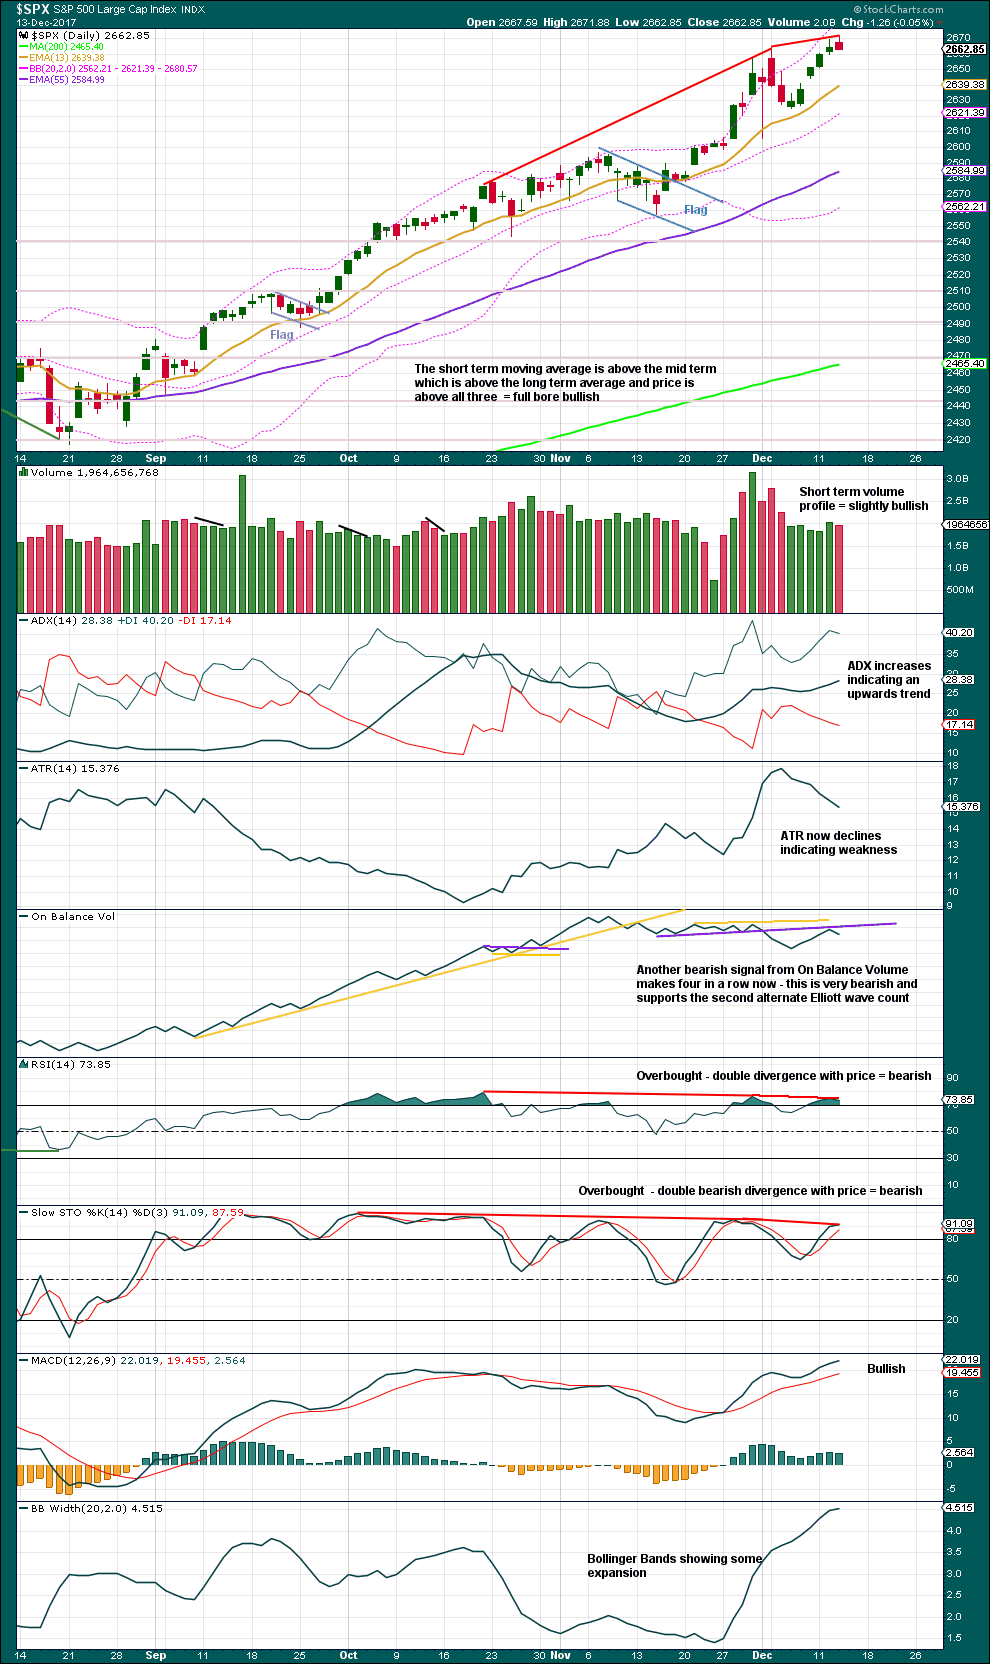
DAILY CHART
Click chart to enlarge. Chart courtesy of StockCharts.com.
This chart still looks reasonably bearish. This market is overbought and exhibits weakness; it looks susceptible to a reasonable sized correction.
However, price keeps on going up and we have to go with price. While price remains above the last swing low of the 6th of December, it seems reasonable to assume that the trend may well remain up.
But if price makes a new swing low, it would then look like a larger correction may have arrived.
There is divergence between price and On Balance Volume, Stochastics and RSI. ATR continues to decline.
What looked like a possible bullish signal yesterday from On Balance Volume has today turned into a clear bearish signal. The purple resistance line is very slightly adjusted.
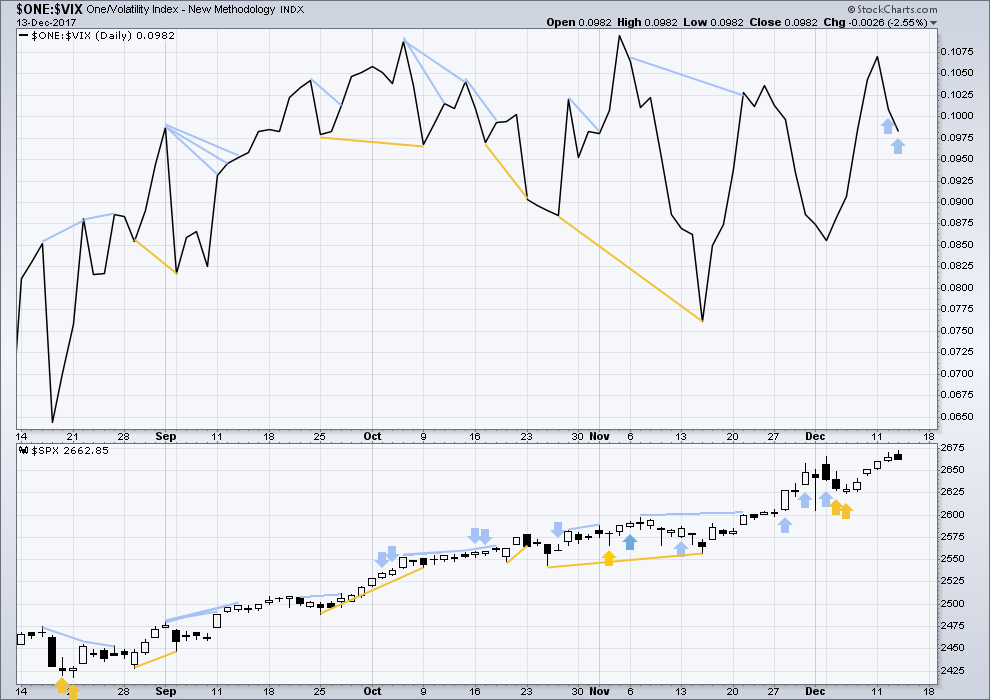
VOLATILITY – INVERTED VIX CHART
Click chart to enlarge. Chart courtesy of StockCharts.com.
So that colour blind members are included, bearish signals will be noted with blue and bullish signals with yellow.
Normally, volatility should decline as price moves higher and increase as price moves lower. This means that normally inverted VIX should move in the same direction as price.
Price has moved higher for two days in a row now, but inverted VIX has diverged. The rise in price does not come with a normal corresponding decline in market volatility; volatility has increased. This indicates weakness today within price and is bearish.
BREADTH – AD LINE
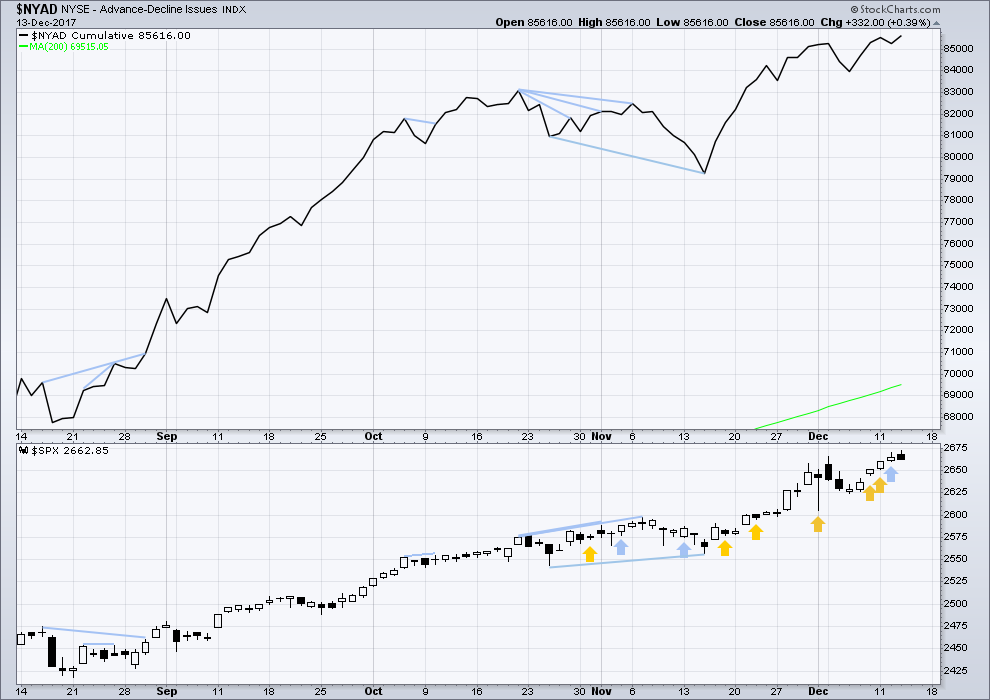
Click chart to enlarge. Chart courtesy of StockCharts.com.
There is normally 4-6 months divergence between price and market breadth prior to a full fledged bear market. This has been so for all major bear markets within the last 90 odd years. With no longer term divergence yet at this point, any decline in price should be expected to be a pullback within an ongoing bull market and not necessarily the start of a bear market.
All of large, mid and small caps last week have made new all time highs. The rise in price has support from market breadth.
Breadth should be read as a leading indicator. The new high in price is matched by a new high for the AD line. The rise in price has support today from rising market breadth. This is bullish.
DOW THEORY
The DJIA, DJT, and S&P500 have last week made new all time highs. Only Nasdaq was unable to make a new all time high.
The following lows need to be exceeded for Dow Theory to confirm the end of the bull market and a change to a bear market:
DJIA: 17,883.56.
DJT: 7,029.41.
S&P500: 2,083.79.
Nasdaq: 5,034.41.
Charts showing each prior major swing low used for Dow Theory are here.
Published @ 09:07 p.m. EST.
I am expecting those very red futures numbers to be replaced by a sea of green prior to the open tomorrow, lol! I expect it will be an rip roaring day with bulls and bears alike being tossed around like rag dolls…he! he! 🙂
Hey Joseph, regarding the Three White Soldiers…you were saying?! 🙂
I was sorely tempted to retort “Not so fast” when you posted that but I frankly thought you might be right. Never say “Never!” lol!
I know and VIX is still moving higher. What time does that stop trading?
After 4:pm it removed some of the wick. Now you can barely see it.
So what does Three White Soldiers mean as it relates to this VIX animal?
100DMA at 10.74 and 200DMA at 11.04 / I see last price at 10.49
I don’t know if candle sticks function well for VIX but here is the definition.
Three green Soldiers:
This candlestick pattern creates a stairway for higher prices. It is a bullish reversal pattern formed with three candles.
The three candles are green, each consecutive candle opens within the real body of the previous candle.
The close of each day brings the market to new highs, signaling an uptrend is about to take off.
I went back as far as I could still see the candles on a daily and there have not been any of these for VIX back at least 3 Years.
That’s what I see too, with the correct definition. I went back to January 2015 and couldn’t find one.
I can find instances with three green candlesticks in a row, but not fitting the definition for three white soldiers. Wicks too long or big gaps….
Yep! VERY rare…very rare indeed…! 🙂
To me it confirms steady short term accumulation, and what is notable about that is there has been truly manic attempts to keep it below 10.00. Strong confident hands are buying….
On the other side of the coin, somebody continues to short vol futures with a vengeance as SVXY and UVXY made new all time highs and lows today respectively. Let the insanity continue.
Looks like an ED in ES and if that is right, we completed a fourth wave today so after a swift fifth wave up tomorrow a lot of folk are going to be in a lot of pain…!
If you see VIX shoot higher tomorrow along with market price heading up….well, need I say more?! 🙂
Main hourly chart updated:
Although the target is met and slightly exceeded, it looks like a final small fifth wave down may be required to complete the structure. Perhaps to find support at the lower edge of the channel?
Yep! We got the fifth down right at the close! Bingo! 🙂
VIX rallied just before & at the close.
Can you call whats here Three White Soldiers? Daily
That’s as close as you’re going to get with VIX I guess.
Bearish engulfing candle in DJI too…
Look at the SPX, ES and YM candles also as it closes out here at 5PM ET.
Yes. I can see Three White Soldiers.
I can see this has happened before. As recently as 28, 29, 30th November. Blue arrows point out these on the chart.
And before that in June 2016 and September 2016.
Lara,
To call it that, I thought they had to be full body with almost no wick.
Your examples have long upper wicks on the 3rd candle.
I am probably wrong, but that is what I always thought.
I am so sorry, you are absolutely right.
From Nison:
“The three white soldiers are a gradual and steady rise with each white line opening within or near the prior session’s white real body. each of the white candles should close at, or near, it’s highs. It is a healthy method for the market to rise (although if the white candles are very extended, one should be cautions about an overbought market).”
And so, with that definition:
for what we have of the last three days in VIX , day two and three opened within the prior sessions candlestick body, and all of days one, two and three have closed at or near highs.
And so we do today have a three white soldiers pattern in VIX.
But the other one I point out in this chart above is not.
🙂
What I see: NDX is holding quite strong! Bullish.
VIX futures (as represented by XIV): shockingly strong in the face of today’s small sell off. Very bullish.
RUT: whippy as heck these days; maybe such a big sell off because Rubio is holding the tax theft plan hostage? I dunno.
SPX: had held for the moment around the 38%. If it fails, the 62% is likely. A higher swing low above that 38%, and perhaps this 2 is over.
Swing low above 38% in place now and off to the bull races perhaps! Next challenge will be busting the established downtrend line and the 23.6% retrace above; they are roughly in the same position now re: the timing and approaching price, 2660-2661.
I am waiting to see bell weathers gain traction and ramp NDX higher. Keeping a close eye out on AAPL, FB, GOOGL, and AMZN..indirectly these will pull SPX as well. Mid to late Feb 2018 might be a different situation (news dependent) IMHO.
Novel situation. Banksters facing pressure on two fronts…futures AND cash…
Three White Soldiers in VIX?
How high on this pop as compared to the last 2?
Do you think?
I see zero Three White Soldiers in VIX looking back a year.
It will once again face very stiff resistance at 14 so I expect it should go at least that high, unless correction very shallow…
Looking for the last time there were Three White Soldiers… but I can’t seem to see any.
There are other variations of candles with some green. Can anyone point out the last time it occurred?
I have never seen it… 🙂
That goes for today as well. Adios Three White Soldiers!
We will never see that.
RUT taking a turn back down. Not sure what to think here. 1508 and 1498 were recent previous floors and then there’s a whole lot of room beneath that. Yesterday’s high looks weaker in that context.
The correction is on! 23.6% retrace broken, and I don’t believe for a moment that “this is it”. More should be coming. Sequence of lower swing lows in place. I’m looking for a turn around a fibo then a higher swing low (a possible 1-2 in place) to start contemplating that a 3 might be launching (per hourly main).
VIX pop should be on deck…time to cash in some chips….
I never expected to see futures tanking during the cash session. Interesting.
Stock traders: I like the set up at the moment in restoration hardware (RH).
I’m watching NDX intently, as I think it may give the first signal of “what’s next”. It pushed up against it’s ATH and just keeps squeezing tighter, but not through, and no breakdown (yet). If it starts turning down with other markets following, I’m getting small fast. If it breaks up and through and other markets start to follow, I’m expanding. We shall see….
Last readings I saw had commercials heavy longs on NDX so be careful going short as the turn might surprise you.
TY! Staying away from shorts completely here; I’m using this action to try to get long at relative lows. (I’ve learned my lesson re: shorting a roaring bull market! Very challenging at best, “very unwise” comes to mind now too!).
Too rich for me… if I can’t get at least 1000 shs – I am not playing.
Sorry, I wasn’t clear. By “I’m expanding”, I mean, I think the markets will overall be lifting if NDX breaks up and through to new ATH’s. I’ll then be adding to my SPX (via UPRO) and XIV positions, and selective stock positions (I’m in SQ, RH, IAC at the moment). Best of luck on RIG!
AG doing well also as I described early today.
Just purchased
RIG at $9.64 per share
– Goal of trade to hold into Mid to end of January. To take advantage of tax loss selling that took place and the ultimate buy back in early Jan 18.
Also, will benefit from 100% Expensing in the Tax Bill and the Alaska area that will open up in that tax bill.
Also, it’s a Trump energy policy trade… = more USA offshore exploration and production.
Looks to me like and Excellent Chart set-up… right here
Here’s a multi-time frame view of RIG (weekly, daily, hourly, 5 minute, from top left and clockwise). I’d like to see a bounce off some kind of fibo support on the weekly and a weekly up bar, before considering an entry myself.
Looks like they took out the stops on RIG at just below the 100DMA of $9.61… crap… I got in a bit early, but looks like this hour is the buy…. for trade into 2018.
Thank you very much Joseph and Kevin for the tips!
I got stopped out of RIG for a 11 cent loss in the last 10 min…
I will be looking for a new entry tomorrow or the next few days.
AG looks go to hold as I planned for now, I removed the stop… for now.
I thought Rupert Murdoch was supposed to be a really smart dude. Why on earth is he doing an all stock deal with Disney at time when stocks are the most expensive in history? Is it because Disney is also going to assume 13 billion of debt as well?! Maybe he is crazy like a fox…!
Here’s a “Happy Holiday” recipe for those interested. Instead of damaging lungs in your consumption of fine herb, try this. Grind your herb to a flour like consistency in a mortar & pestle (or other means). Two minutes or so of hard hand grinding does it. To 2 part herb, add 1 part (or maybe a touch less?) olive oil (or any high fat oil). Mix well. The herb should be fully moistened, but still on the crumbly side, not “goopy”. Bake the mixture in the oven for exactly one hour at 280. This is “decarbooxylidation”, which breaks down the active ingredient from the plant material (not digestable!), and into the oil (digestable!). By virtue of the super high surface area from the grinding, “most” of the active ingredient gets extracted. After baking for one hour, let cool, then stuff the mixture into standard gelatin capsules (you can get a 100 for a few dollars, or just dump a few extra capsules you have of whatever and reuse those). Stuff full (a chopstick works great! The job is a little messy but everything cleans up fine with soap and water after). ONLY TAKE ONE OF THESE CAPSULES AT A TIME!! The theory (I can validate) is that you will get 3-5x more potency out of your herb this way than traditional inhalation means (smoking/vaping). Instead of only 10-15% of the active ingredient getting used, more like 50-80% is extracted. A capsule will take 1 to 1.5 hours to have an effect, and will last for another 3-5 hours. Aside from the expected effect, the only side effect might be a burp or two, because you are ingesting a tiny bit of non-digestable plant material. Last key point: unlike smoking/vaping, edibles like this can result in “overdose” so again, ONLY ONE AT A TIME. And don’t let your dog get these!!!
Smoke and hot vapor in lungs is Very Bad for your health. Try this “smokeless herb” recipe sometime! I’m giving some out as christmas gifts myself (completely legal to gift others in California, by the way, and all my herb is legally and organically grown outdoors here at home).
Stay healthy, stay chill, and Cheers!!!
LMAO
Thanks for the recipe Kevin! It’s still illegal here in NZ. We’re a bit slow this time. We may have a referendum (I think they should call it a reeferendum and have it on the 20th of April LOL) next election.
Speaking of dogs, I discovered the hard way that my black lab has a fondness for Cuban cigars when two Montecristos magically disappeared from my living room table and were subsequently found in the back yard, chewed to a proverbial pulp… 🙂
Just purchased
AG at $7.03 per share
– Goal of trade to hold into Mid to end of January. To take advantage of tax loss selling that took place and the ultimate buy back in early Jan 18. But that move could be here in late 2017.
Good Chart set-up… right here
Gap up to run stops of trades anticipating a pullback… 😉
The hourly looks extremely “turn-ish” to me, and that repeated knock and fail at 2672 (the 1.27) supports that thesis. A break to new lows after yesterday and then through the 23.6% at 2660.6 and the market’s going to go to some fibo retrace of Dec 6 low to 12 high.
23.6%: 2660.6
38%: 2653.6
50%: 2648
62%: 2642.5
76%: 2635.5
100%: 2524.3
(approximately)
Long and intermediate term trends UP…this pullback should it develop will be my opp to get a lot more long. Again.
Best to all this trading day!!
You too Kevin!
We hav a new technical term thanks to Kevin. It’s “turn-ish”.
Yep. 🙂 🙂 🙂
Good morning!
Futures pointing to another uneventful session. Looks like the correction will once again be shallow and short-lived.
Health care premiums are sky-rocketing. Very little of tax relief money for most families will go into the broader economy in ways predicted. It will mostly go to insurers’ bottom line. While I agree with repeal of the mandate, it will do nothing to fix the broken system. They are strangely silent on the one thing that would have brought down premiuns, and that is removing inter state barriers. Looks like the insurance lobby won that fight. Where is Rand Paul?
Oh yes, he got attacked did he not? 🙁
Most 1st and 2nd world countries offer comprehensive medical care to all their citizens. They eliminate the profit margin in the medicare care; they eliminate the profit margin in the insurance; the result? FAR better health outcomes than the US, and FAR lower cost of care. US lifetime expectancy is hugely diverging from these civilized country’s results! And the cost is diverging too; our costs are skyrocketing, while single payer nations are far less and growth is far smaller. To allow our current system to operate is immoral, unjust, and severely contrary to broad US interests. Except the interests of the profiteers at the top.
We indeed have the worst of both worlds. The government is by far the biggest player yet refuses because of corrupt politicians to exercise pricing power. Then they stifle true competition and limit choice for individuals by allowing in state oligopolies.
In the US we pay far more for healthcare, but the healthcare quality is among the worst, and many can’t afford it.
So true. I have a surfing injury. I was seen immediately by my GP, cost $18 (this is NZD). Three sessions with a physiotherapist, each time cost $25. Now off to have an x-ray and ultrasound, and maybe an injection, cost $40.
But then I do pay horrendous taxes and ACC levies 🙁 That is the downside.
Foist!
Dag nab it!