
All three hourly Elliott wave counts remain valid today. Members are given some trading advice on how to handle this uncertainty.
If a new all time high is seen tomorrow, then members will have an Elliott wave target to work with.
Summary: The main wave count expects downwards movement to begin next week to a target at either 2,599 or 2,586.
If price makes a new low below 2,557.45, that would indicate a multi week (about 10) correction may have arrived.
If price makes a new all time high tomorrow, then the next target would be at 2,732 for a small consolidation, and then 2,773 for the upwards trend to end for the mid term.
One approach to the uncertainty for the short term may be to open a hedge. The short side should be closed if price makes a new all time high. The long side should be closed if price breaks well below the small channel on the hourly chart with clearly downwards movement (not sideways).
Targets for the long side may be either 2,732 or 2,773. A target for the short side may be 2,599 – 2,595.
Always trade with stops and invest only 1-5% of equity on any one trade (or in total for a hedge). All trades should stick with the trend. The trend remains up.
Last monthly and weekly charts are here. Last historic analysis video is here.
The biggest picture, Grand Super Cycle analysis, is here.
MAIN ELLIOTT WAVE COUNT
WEEKLY CHART
Click chart to enlarge.
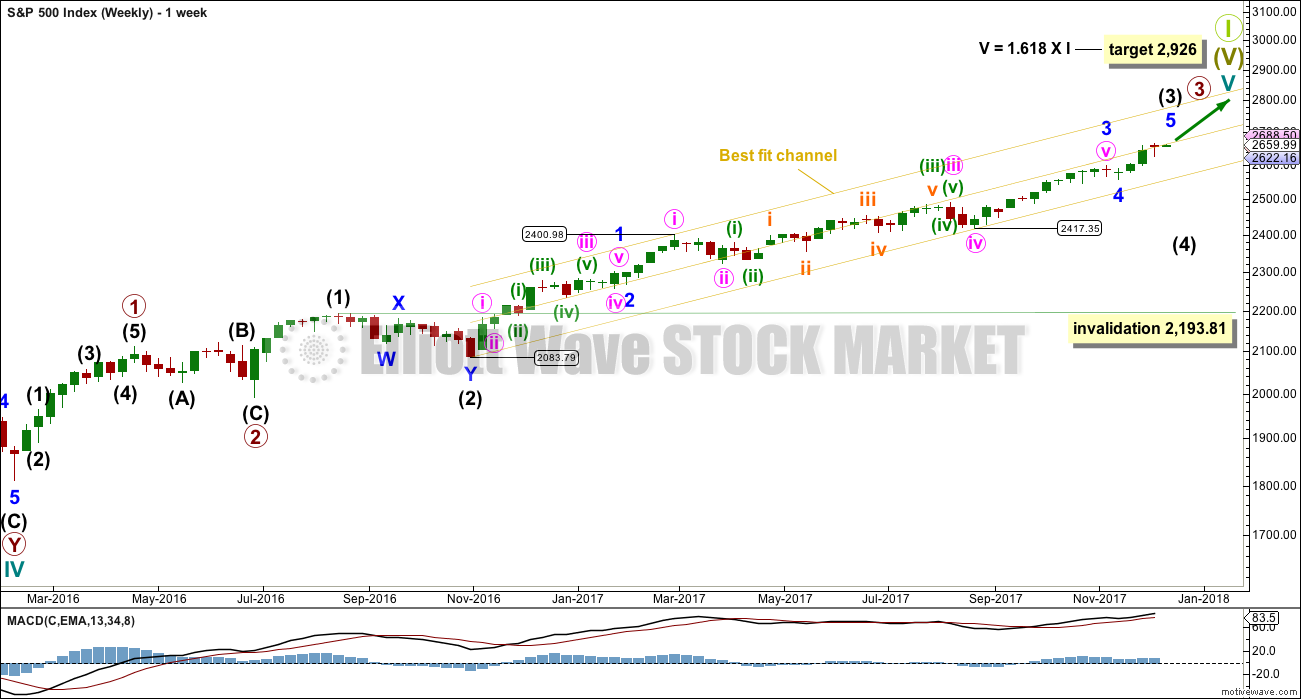
Cycle wave V must complete as a five structure, which should look clear at the weekly chart level. It may only be an impulse or ending diagonal. At this stage, it is clear it is an impulse.
Within cycle wave V, the corrections for primary wave 2 and intermediate wave (2) both show up clearly, both lasting several weeks. The respective corrections for intermediate wave (4) and primary wave 4 should also last several weeks, so that they show up at weekly and monthly time frames. The right proportions between second and fourth wave corrections give a wave count the right look. This wave count expects to see two large multi week corrections coming up, and the first for intermediate wave (4) may now be quite close by.
Cycle wave V has passed equality in length with cycle wave I, which would be the most common Fibonacci ratio for it to have exhibited. The next most common Fibonacci ratio would be 1.618 the length of cycle wave I.
Intermediate wave (3) may now be nearing completion (the alternate hourly wave count looks at the possibility it could be complete at the last high). When it is complete, then intermediate wave (4) should unfold and be proportional to intermediate wave (2). Intermediate wave (4) may be very likely to break out of the yellow best fit channel that contains intermediate wave (3). Intermediate wave (4) may not move into intermediate wave (1) price territory below 2,193.81.
The yellow best fit channel is redrawn. Price points are given so that members may replicate this channel. This channel is copied over to the daily chart.
DAILY CHART
Click chart to enlarge.
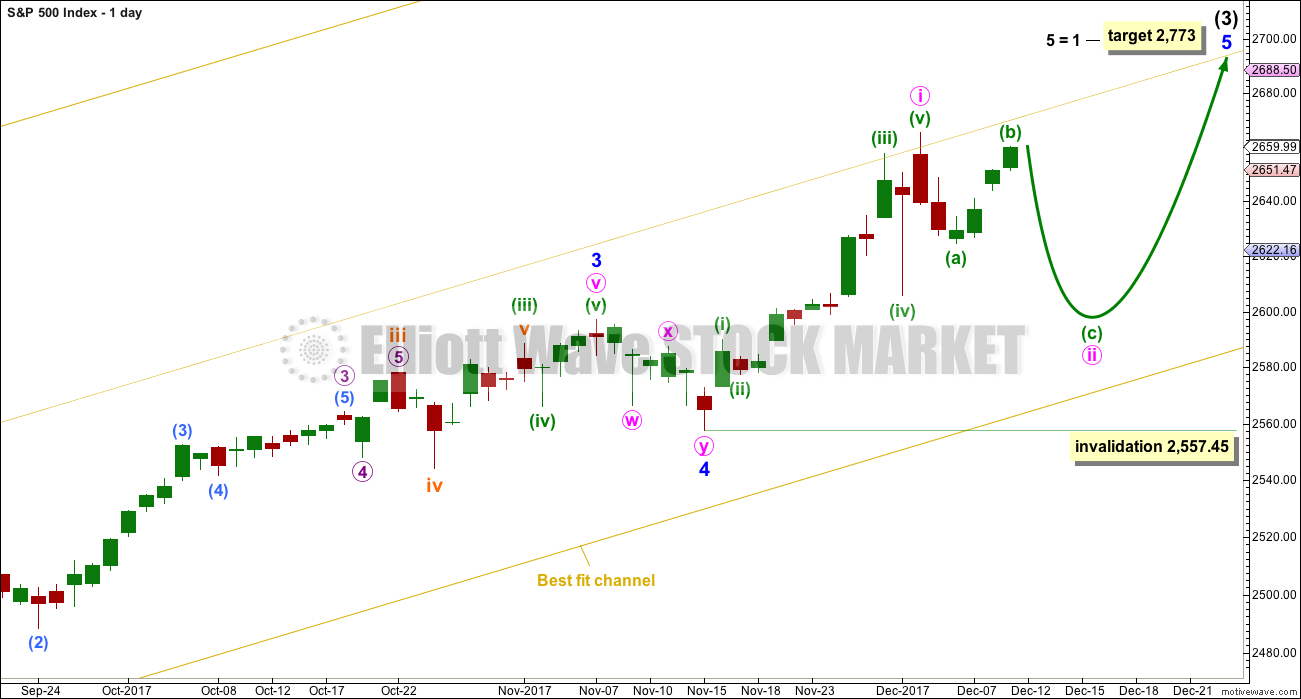
We should always assume the trend remains the same until proven otherwise. Assume that minor wave 5 is incomplete while price remains above 2,557.45.
The target calculated for minor wave 5 expects it to exhibit the most common Fibonacci ratio for a fifth wave. This target would not expect a Fibonacci ratio for intermediate wave (3) to intermediate wave (1).
Within minor wave 5, no second wave correction may move beyond the start of its first wave below 2,557.45.
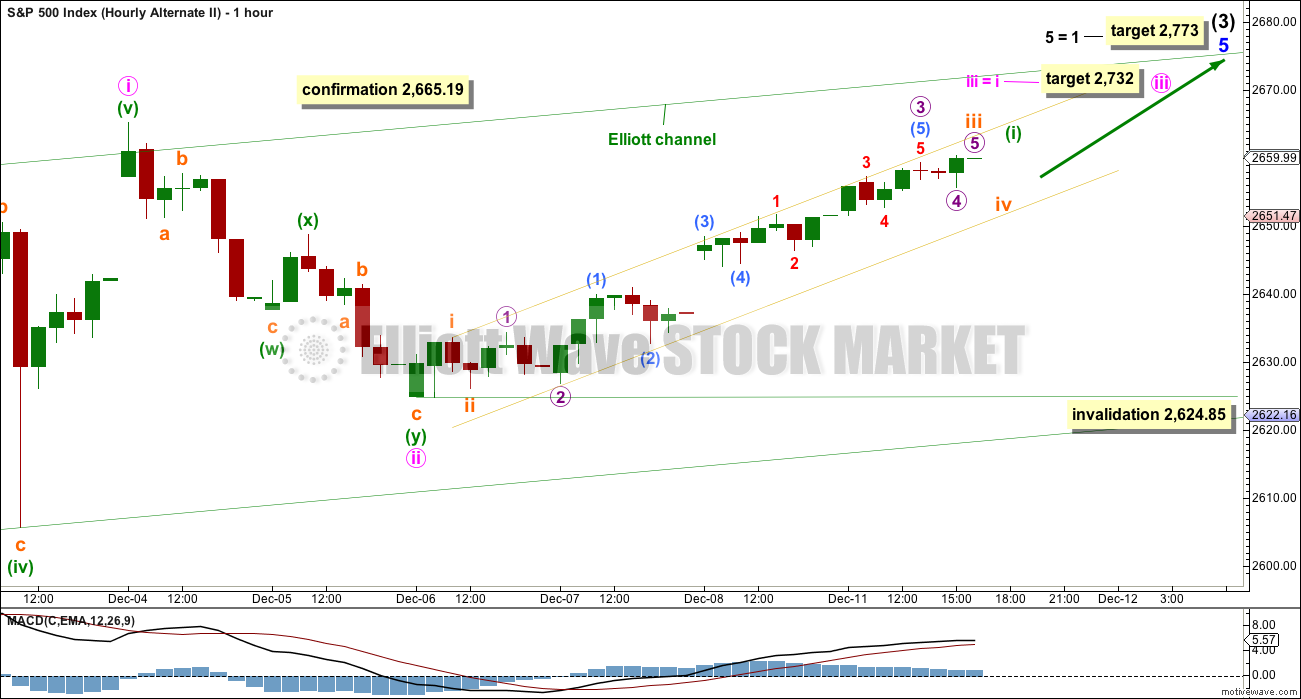
HOURLY CHART
Click chart to enlarge.
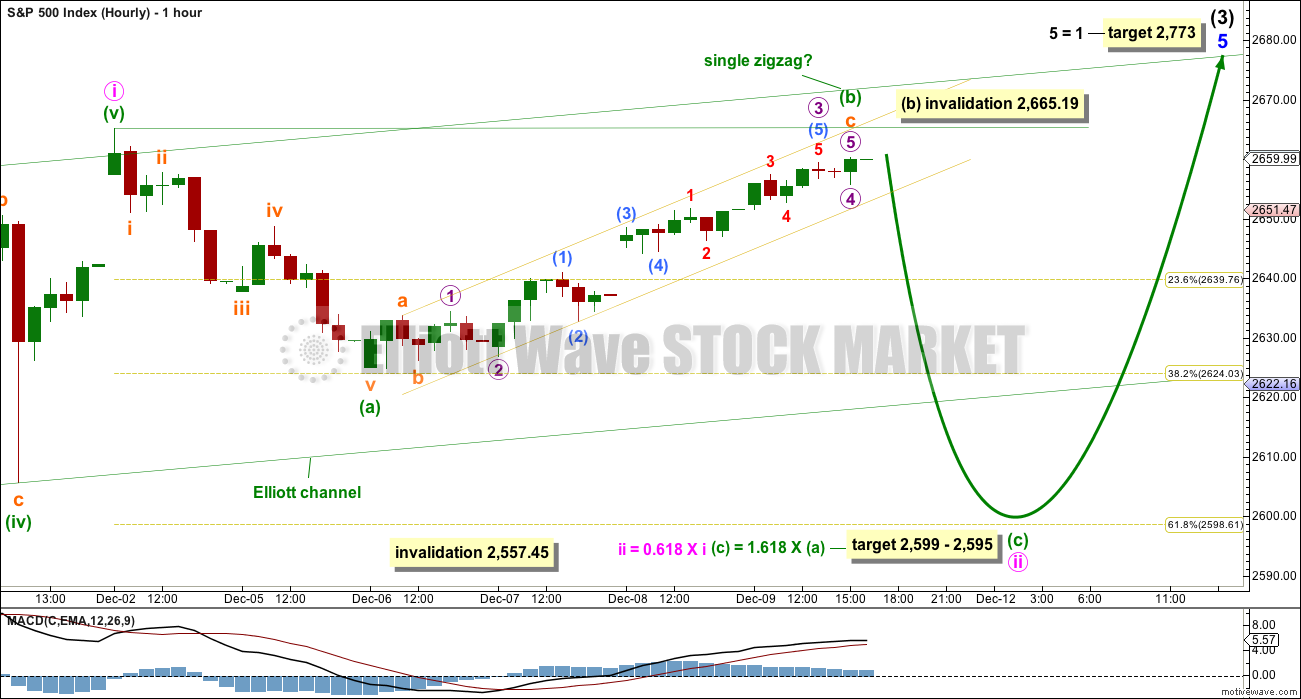
This first hourly chart follows on from labelling on the daily chart.
Minute wave ii may take another three days to complete if it totals a Fibonacci eight days. The target for it to end is now widened to a small zone.
There is a five down complete at the hourly chart level. It looks like this is now being followed by a deep bounce for minuette wave (b). Minuette wave (b) still fits as a single zigzag.
Minuette wave (b) may not move beyond the start of minuette wave (a) above 2,665.19. When minuette wave (b) is complete, then another five down should unfold for minuette wave (c).
A narrow best fit channel is drawn about minuette wave (b). While price remains within this channel, there is no evidence that minuette wave (b) is complete. However, it has almost no room left to move in now and should be over either here or early tomorrow if this wave count is correct.
If this wave count (or the first alternate below) is correct, then the small channel should be breached quickly tomorrow by clear downwards movement.
ALTERNATE HOURLY CHART
Click chart to enlarge.
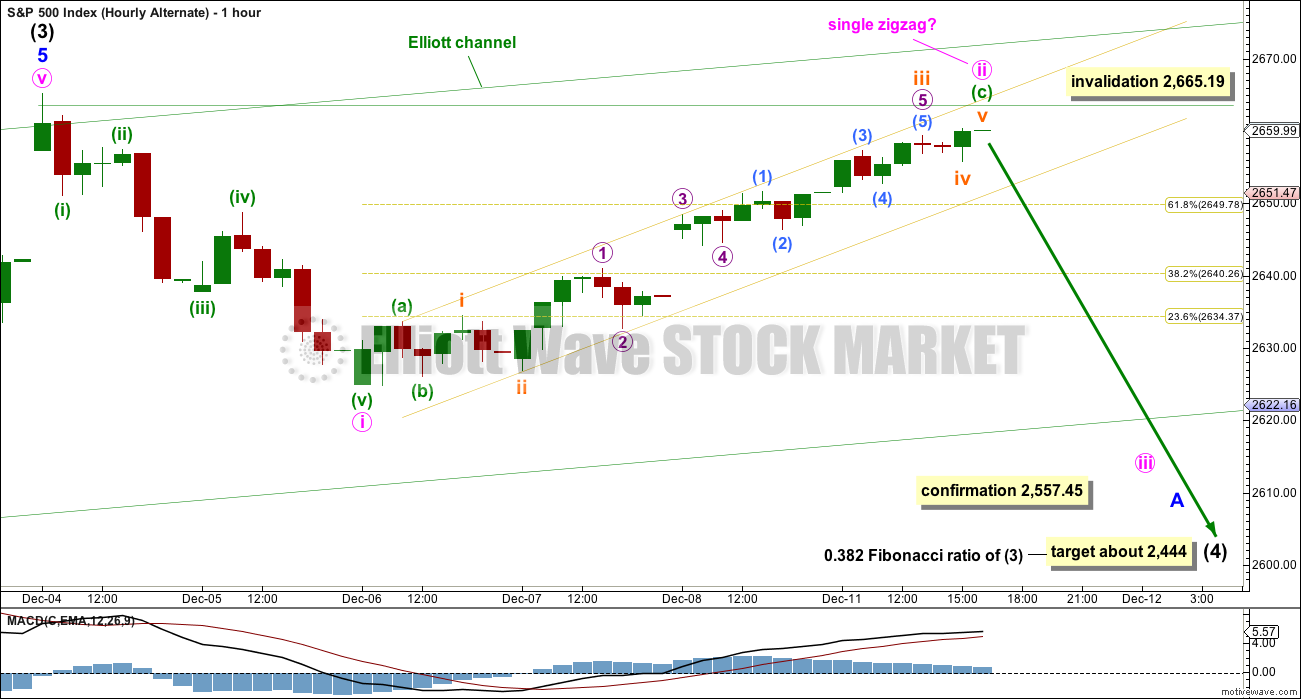
Because we should always assume the trend remains the same until proven otherwise, this wave count should be considered an alternate while price has not confirmed it.
By simply moving the degree of labelling within the five up from the end of minor wave 4 all up one degree, it is possible to see that intermediate wave (3) could be over.
If this wave count is confirmed with a new low below 2,557.45, then it would expect a multi week pullback or consolidation for intermediate wave (4) to last about ten weeks or so. If it is a complicated combination or a triangle, then it may be longer lasting, possibly a Fibonacci thirteen or even twenty-one weeks.
At this early stage, the 0.382 Fibonacci ratio of intermediate wave (3) would be a reasonable target.
For the short term (the next week or so), a trend change at intermediate degree should see a larger five down develop at the hourly chart level. So far only a first wave within that five down may be complete.
Minute wave ii may not move beyond the start of minute wave i above 2,665.19. It should be noted that for this alternate wave count the depth of minute wave ii fits with reasonably common behaviour. The very first second wave correction within a new trend can be very deep. The purpose of deep second wave corrections is to convince us there has been no trend change and the old trend remains, and they do this job very well indeed. They are fakes, and should exhibit weakness. This one does exhibit weakness, particularly in volume, and this is discussed below in more detail today.
Both wave counts expect overall the same direction next.
SECOND ALTERNATE HOURLY CHART
Click chart to enlarge.
A more bullish wave count should be considered because the AD line is giving bullish signals now two days in a row.
If price follows the AD line and makes a new all time high this week, then the last wave down cannot be seen as a five. It will fit as a double zigzag, although this does not have as good a fit. The S&P does not always have waves that have the right look though, so all possibilities should be considered.
If price makes a new high, then a low degree third wave should be underway. The target is for equality in length with minute wave i, because minute wave ii was shallow, and because it fits with the higher target for minor wave 5 to end.
Within minute wave iii, no second wave correction may make a new low beyond the start of its first wave below 2,624.85.
TECHNICAL ANALYSIS
WEEKLY CHART
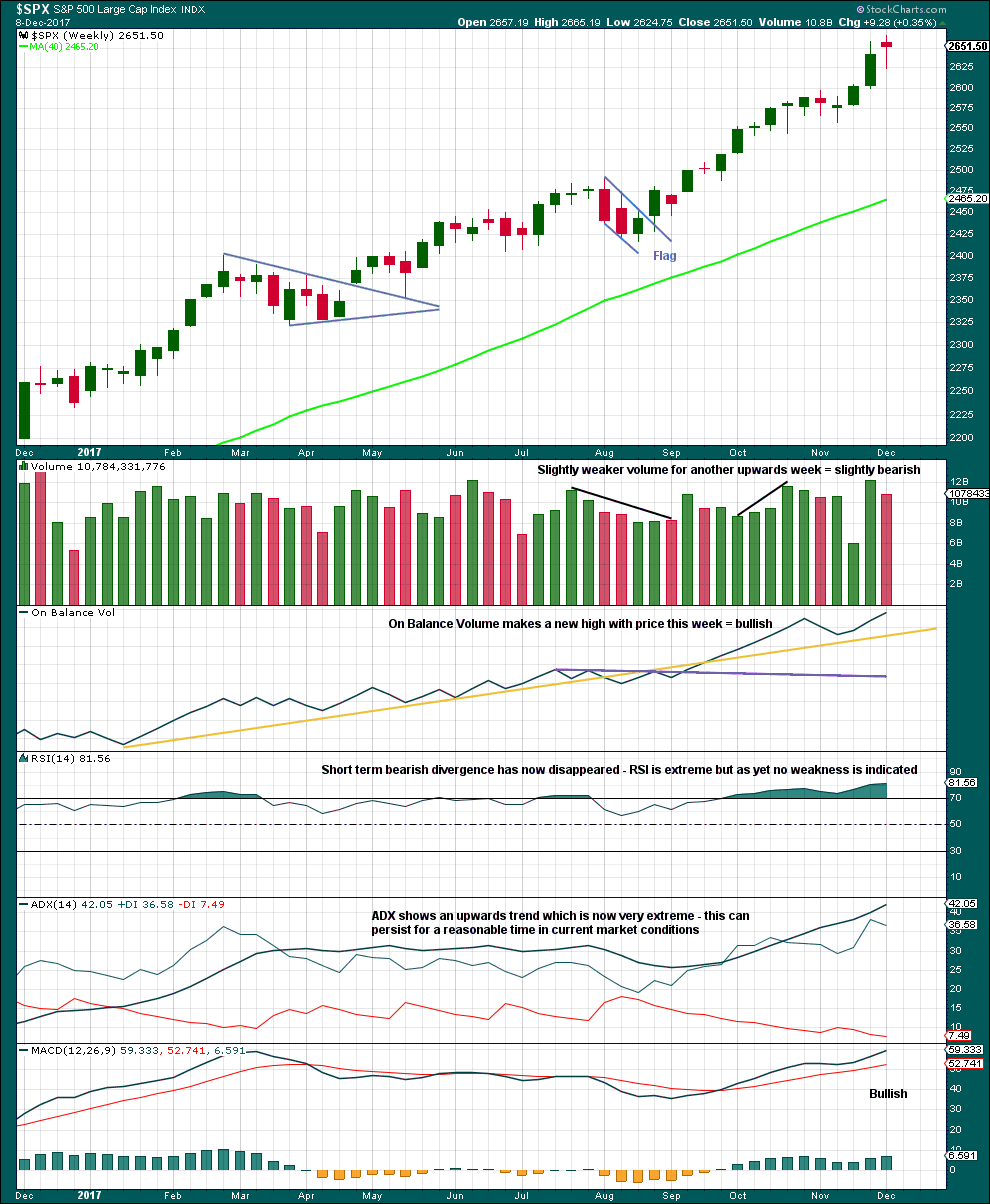
Click chart to enlarge. Chart courtesy of StockCharts.com.
There is no candlestick reversal pattern yet at highs.
Price and On Balance Volume continue to make new highs. This is bullish.
The trend is extreme, but as yet there is no reversal signal at this time frame.
DAILY CHART
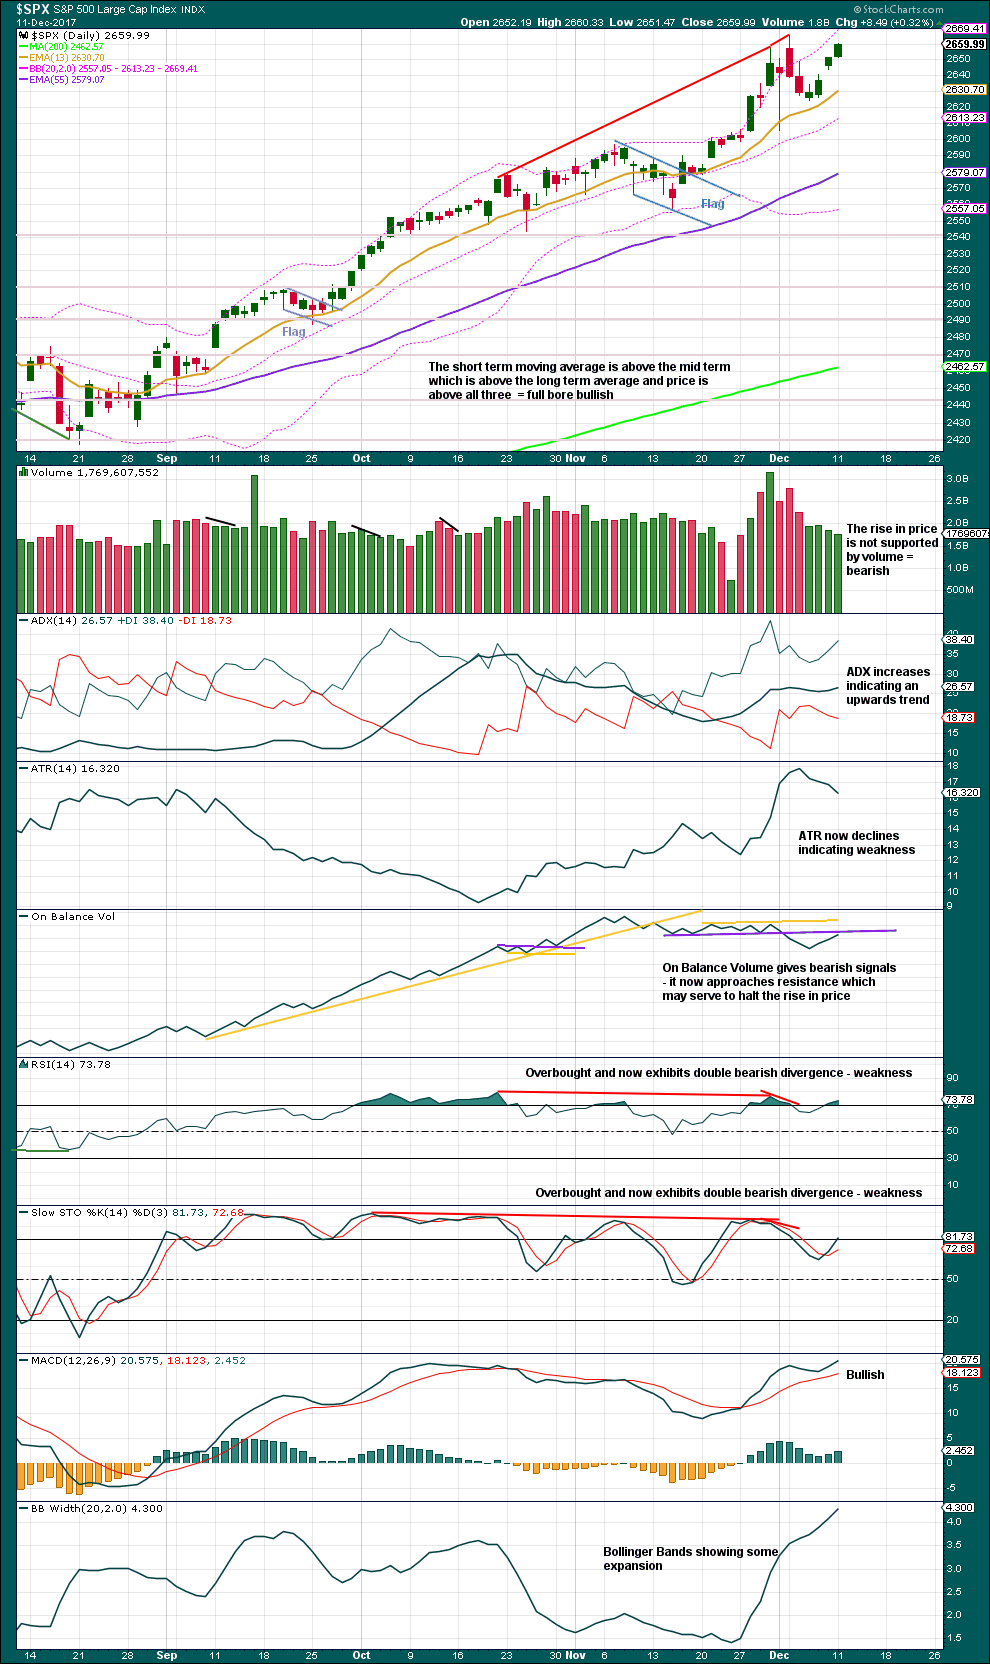
Click chart to enlarge. Chart courtesy of StockCharts.com.
Looking back at volume for the start of a bull run, at the end of May this year, six days straight of upwards movement came on relatively light and declining volume until the last day. On the sixth day some increase in volume occurred.
Rising price on declining volume has been a feature of this market for many months now, at all time frames. It is very clear at the monthly time frame, in particular since the low of March 2009.
And so although volume for the short term here is bearish, it will not be given weight in this analysis due to current market conditions. We must be flexible and change with a changing market.
The last bearish signals at the daily chart level from On Balance Volume were given on the 15th of June and the 22nd of June this year. That was during a short lived pullback of only 2%, which ended on the 29th of June. But at that time RSI was not overbought.
It may be that On Balance Volume here is indicating only another small short lived pullback and not a reasonable sized correction.
If On Balance Volume turns down here from resistance, then it would give another bearish signal and that should be given some weight.
This chart still looks reasonably bearish. This market is overbought and exhibits weakness; it looks susceptible to a reasonable sized correction.
VOLATILITY – INVERTED VIX CHART
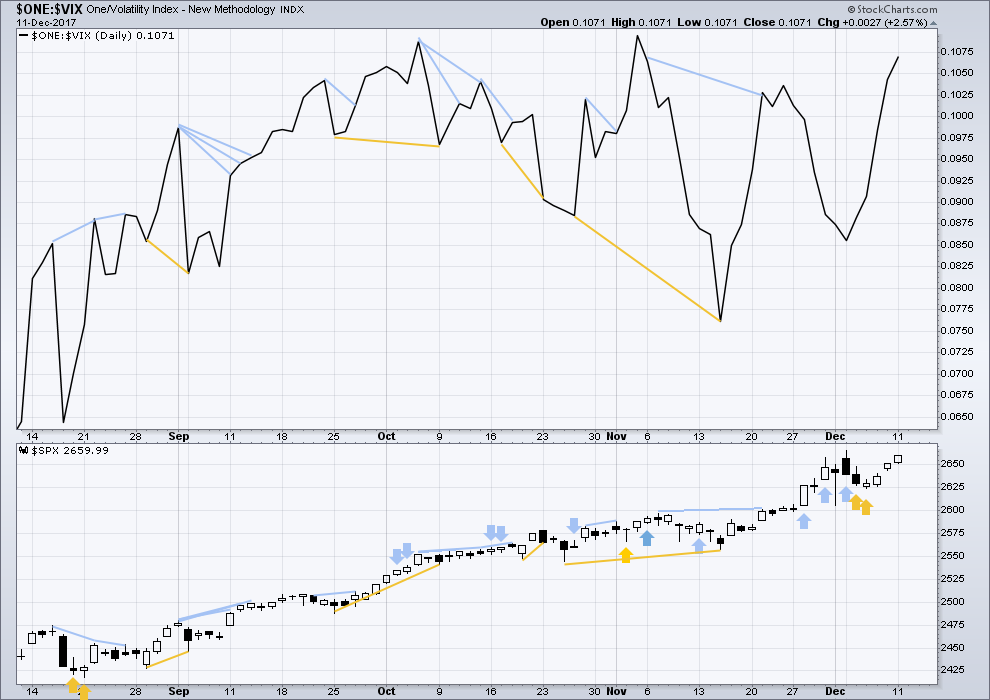
Click chart to enlarge. Chart courtesy of StockCharts.com.
So that colour blind members are included, bearish signals will be noted with blue and bullish signals with yellow.
Normally, volatility should decline as price moves higher and increase as price moves lower. This means that normally inverted VIX should move in the same direction as price.
The rise in price today came with a normal corresponding decline in market volatility.
BREADTH – AD LINE
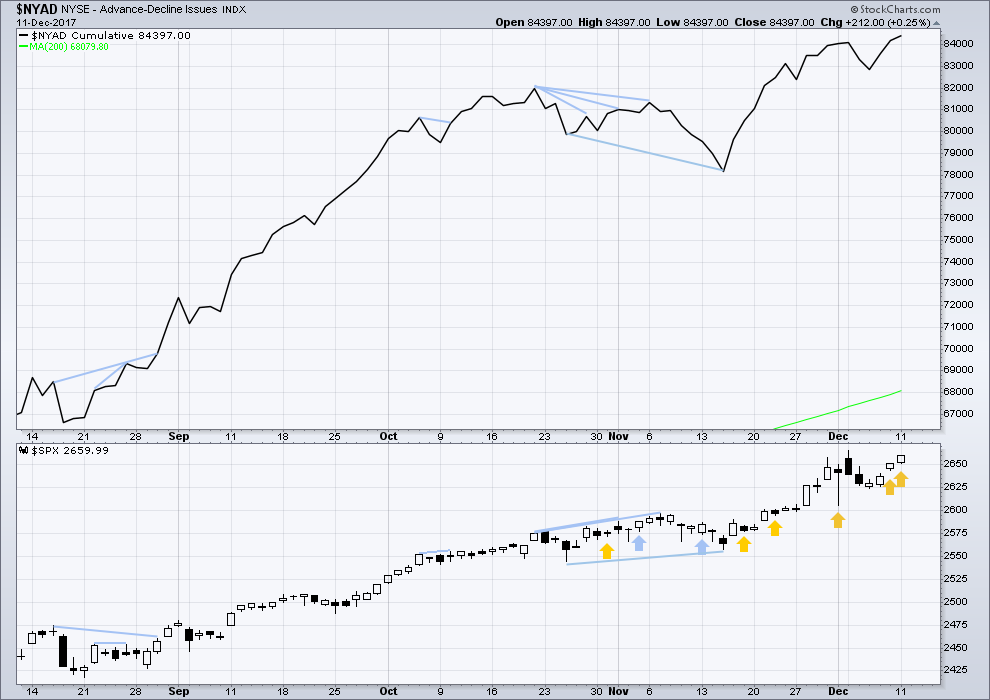
Click chart to enlarge. Chart courtesy of StockCharts.com.
There is normally 4-6 months divergence between price and market breadth prior to a full fledged bear market. This has been so for all major bear markets within the last 90 odd years. With no longer term divergence yet at this point, any decline in price should be expected to be a pullback within an ongoing bull market and not necessarily the start of a bear market.
All of large, mid and small caps last week have made new all time highs. The rise in price has support from market breadth.
Breadth should be read as a leading indicator. The AD line has made new all time highs for the last two sessions now. This may be followed by price shortly to make new all time highs. This bullish signal supports the second alternate Elliott wave count.
DOW THEORY
The DJIA, DJT, and S&P500 have last week made new all time highs. Only Nasdaq was unable to make a new all time high.
The following lows need to be exceeded for Dow Theory to confirm the end of the bull market and a change to a bear market:
DJIA: 17,883.56.
DJT: 7,029.41.
S&P500: 2,083.79.
Nasdaq: 5,034.41.
Charts showing each prior major swing low used for Dow Theory are here.
Published @ 09:46 p.m. EST.
Hi , could minute wave b go to the 1.272 and become a flat for wave 4.
Thanks This is in the spx
Hey Joe, what is the “Old Man” saying about the new ATHs?
I kinda feel badly for them on repeatedly making these really lame calls. I have heard several other analysts make reference to how adamant they have been that a top was in.
Why do they engage in such painful self-flagellation??
I guess they will now switch to the good ole ending diagonal, with nary a word about how WRONG they were….AGAIN! 🙂
Nothing new yet…
Last call 11-30 was that DJIA, DJTA & SPX on throw-overs. Didn’t give upper limit on that… only that it may turn down in another day, week, month. Once below the lows of Thanksgiving week, bull confirmed over.
I think EW rules has a % that a throw-over can travel over the EW drawn trend lines. I don’t remember.
He is not wrong yet according to the way it was worded.
“Further upside follow-through, if any, is likely to be minimal.” so 11-30 was 24,248ish
24,272 was actual close … + 1% = 24,514.72
Minimal may mean 1%ish. 1.50% = 24,636.08
What is beyond minimal in % terms?
ATH’s… call was not dependent on not making a new high.
“This is shaping up as a pinpoint top rather than a spread-out one”
Also, suggest “political uncertainty was about to resolve with respect to the tax-cut bill” (Final Votes next week- agreement on final tonight, maybe). I assume also with this vote tonight that keeps a firmer control of the senate or not. I think RM wins… reps can keep the seat.
“Markets top on good news, not bad news.”
O.K. Thanks! I stand corrected…. 🙂
AFAIK there’s no rule regarding any % above a trend line for a throw over in a diagonal.
The only rules are that the wave lengths must be either contracting (getting smaller) or expanding…
I notice that some diagonal counts sometimes show third waves that are longer in distance (time) but shorter in points so that the trend-lines still converge. Is it correct to assume then that it is the point spread that determines whether a contraction is in play? Seems obvious but I sometimes wonder if the duration also had to be less than the first wave.
Curioser and curioser. The data on those candles for DJI and SPX futures are weird, showing a 0.0 value for opening and low. For NQ the data on the candle is totally bogus for low and close, also with a 0.0 for an open.
What’s up with those funky looking candles on the futures indices of DJI, SPX and NDX?
What time period? Daily, hour?
60, 30, 15 minute all…
What do you see?
For a few… I see an inverse cup and handle??? but not in all or in all 3 periods.
I am seeing some mighty long candles suggesting monstrous downside volume even though they (candles) closed green. I must be getting some crap data….
So you are focusing on the last candle for 1 hr, or all in the last hour for the 30,15 min.
Those candles, the last for each period has the highest volume on the day for each of the time periods.
I do see an inverse cup and handle for a few. But maybe I am seeing things?
Yep. Very strange indeed. Looks like quite a few exits out the back door…..
Oops…Mr VIX seems to be saying to Mr. Market…”Not quite so fast!”
What is interesting is DJI futures also on a tear….yikes!
Wassup with that monster futures DJI candle?
IWM negative and VIX in the green? Unless this thing wakes up I can’t see us heading much further up.
The divergence is indeed notable but could continue a day or two.
I suspect the market makers are going to keep price pinned in a narrow range the rest of the week to ensure options expire worthless or close to it…
Does anyone remember S&P target put out by GS, I seem to recall it was 2,860 or in that neighborhood.
On Bitcoin, Yesterday Morgan Stanley SEC filing revealed that they have an 11% stake in OSTK which they have been accumulating passively. OSTK has gone into crypto currency big time…I was doing some research, it appears MSFT, GOOG and bunch of others biggies have all fingers and toes in the block chain companies but details are limited. I know the amounts are minimal but given the hype, I will not be surprised to see a buyout that sparks the crypo currencies and block chain sectors more.
Well well well. Another brief shallow correction, and another wave that looked so much like a five… turns out must have been a three.
That really does make analysis of this market… let us just say it’s challenging.
Anyhoo… if anyone took the hedging advice you should now have a long position which has a good enough entry point to hold on until the next target is reached… or even longer. The last ATH should now provide support.
Given VIX action, one possibility is we are approaching second wave correction as per second alternate or minute 2 is not over with as per expanded flat option for main count. Looks like imminent pullback either way. Nasdaq is down and Russell off recent ATH.
Everything is priced in already… since election day 2016.
“Bang Zoom” Alice
TICK… TICK… TICK…
2083 low week of election
2668 now
facts still matter, even in Trump-landia.
Yep… The move already occurred on the expectation of the Trump Agenda being implemented.
After all… all he has ever done IS get things successfully done! 40 years of data on that!
Fascinating! Looks like algos recently are impulsively selling off new all time highs and the banksters are stepping in with a vengeance…WOW!!
VIX sending a heads-up. If we remain green into the close we could be close to a reversal…
GLD has hit a 1.27% extension and a symmetric projection (117.5 area). Multiple symmetric projections at 115.5 area as well. I’m suspecting that GLD turns up synchronously with SPX turning down here in a few days. Some institutions at some point this month are going to be taking profits, after all, “it’s when you sell that counts”.
Time for a bounce me-thinks. I exited short positions yesterday but very eager to re-load….
Still discovering nasty surprises in the pockets-es ( sorry Gollum) of the tax bill. These idiots are now going to tax graduate students on waived tuition!
Graduate students are among the poorest creatures walking God’s green earth and I speak from experience. This has to be one of the stupidest, most craven, short-sighted display of outright imbicility that I have ever seen…just what we should expect from the political class…VERY BAD!!! 🙁
We actually calculated that science grad students made LESS than 1.00 per hour back in the day….LONG hours in the lab….
Meanwhile…if you own a jet, under this “tax plan”, you’ll get the US taxpayers to pay for it’s maintenance!!! It’s AWESOME! Oh, and with no doubt whatsoever, the sector that benefits the MOST??? You guessed it!!! Real estate developers!!!! LMFAO here. Estimated benefit to the Trump family of the “tax plan”: $4 BILLION. He got the confidence of what, about 23% of voting age citizens in the US, and he’s leveraging that into billions in personal profits. That should make him the greatest con man in the history of mankind? I think so.
This is what you get when you have to have “Pay For’s” in a Tax Bill. A reduction in spending or a 100% restructuring of all government agency’s should be the ultimate “pay for”.
I assume what you mean by “waived Tuition” is the company you work for is paying the tuition.
Well… that is a benefit you receive tax free now. You should pay the tax on that previously waived income.
Under Grads are the poorest!
The vast majority of graduate students, particularly in hard sciences, receive tuition waivers via teaching assistantships or research assistantships without which they woul be unable to afford a graduate education. To destroy an incentive like this tells me how morally bankrupt these politicians are…
How much money do they earn when on these?
Today with a teaching load of 6 credits around 800.00 on average per month…
Well they are going to have a $12,000 standard deduction and then a 10 or 12% rate up to 45K so even if tuition $57K for the year the max tax to be paid is $5,400
They still come out way ahead of the game… Take a Student Loan to finance the actual tax + interest on financed.
It’s still 1,000 times better than having to pay the full tuition. Very economical.
Good points Joe, I must say. Although I am puzzled why they would go after those pursuing a higher education as it is certain to be a dis-incentive for some of those folk who may now be dissuaded due the additional tax liability. Taxing an activity almost always discourages it, no? 🙂
Personally, I would have preferred that “ALL” deductions for individuals and corporate welfare i.e tax credits of all kinds, etc. etc. interest deductions should be capped and charitable deductions eliminated, would have been done away with. (If you are truly charitable… you don’t need a tax deduction… Shines a light on the Phony Liberals))
Exceptions: Standard deduction at $20K and $40K for joint.
Child Tax Credit to age 21 of $1,500 if in College or age 18 if not!
in exchange for 4 Low Rates.
6% to 100K
15% to 400K
25% to 1 million
32% over 1 million
Corporate Rate 16%
Pass Through Max Rate 25% (15% to 150k 20% to 300K)
Capital Gains Max rate 25% with 3 Year Holding Period
20% with 6 Year Holding Period.
But nobody wants their benefit taken away.
Implement the above program and you get 5%+ Growth
Do a complete restructuring of all government agency’s and deficits disappear in 5 years and debt will start to be paid off in 7 years.
It only works if all the deductions go away. I mean “ALL”!
The only change I would make to that line-up is to be somewhat more generous on the capital gains side. I think it is immoral to tax ANY capital gains made from previously taxed capital, but that’s just me! I don’t think it should exceed 10% in any case. 🙂
“You SHOULD pay the tax??!!!”
Lord have mercy…how the founding fathers would weep at what we the sheeple have become…!!!!
And the were terrified to set a 3% ceiling lest the people thought it would EVER get that high
Most undergrads are still being supported my mommy and daddy. I have two and know what I’m talkin’ ’bout…! 🙂
I have one in, a senior. So I know as well. BTW: I get no real benefit for the support of an undergrad.
Yep, I hear ya. When I came to that section of the return and saw I needed some ridiculous form from the University in order to get any kind of refund I did not think it was worth the hassle…. 🙁
The 1.27 extension of the Dec 4-6 downmove is 2676.1
That’s a key decision point for a turn back down now. After that…the 1.62 extension is up at 2690.2
As I see it, the pricing in of the most massive profit windfall in history for US corporations is still very much in progress.
bitcoins parabolic rise continues today, up yet another 15%. There will only be a total of 21 million bitcoins ever issued (approaching 17 million issued to date), however, they are “infinitely” divisible, so as a currency, I guess that’s more than enough. The underlying question of all of this is “why does any currency have value, and what drives change in a currency’s value?”. The answer is obvious: demand, or lack thereof. And in the case of bitcoin, there are unique FUNCTIONAL values relative to traditional currencies which boost demand vs say, demand for pounds or euros or dollar: one is the fundamentally anonymous nature of bitcoin, allowed anonymous money transfers (a black marketer’s dream). A second is security: if (it’s a big if!) you hold your coin keys securely (off the internet is a pretty good idea!), your money will not be stolen, period. The third is that your money is not under the control and risk of any single institution. The fourth is that bitcoin can increasingly be used directly for the purchase of goods and services…but to do so, you violate the security because your keys will then have to be on a connected device so you can “automatically” if you will execute transactions. Independent of bitcoin proper, the blockchain technology as a means of a public, eternal and secure ledger is extremely disrupting for finance in general.
So sick about hearing about this Fraud in the making!
All day long, every day! I don’t dive a dam!
I have gone back to researching individual stocks. When I make purchases in them, I will post my entry prices. Same when I exit. I intend to have 4 at one time… then rotate in and out. New names introduced at the appropriate times.
I’ve accepted Bitcoin for payment of this analysis for some years now.
The other thing to note about Bitcoin is it’s as classic a bubble as there ever was.
I’m now reading about people mortgaging their houses to buy Bitcoin. Insanity.
When this bubble bursts there will be a lot of unhappy folks. And it’s only their greed that’s getting them into this situation.
I’m planning on shorting it after the bubble pops. That’s going to be very hard, but possible. We’ve opened a BitStamp account to do this.
Yes, it is Insanity!
Many people are going to be badly hurt getting into the Bitcoin craze! The more it’s talked about… & it’s “endlessly”… the more people are going to hurt!
That is my only point!
Now that futures are available, I am opting for options on futures out quite a ways to give the bubble ample time to fatten, ripen, baloon, expand, burgeon…well, you get the idea! 🙂 🙂 🙂
Verne,
I have asked my broker but they don’t allow futures in bitcoin but there is an ETF that is running rampant with significant swings. You mind sharing who is offering futures trading on bitcoin.
The CBOE opened a bitcoin futures market as of the start of this week (over the weekend). I do not believe there are option products for it yet, but I imagine that will come in short order, if/as volume swells in general.
Yep! Options are next on the agenda. 🙂
They are crunching the chain data as we speak.
Initial offerings will probably be limited but you don’t need a lot of variety, really; Just the right strike price and enough time out to make a trade worthwhile….
I heard that options are not available on Bit futures. I could be wrong but that is what I heard.
On the futures, some firms require 50% margin.
I would suggest anyone interested in bitcoin (more importantly blockchain) to watch this video
https://www.youtube.com/watch?v=GtKhYx2Vlb4
Whether we like it or not days of paper currency are limited and more importantly, banks are in a real bind…I see crypto currencies coming into play over the next decade and frankly banks are scared of these developments. I like the idea of blockchain for the various applications it can have..bitcoin or someother will come to become the leader …remember netscape as leader in internet but now internet lives well despite the demise of netscape..AOL…
List of currencies that have come and gone so far
https://en.wikipedia.org/wiki/List_of_historical_currencies
Still early in watching that video and it is excellent!
But when the speaker briefly mentioned the terror that bitcoin puts in the heart of traditional financial institutions, I had the conspiratorial thought, probably due to more than a few “market manipulation” theorists here. What if the irrational bitcoin bubble underway is being driven, intentionally, by those same institutions, with an intention of driving it to a collapse, taking a boatload of profit along the way, but more importantly than that, with an intention of discrediting it? (Everything is explainable with a conspiracy theory, lol!!!) Or maybe we even have to say “of course and by definition, that’s a major part of what’s happening”. I don’t know!
Kevin,
I am not at all thinking that Bitcoin bubble is not being fed by some insiders trying to game the crypto markets. They did the same for internet bubble…now they have found something that can be equated to internet, they will milk it to the hilt. I am kicking myself to the day for some early internet trades that I panicked to close too soon for example had bought AMZN on the IPO day but sold for a $10 profit thinking it will never work out.
This time around I will be patient as these opportunities don’t come along very often. Like Lara said, shorting will be good but only when you know for sure that it is headed down in a hurry. I guarantee that if one of BIG tech companies comes out and states they have started block chain…watch the sector going nuts…
Not sure what you mean that; IBM runs its own public block chain, open to all for use and innovation, for example. You probably mean big financial institutions start using the technology in a significant manner; some comments on the challenge there below. As for the collapse of the bubble, that’s coming too…but bitcoin will survive that and roll right onward. After all, it’s only going to be on the order of, oh, $150-200 billion in theoretical value “lost” when the bubble collapses. Then a new 5 wave will start.
This video btw doesn’t explain anything about the underlying technology, but it does a good job of fleshing out the broader disruptive values (transnational/borderless, open to all, censorship resistant, extraordinarily secure, etc.).
Christensen’s “Innovator’s Dilemma” books are exceptional re: this type of technology that introduces brand new values into an existing business ecosystem, usually with a far lower cost point (yes, and yes for BC). Over time, such a disruptive technology “takes over” by slowly acruing more and more of the traditional values of the incumbents, thereby displacing them. The incumbents, meanwhile, cannot invest in the new disruptive technology, because their customer base constantly demands incremental value improvements in the traditional technology. Thus, the dilemma for the established financial institutions. There’s the additional challenge with BC that their traditional revenue generation models don’t fit so well with it. Interesting times!!!
Kevin,
I am reading a lot on crypto and block chain these days as I want to be able to understand and apply the same as opportunities will be fantastic.
Go for it! “Open for innovation”. I have a friend who launched a VC backed company doing internet of things security utilizing the IBM blockchain. There will be endless opportunities. I have a patent very near completion that doesn’t use the blockchain per se…but leverages some key technologies and values used in bitcoin into the general personal communications space. Better would be to get some $$$ for development and deploy…but that’s a lot more work, lol!!!
“Bang Zoom” Alice
TICK… TICK… TICK…
“Bang Zoom” Alice
TICK… TICK… TICK…
I think the DJIA is going to lead the way from here.
I did not go long as planned. Seeing some red flags…
I am (again) blown away by the pricing behavior of VXX and XIV vs. the VIX. The VIX yesterday was virtually flat; in fact it perhaps very slighly rose. VXX went from 30.2 or so to 29.9, while XIV went from 123 area to 128. Some combination of the futures market saying “SPX price going up in the future!” and contango and inverse contango driven price change. Wowza. I was thinking a few weeks ago when XIV was bumping around 115 that 135 was in it’s future. Forget about that. Given that the market isn’t close to a grand super cycle top yet, I think we’ll see XIV over 200 within the next 2 years, and maybe even in 2018.
Now that the stock market is going to the moon so are some ‘lucky’ US astronauts. Mars is next I understand.
This is pretty much just a wild guess on my part, but if there is a significant downward wave to come, the Alabama election could be a catalyst. An upset could trigger a selloff if it casts doubt on the GOP’s control of Congress. I think there will be a lot of uncertainty going into Midterms and this would only accelerate it.
I don’t disagree with an iota of Lara’s analysis. Yet when I look at the daily chart…boy do I see a “high thrust period” in progress! 3 white candles, almost “all body”, and no overlap (even gaps). Wow. I look for analogous situations in the recent past: on the chart above I note late Aug, and again late Sept. One hit a very minor 2-3 days of some churn, then off to the bull races, the other…immediately off to the bull races! From what I can see, the strong price action indicates more bullish action coming right at us. There…that should assure that a real correction starts right away!
I’m right there with you. This market has resisted downward waves time and time again. The one thing that gives me pause is that RUT has failed to make a new ATH and has posted some rather bearish candlesticks in the last two weeks. That’s nothing like the rebound we saw after the August mini-crash, where RUT went up in concert with DJIA and SPX. Overseas markets are also taking much more of a step back than we have seen for SPX so far. I will wait to see how the markets react to the Fed before making move.
I agree. I am opening a few long trades today. I will scale out of them as we go higher and hold some of them until we take out 2640. I think we are going to see a final “melt-up” ahead of a more significant top. Very typical. We have had Santa Claus Rallies each of the last eight years. The reaction to a possible interest rate hike should be interesting. I think we are going to see some serious additional pumping to assure the crowd…”Nothing to see here!”, but rising interest rates are ultimately going to have a significant impact on the price of equities…
Right on time to make first mine, all mine!
“Drop of wine, a glass of beer dear what’s the time?
The grime on the Tyne is mine all mine all mine
Five past nine.”
From “Blood on the Rooftops”
you got it Rodney,,what happened to our Seahawks?
They got beat up, frustrated, and acted poorly. They were outplayed and outcoached on both sides of the ball. Next week the Rams. It is do or die time.