
The second target at 2,634, calculated using the measured rule, has been met today.
The Elliott wave structure is analysed to see if it may be complete. If it is, then price may turn here. If it is not, then the next target will be used.
Summary: The next Elliott wave target is 2,773. While price remains above 2,606.41 and within the yellow best fit channel on the hourly chart, then assume the upwards trend remains intact.
The structure is incomplete at this stage, but some indicators are extreme and some weakness is beginning.
Always trade with stops and invest only 1-5% of equity on any one trade. All trades should stick with the trend. The trend remains up.
Last monthly and weekly charts are here. Last historic analysis video is here.
The biggest picture, Grand Super Cycle analysis, is here.
MAIN ELLIOTT WAVE COUNT
WEEKLY CHART
Click chart to enlarge.
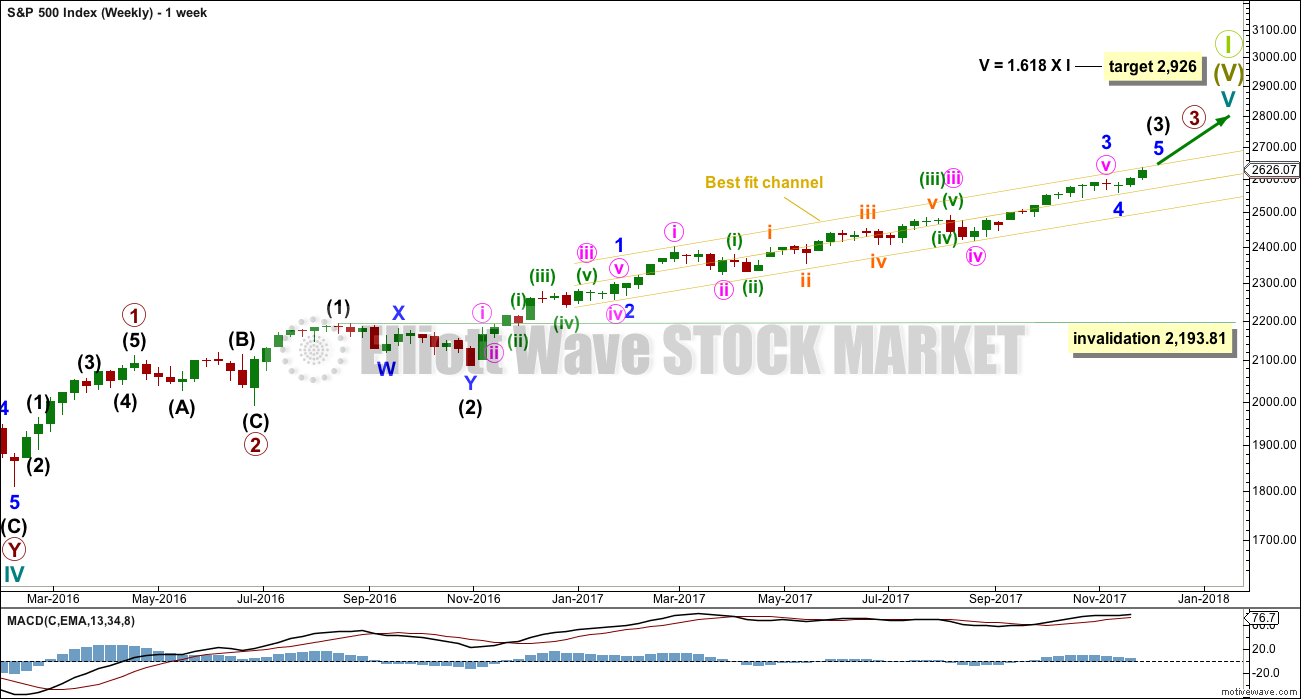
Cycle wave V must complete as a five structure, which should look clear at the weekly chart level. It may only be an impulse or ending diagonal. At this stage, it is clear it is an impulse.
Within cycle wave V, the corrections for primary wave 2 and intermediate wave (2) both show up clearly, both lasting several weeks. The respective corrections for intermediate wave (4) and primary wave 4 should also last several weeks, so that they show up at weekly and monthly time frames. The right proportions between second and fourth wave corrections give a wave count the right look.
Cycle wave V has passed equality in length with cycle wave I, which would be the most common Fibonacci ratio for it to have exhibited. The next most common Fibonacci ratio would be 1.618 the length of cycle wave I.
Intermediate wave (3) may now be nearing completion. When it is complete, then intermediate wave (4) should unfold and be proportional to intermediate wave (2). Intermediate wave (4) may be very likely to break out of the yellow best fit channel that contains intermediate wave (3). Intermediate wave (4) may not move into intermediate wave (1) price territory below 2,193.81.
DAILY CHART
Click chart to enlarge.
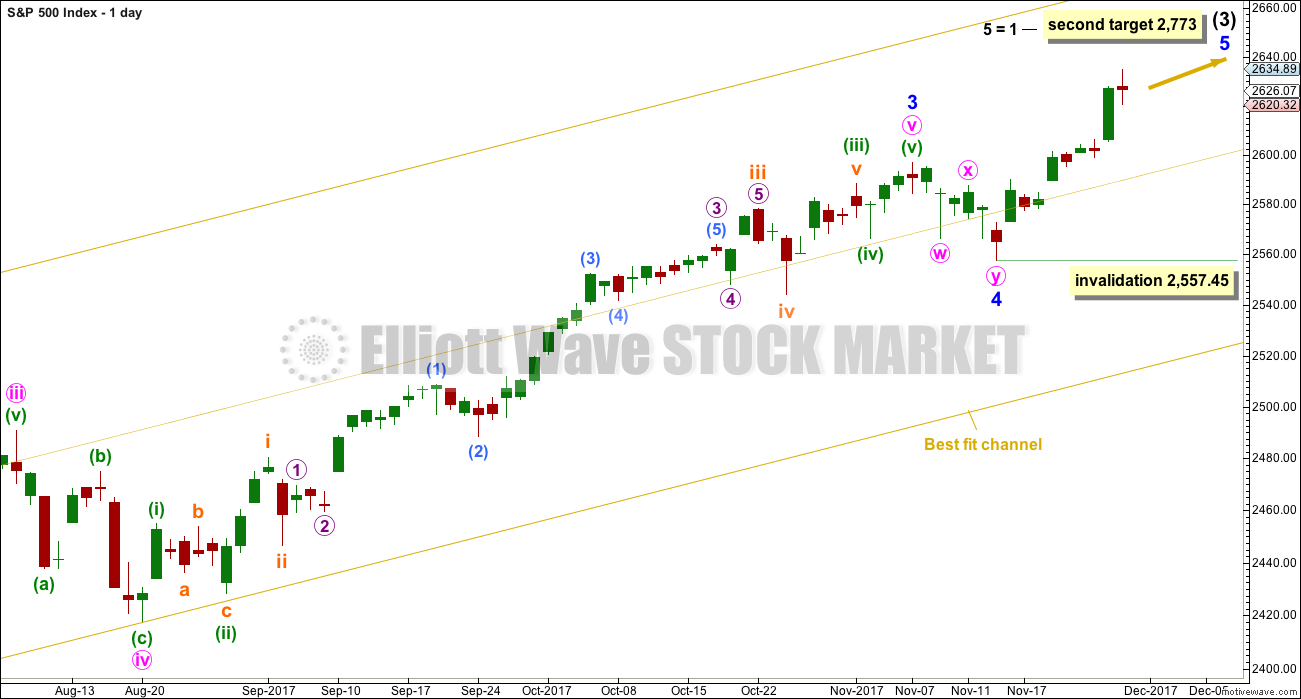
Minor wave 4 may now be complete. It will subdivide very well as a double zigzag. This provides only a little alternation in structure with the single zigzag of minor wave 2. There is also poor alternation in depth: minor wave 2 was very shallow at only 0.16 of minor wave 1, and minor wave 4 would be only 0.12 of minor wave 3. Alternation is a guideline and not a rule; it is seen more often than not, but not always.
The target at 2,634, calculated using the measured rule, has now been reached. The structure of minor wave 5 on the hourly chart looks incomplete. The second Elliott wave target should now be used.
The second target calculated for minor wave 5 expects it to exhibit the most common Fibonacci ratio for a fifth wave. This target would not expect a Fibonacci ratio for intermediate wave (3) to intermediate wave (1).
Within minor wave 5, no second wave correction may move beyond the start of its first wave below 2,557.45.
HOURLY CHART
Click chart to enlarge.
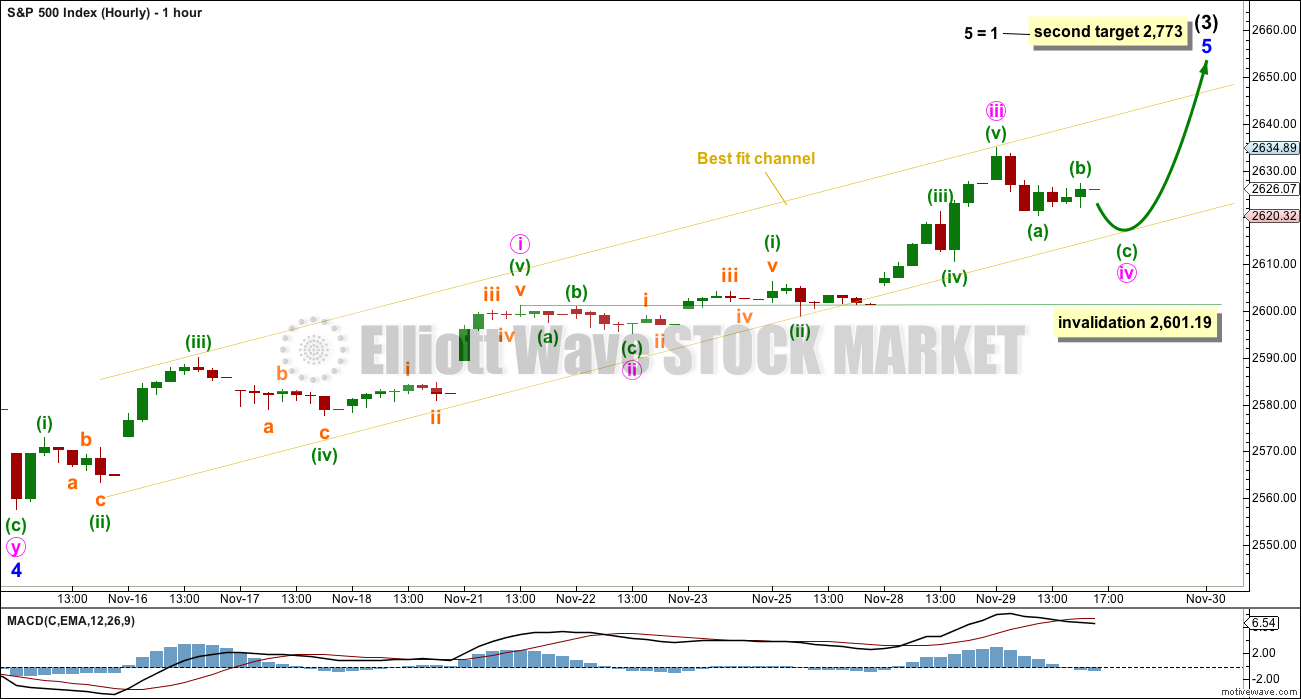
This chart uses BarChart data (only the last one or two hourly bars are missing). The low for the session is accurate.
If minute wave iii is over at the high for today, then it would be shorter than minute wave i. The target at 2,773 would be too high. When minute wave iv may be complete, then a target may be calculated at minute degree for minute wave v, which would be lower than 2,773.
Minute wave iii so far shows strongest momentum. Minute wave iv may not move into minute wave i price territory below 2,601.19.
Minute wave iv may find support about the lower edge of the yellow best fit channel.
ALTERNATE HOURLY CHART
Click chart to enlarge.
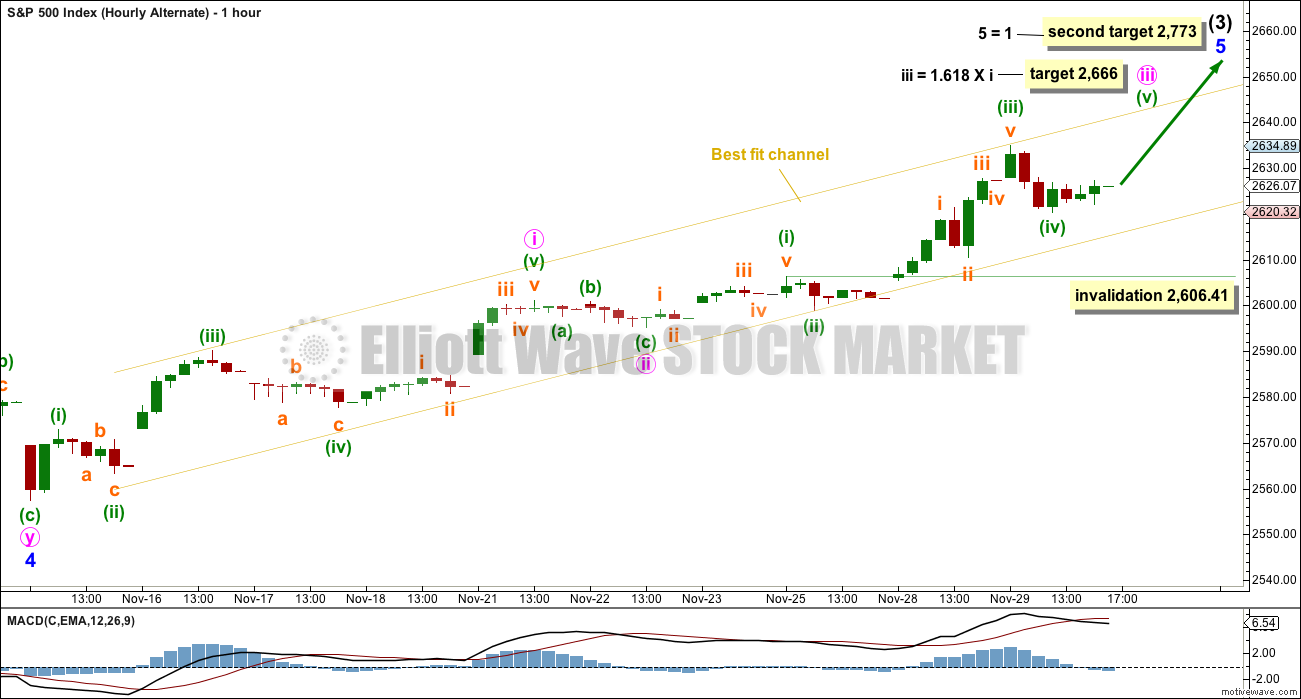
It is also possible that minute wave iii may not be over and that upwards movement will continue to be strong for another day or so towards the target at 2,666.
Minuette wave (iv) may have been over at today’s low. If it continues any further, then it may not move into minuette wave (i) price territory below 2,606.41.
It would be my judgement that this alternate hourly chart is about even in probability with the first hourly chart.
TECHNICAL ANALYSIS
WEEKLY CHART
Click chart to enlarge. Chart courtesy of StockCharts.com.
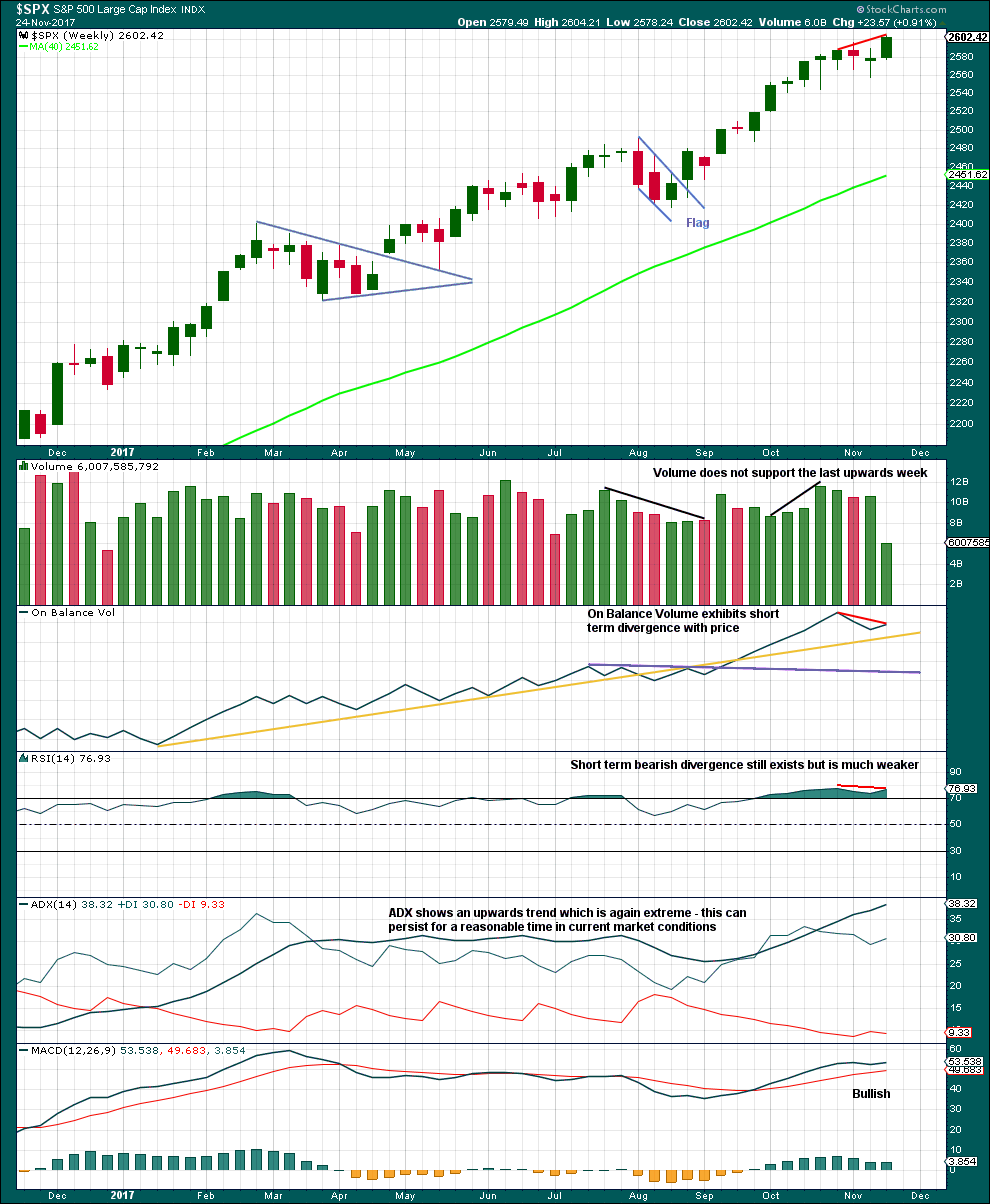
Lighter volume for a week with a US holiday in it would be expected. On its own, this lighter volume should not be taken as a signal that a high is in place.
Some weakness and overbought indicators should be expected as intermediate wave (3) comes to an end.
DAILY CHART
Click chart to enlarge. Chart courtesy of StockCharts.com.
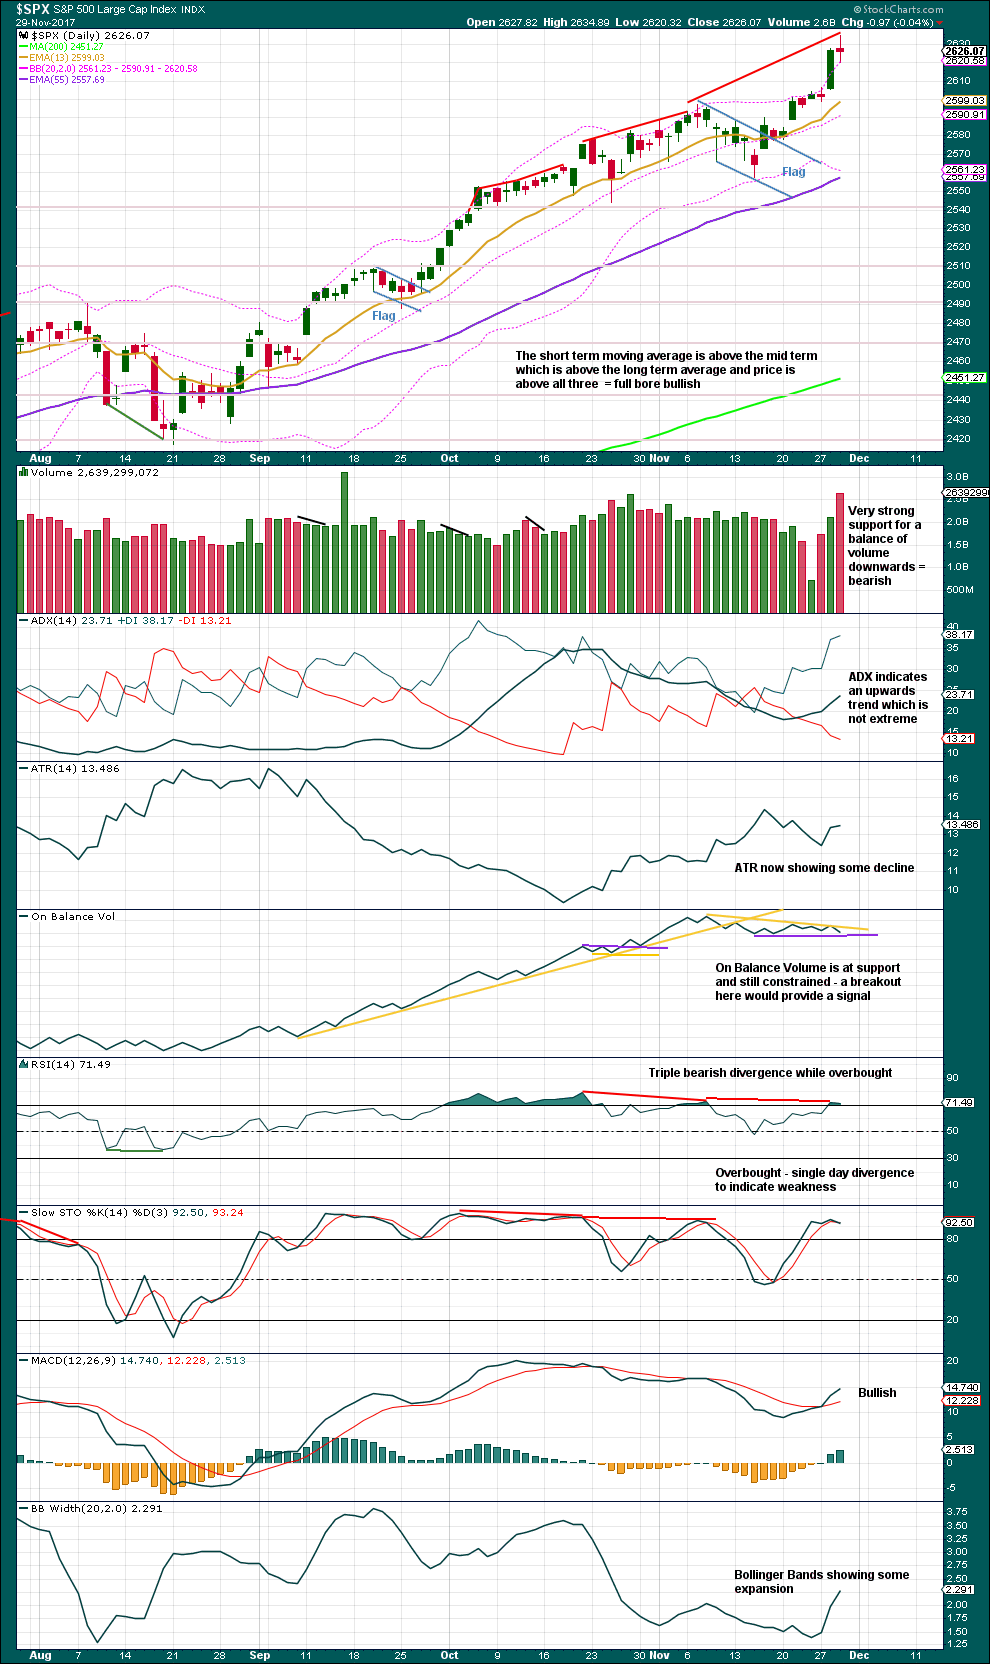
The target using the measured rule for the flag pattern is at 2,634. This is now met. If tomorrow completes a downwards day, then it may complete an Evening Doji Star reversal pattern. That would be a strong indication of a high in place, but this pattern is not yet present and no reversal signal is yet shown.
RSI and Stochastics are extreme and exhibit divergence, which indicates weakness in price now. Volume today is bearish.
It is possible that a high is in place here, but that is not yet confirmed.
VOLATILITY – INVERTED VIX CHART
Click chart to enlarge. Chart courtesy of StockCharts.com.
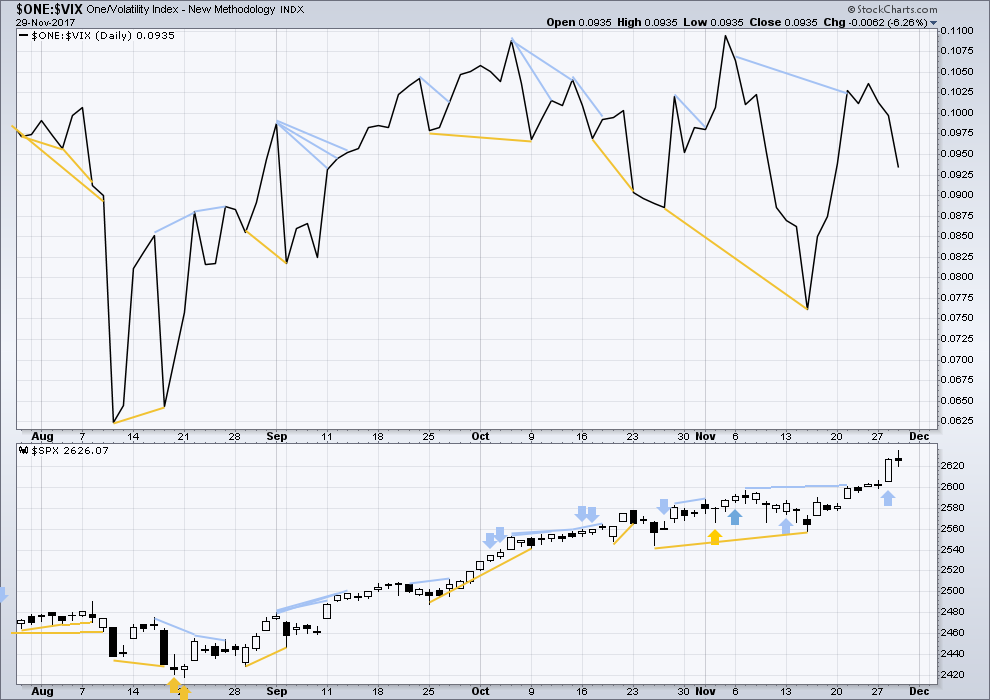
So that colour blind members are included, bearish signals will be noted with blue and bullish signals with yellow.
Normally, volatility should decline as price moves higher and increase as price moves lower. This means that normally inverted VIX should move in the same direction as price.
Regular bearish divergence noted yesterday between price and VIX has not been followed by downwards movement yet, although the balance of volume today was down. It may yet be followed by some downwards movement tomorrow.
BREADTH – AD LINE
Click chart to enlarge. Chart courtesy of StockCharts.com.
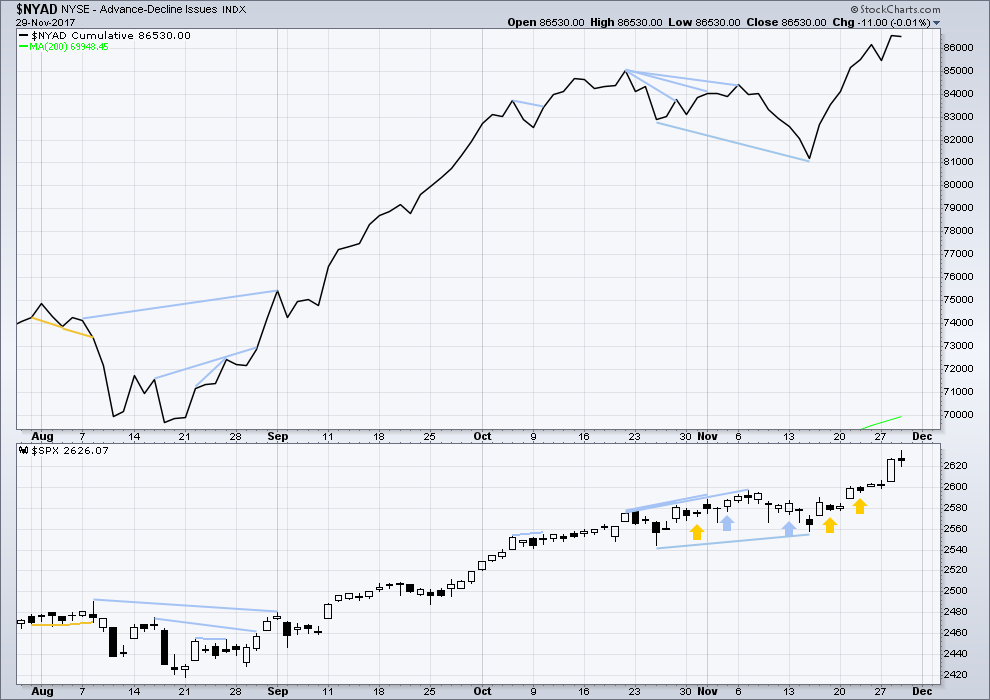
There is normally 4-6 months divergence between price and market breadth prior to a full fledged bear market. This has been so for all major bear markets within the last 90 odd years. With no longer term divergence yet at this point, any decline in price should be expected to be a pullback within an ongoing bull market and not necessarily the start of a bear market.
All of large, mid and small caps last week have made new all time highs. The rise in price has support from market breadth.
Price moved higher today, but the balance of volume was down and the candlestick closed red. Downwards movement during the session has come with a normal corresponding decline in market breadth. This is slightly bearish.
DOW THEORY
Only DJT has not made a new all time high last week. The S&P500, DJIA and Nasdaq all this week made new all time highs.
Failure to confirm an ongoing bull market should absolutely not be read as the end of a bull market. For that, Dow Theory would have to confirm new lows.
The following lows need to be exceeded for Dow Theory to confirm the end of the bull market and a change to a bear market:
DJIA: 17,883.56.
DJT: 7,029.41.
S&P500: 2,083.79.
Nasdaq: 5,034.41.
Charts showing each prior major swing low used for Dow Theory are here.
Published @ 10:10 p.m. EST.
Updated hourly chart:
This is the alternate in the analysis above, and now will be the main count because momentum has increased. This looks like a third wave.
Any chance minute three not yet done and we could see a break above the channel tomorrow?
I was wondering if a final fifth wave was needed to end minute 3 as well.
With the sharp pullback for Friday that doesn’t work now. It has overlapped back into minuette (i) price territory, telling us that minute iii should now be over.
I continue to be fascinated by the VIX price action. A rising VIX will necessarily require reassessment of VAR for trading desks that are long this market. That is what makes this run-up today so intriguing. While VIX did not reach that critical 15.00 threshold the quants think will force a start of unwinding, it does seem to be now in an upward trend and so it is only a matter of time.
A little more down before close and SPX is going to print a hell of a shooting star on the daily!!
From what I recall, VIX divergence close to an interim top is not at all unusual but the signal generally occurs VERY close to the turn and often gets an intra-day confirmation. I cannot ever recall seeing DJI up hundreds of points with a VIX print solidly in the green. I am going to have to do a little digging on what the quant guys thing might be going on here…really interesting!
Here is another possibility. The higher move in VIX could also be the result of the market being moved higher on highly leveraged trades, which are in turn being back-stopped with a long vol insurance trade…just a wild guess…the low volume is suspicious…
If VIX goes back over 11.11 today, I think it spikes and then continues much higher over next week or so.
That is how I am reading the action now.
Any thoughts from the VIX pros?
VIX 11.13 now… back over 11.11
VIX 11.21 now
VIX 11.35 now +65
IBB is showing signs of a major new upswing. Go biotech. Yes, I admit, I’m long and have taken the heat, but it’s coming off now, with the rate increasing day by day!
If VIX is behaving like this during a parabolic rise in the indices, what the hell is going to happen when they retrace??!
Is what is going on now a cover for the unwinding of the massive short vol trade on the sly???!!!! This is NUTS! (but fun! ) 🙂
So now what?
Verne, does the VIX continue to move higher over the next two weeks?
Or was that it?
Today looks to be a classic throw over… maybe old buddy is spot on?
Any other way to explain vix spike.
This is really uncharted territory for me Joe. I have never ever seen anything quite like it. I am just continuing to scalp the short term moves until we get a reclaim of the 200 dsma. This is clearly the middle of some kind of third wave and how close we are to a top of that move is anybody’s guess. I am quite confident that DJI will not remain above its upper B band for long. The question is how big is the move back down going to be. That I think will determine what VIX does. Of course in this upside down world, who knows if we will not now see VIX plunge as well, as prices move down. This is all very strange indeed!
It is absolutely part of that unwinding, kind of by definition. I suspect over the next 6 months we’ll see a lot more of this, as things adjust back to a more normal state, with much higher volatility in the market due to the increasing size (time and price) of the 4’s the market is going to be moving through. It’s gonna be different from the last 18 months+ (the heavy “3 of 3” period). Some folks will have trouble adjusting. It requires some consideration and planning (“face the future, don’t walk backward into it and let it break over your head!”), I think.
While a 4 of some form is surely coming soon (oops, SPX bouncing now off the 2658 level fibos), I note that financials and transports have just STARTED what appears to be a very significant break to the upside after being rather depressed. Many other sectors very hot today. To me, this is not even remotely a sign of some kind of impending market fall of significance. This is strong signals from multiple quarters that this bull market has serious legs. IMO. And it should, given the spending and investing of an additional 1.5 trillion by the the extremely rich and the already extremely profitable large corps. It’s a corporate/finance party paid for by the middle class and poor where the booze is just getting poured.
Totally agree, I see a short Sharp Correction in January and then a final parabolic leg up. The Bulls are running on full steam and no point standing in their way
Hope everyone is well on the site 🙂
Why not December? Are you telling me nobody wants to lock in gains of this magnitude for their year end bonus… payable in January?
Maybe December, no crystal ball!!
Maybe the old rule that a negative January will play through the year, though a lot of these old seasonal trades seem to have gone out the window in this bull run
Have targets and stops are in place thats the best I can do 🙂
Are there any members on the site who have been here longer than me?
If so, has anyone ever seen anything like what VIX is doing today?
Older traders who are new members also would be great hearing from…
The move in the last ten minutes is mildly blowing my mind….
Parabolic!
There are a very few here longer than you. But not many, I’d say less than 10 now.
I do not ever remember closing out a long short term vol trade for well over a double and at the same time being in a position to short a market at all time highs!!
Brave new world!!!
BTW, when you look at the volume with which this kind of price movement is taking place, does anyone STILL doubt the ability of central banks to manipulate short term prices??! hmmnnn…!
Worth noting that in the last few days TBT has initiated a move up (i.e., rising rates on 20 year bonds). I’m still slightly underwater, but I view that as a longer term play.
Hey Chris, my mid term and short term vol trades are really exploding while we are putting in relentless new all time highs. I have seen vol divergence before but never anything quite like this. What’s up with that??!! 🙂
I am in Vol trade… so at the moment I am on the right side.
Would like VOL viewpoints, based on current action. 200 DMA is at 11.11… made 1st real push above today. Plus any targets for VIX for this move for next week or two.
About to short $DJI today when I figure out what is going on.
Something is going to snap… I can feel it.
With a bit of luck, we should see a very clear reversal signal so it may be worth waiting. I am in a bit early but comfortable being under water for a bit in the event it goes on a bit longer. I think the initial move down is going to be ugly. If it come via futures option premiums will be quickly sporting ludicrous and untenable spreads.
Done… st DOW
From here Joe, I’m holding until I’m right. Disclaimer….NOT INVESTMENT ADVICE!!!!
Covered
You know the answer to that Verne……
He! He! 🙂
The divergence started Nov 21, as the market took off from the last significant 4, and has continued now for about a week. I would suggest it’s the early stages of the VIX getting “back to normal”, anticipating some more significant corrective action upcoming. And we all know that IS coming, in the form of an intermediate 4, followed by a minor 4, etc. So the pattern we’ve had of a close 1-1 matching of SPX up / VIX down is changing due to the short and mid-term expectations of changes in the overall market dynamics. IMO.
VIX 200 day MA is at…
11.11 today. VIX now at 10.99
Boy… something is about to snap! You can just feel it!
I just hope I am on the right side of the snap!
SPX just tagged the 1.618% extension of yesterdays high->low. A key decision point.
That one sure didn’t last long! Looking at the SPX chart, the momentum just keeps getting stronger. Tax plan priced in fully? Nyet. Article today in Newsweek about the transfer of about $140 Billion expected from the US citizenry to foreign investors via tax theft plan (given foreign investors hold trillions in US stocks, and US stocks will have much, much higher earnings, etc.) I am so utterly stunned by the breadth and depth of this rip off by the kleptocracy (I significantly include Dems under that broad umbrella), it is surreal to watch it happening. The American people are pwned, seriously pwned by the oligarchy take over of US politics. This level of corruption is what sank Rome too, isn’t it??
Oops, I misquoted. The transfer of wealth to offshore investors off the backs of the common US citizen is estimated at $520 BILLION over the next decade. Thank you Republicans, May We Have Another??? Oh yes, I’m sure they’ve got more in store for their “constituents”, lol!!
That wealth transfer took place over the last 17 years… trillions from the middle class in USA to elsewhere in the world.
Now… it will be replenished to the middle class in the USA over the next 5-10- 15 years.
Yea, I’m sure those $100 tax cuts on the middle class will really add up. Meanwhile…lol!!! $180 BILLION a year in unpaid taxes due for the hedge fund managers ALONE due to the carried interest loophole, and that’s just the tip of the iceberg. 80% of this BORROWED $1.5 TRILLION goes quickly to the extremely wealthy and already extremely profitable corporations. It’s class warfare, top down style!!! But hey, nothing but theft to see here, but hey look over there, Donald Trump is acting like an utter ass and buffoon again!!! He is the master, extremely capable at the art of diverting attention from the con, and his manic approach to it now is highly indicative of the the ultimate heist very much in progress. They’ve opened the bank vault now…
Stopped and turned at precisely the 1.764% extension instead of the 1.618. Fractal market geometry always present!!
Moving higher again! Next target 2649.5, then 2658.5-2659.5, all fibo extensions of immediately prior down moves. The latter is a cluster of two different extensions which increases potential for a turn decision.
Don’t forget the crackle and the pop!
But seriously, what DJI is doing suggests the first move down is going to go straight for the lower B band, kinda like what Nasdaq did. A lot of these recent gains are going to be incinerated, and quickly…yikes!
JO (coffee ETF) is giving signs of an uptrend initiating. TWLO looks good to me right now too.
The coming cooling cycle is going to see food prices skyrocket. Agriculture should be a part of every long term account.
This is way too funny. Why is VIX giving all the new all time highs the proverbial finger?! lol! 🙂
Yea, we are seeing a fair amount of VIX and related instruments diverge here over the last few days. “Sell the news” caution on the part of the option traders I guess.
BTW RUT traders, I’ve got a 1.27% extension of the massive Aug low to early Oct high at about 1559, and that’s a key decision point for a turn for every pullback -> push up to new highs. When RUT gets there and if it then signals a turn, I may be taking profits here and there, myself.
To much divergence for me, with another spike up in play in SPX, INDU and RUT. Bgt some XIV at its nicely depressed (me believes) price…
Gap & then down feels about _ _ _ _ _ ! imho
Tax Reform… Buy the rumor, sell the news.
Rumor started the day after election day 2016. News is this week and it will certainly pass… NO doubt in my mind. Anyone that is saying Tax Reform not priced in is on something and delusional.
Buy the rumor, sell the news. At least that is what should happen in a true price discovery world.
Is that right? VIX spiked to 11.62 for 1 min at 9:42 AM???
Anyone else see this on your chart???
VIX tail created by that spike for 1 min is a false flag.
A desperate attempt to smack down vol.
I think it fails!
There was a smack down to 8.56 a few days ago and that also was smartly rejected. Some short seller had his head summarily handed to him… 🙂
Uh Huh! Some serious accumulation going on. Could also be a huge short exited, or a massive market price order. Either way, somebody thinks something big is on the horizon…. 🙂
The state of the minds of Big Money might be just a tad more cautious than you Joseph, leaving the potential for more buying of the rumor as the closure gets closer and closer. That said, yes, a careful eye and protective stops not a bad idea!! And of course, intermediate 4 is somewhere up ahead, and it’s always possible it’s starting sooner rather than later. I cast my net wide yesterday, about 1/2 my fish are stopping out BE, took profits on a few quickly and the others…moving on up!
ps: INCY is giving a pretty strong trend change signal IMO (back to up) today, and coupled with a strong push by IBB, I like it.
Not that I know what I’m doing, but I’m exiting all longs and going full short right here, right now. Verne, back up to 100% position size on VIX.
Interesting. The way I see it, the momentum here reasonably strongly supports price still being in the 3 phase of the minor 5 up, per the alternate hourly. A minute 4 could kick in any moment. But the preponderance of the evidence I see indicates there’s another push up (a minute 5) after that of significance before the intermediate 4 kicks in.
I chuckle over our microscopic version of a market right here: you guys (Chris/Verne) always waiting for another buy opp on long volatility instruments when the VIX dips low…me, always waiting for another buy opp on short volatility instruments (mostly XIV) when the VIX rises up! Lol!! Both ways work when it’s oscillating like a ringing bell. I’d play your side too but I refuse in general to get involved with a degrading instruments like VXX/UVXY. Options…I never seem to make any money, probably because of a combo of impatience and lack of knowledge, so I mostly stay away. That leaves me sticking with short volatility which as I see it is trading with the trend, and with XIV I get the boost of the inverse contango lift, so I like it.
Yeah Kevin, I stick with the VIX futures and Options mostly
Hey dude, so long as we make moolah who cares which way it swings! lol! 🙂
My point exactly. Many paths to success in the financial markets. Kind of like that old joke I can’t say here about where to find the liquor and the poker, thus satisfying the desires of all parties!
I was foolishly looking for another smack down below 10.00 yesterday that never happened! Rats! 🙂
Let’s get this party started!
Jumped all over it within 30 seconds of open.
It is still difficult for me to fathom 2773. But that is now the target I guess.
I suppose we could still be in (b) of minute iv. With (c) down to come.
One drink oh wine, one drink oh gin…!!!???
LOL
Here I am entertaining my sister and three young nieces today…. a glass of wine is necessary 🙂