
Upwards movement continues as was expected from the main Elliott wave count. The targets remain the same.
An alternate wave count is considered, but classic technical analysis indicates it has a lower probability.
Summary: The first Elliott wave target is again at 2,614. A target using the measured rule is 2,634. The second Elliott wave target is 2,773. As price approaches each target, if the structure is incomplete and there is no weakness in price, then the next target will be used. But if price approaches a target and the structure is complete and there is some classic weakness, then a high may be in place.
The structure is incomplete at this stage, but some indicators are extreme and some weakness is beginning.
Always trade with stops and invest only 1-5% of equity on any one trade. All trades should stick with the trend. The trend remains up.
Last monthly and weekly charts are here. Last historic analysis video is here.
The biggest picture, Grand Super Cycle analysis, is here.
MAIN ELLIOTT WAVE COUNT
WEEKLY CHART
Click chart to enlarge.
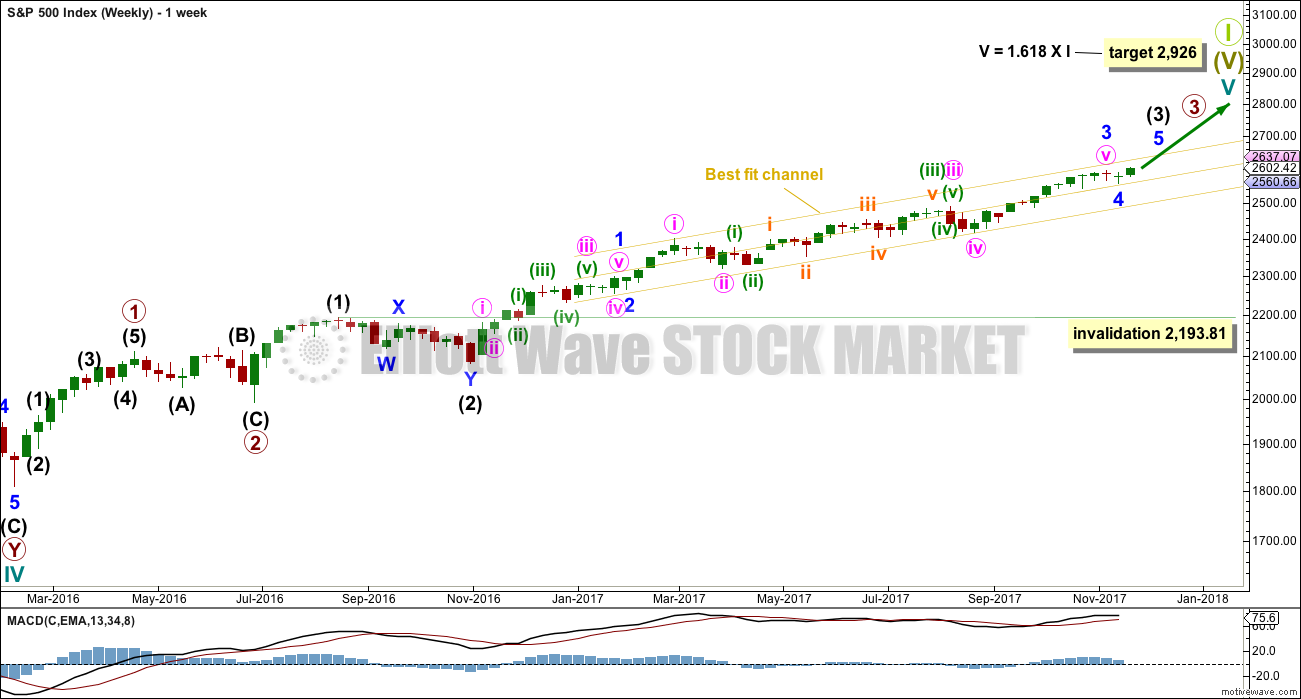
Cycle wave V must complete as a five structure, which should look clear at the weekly chart level. It may only be an impulse or ending diagonal. At this stage, it is clear it is an impulse.
Within cycle wave V, the corrections for primary wave 2 and intermediate wave (2) both show up clearly, both lasting several weeks. The respective corrections for intermediate wave (4) and primary wave 4 should also last several weeks, so that they show up at weekly and monthly time frames. The right proportions between second and fourth wave corrections give a wave count the right look.
Cycle wave V has passed equality in length with cycle wave I, which would be the most common Fibonacci ratio for it to have exhibited. The next most common Fibonacci ratio would be 1.618 the length of cycle wave I.
Intermediate wave (3) may now be nearing completion. When it is complete, then intermediate wave (4) should unfold and be proportional to intermediate wave (2). Intermediate wave (4) may be very likely to break out of the yellow best fit channel that contains intermediate wave (3). Intermediate wave (4) may not move into intermediate wave (1) price territory below 2,193.81.
DAILY CHART
Click chart to enlarge.
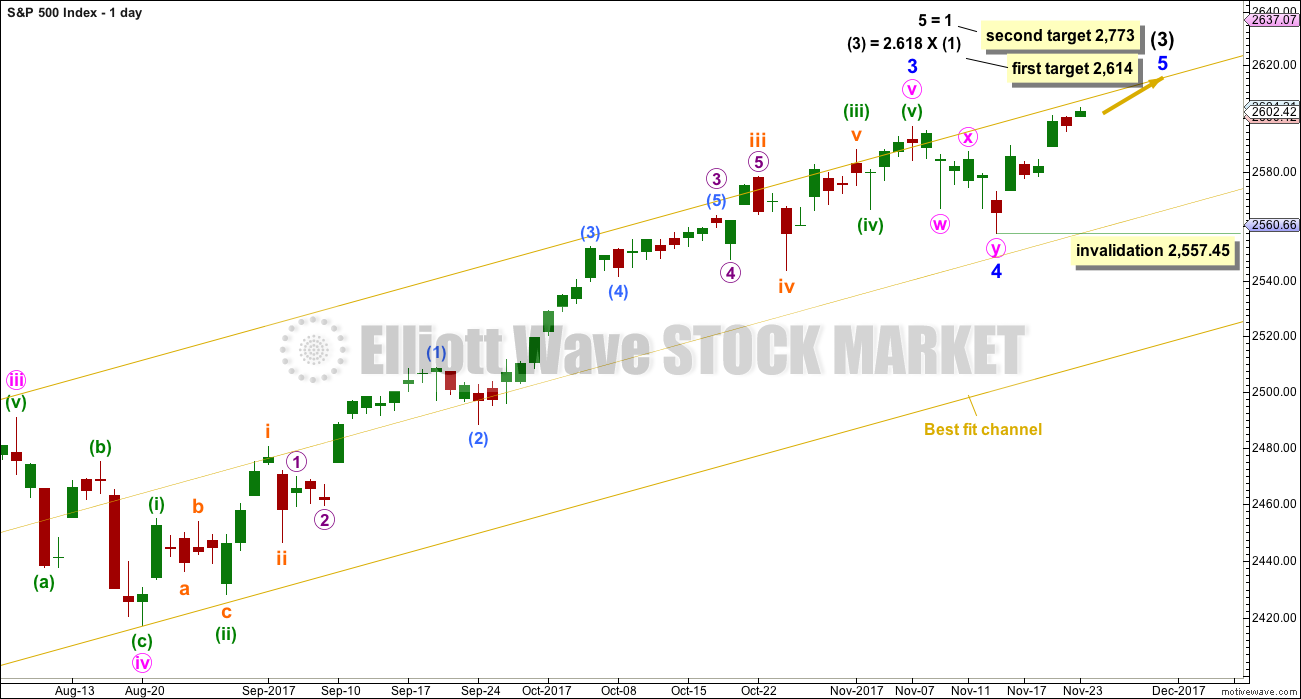
Minor wave 4 may now be complete. It will subdivide very well as a double zigzag. This provides only a little alternation in structure with the single zigzag of minor wave 2. There is also poor alternation in depth: minor wave 2 was very shallow at only 0.16 of minor wave 1, and minor wave 4 would be only 0.12 of minor wave 3. Alternation is a guideline and not a rule; it is seen more often than not, but not always.
The first target at 2,614 would see a Fibonacci ratio between intermediate waves (3) and (1), but no Fibonacci ratio for minor wave 5. This would be acceptable. There is already a somewhat reasonable Fibonacci ratio between the two actionary waves of minor waves 3 and 1, so minor wave 5 may not exhibit a Fibonacci ratio to either of minor waves 3 or 1.
The second target calculated for minor wave 5 expects it to exhibit the most common Fibonacci ratio for a fifth wave. This target would not expect a Fibonacci ratio for intermediate wave (3) to intermediate wave (1).
If price gets up to the first target, and the structure may be complete and there is some divergence with price and Stochastics or RSI, then members are warned that it would be possible for a high to be in place for the mid term. But if price keeps rising through the first target, then the second target would be used.
Within minor wave 5, no second wave correction may move beyond the start of its first wave below 2,557.45.
HOURLY CHART
Click chart to enlarge.
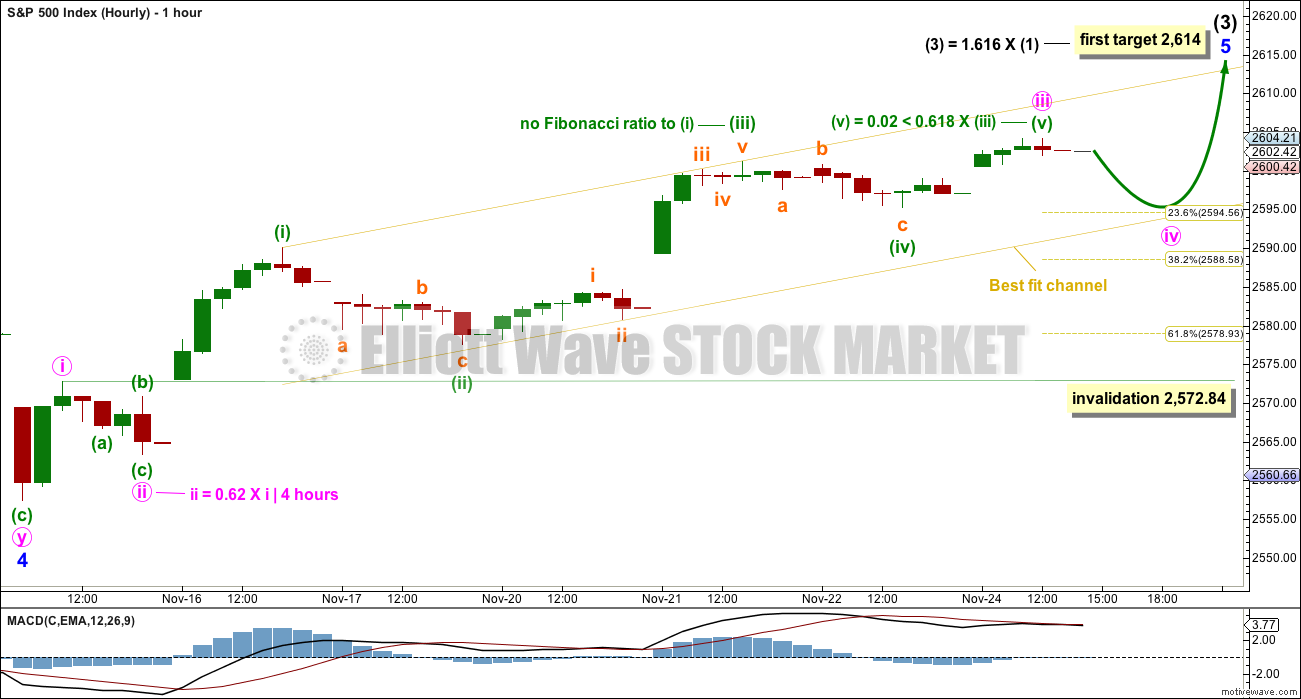
This wave count would still fit very neatly with the first Elliott wave target at 2,614.
Minute wave iii may now be complete as a long extension with a close Fibonacci ratio to minute wave i. This wave count agrees with MACD: the middle of minute wave iii has strongest momentum, the end of minute wave iii exhibits some divergence, and the end of subminuette wave iii within minuette wave (iii) has the strongest reading on the histogram.
Minute wave iv may end about the lower edge of the best fit channel.
Minute wave ii was a deep zigzag lasting four hours. Minute wave iv may exhibit alternation as a flat, combination or triangle. These structures tend to be more time consuming than zigzags, and it may last longer than four hours.
Minute wave iv would most likely be shallow. If minute wave iv ends about the 0.236 Fibonacci ratio at 2,595, then it would end within the price territory of the fourth wave of one lesser degree.
When minute wave iv is complete, then minute wave v upwards should unfold to new highs.
ALTERNATE HOURLY CHART
Click chart to enlarge.
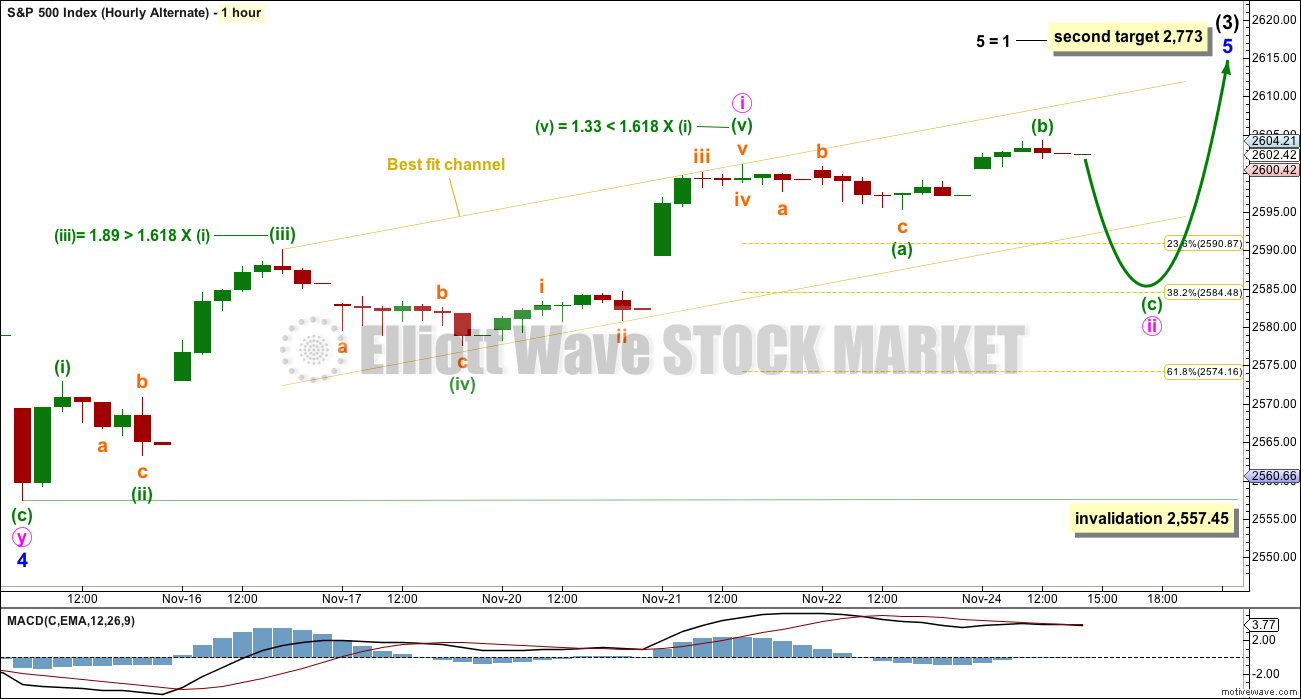
A five up may be complete. This may only be minute wave i within minor wave 5.
This wave count would now expect a pullback for minute wave ii.
Minute wave ii may end about either the 0.382 or 0.618 Fibonacci ratios. The first small second wave correction for the S&P is sometimes shallow, and that is why I have put the label for minute wave ii closer to the 0.382 Fibonacci ratio. Members should be aware of this possibility.
The next target for this alternate wave count, at 2,773, has a better fit.
Minute wave ii may be unfolding as an expanded flat correction. Within minute wave ii, subminuette wave (b) is a little longer than the maximum most common length to subminuette wave (a) of 1.32 but still within the allowable conventional limit of up to 2.
TECHNICAL ANALYSIS
WEEKLY CHART
Click chart to enlarge. Chart courtesy of StockCharts.com.
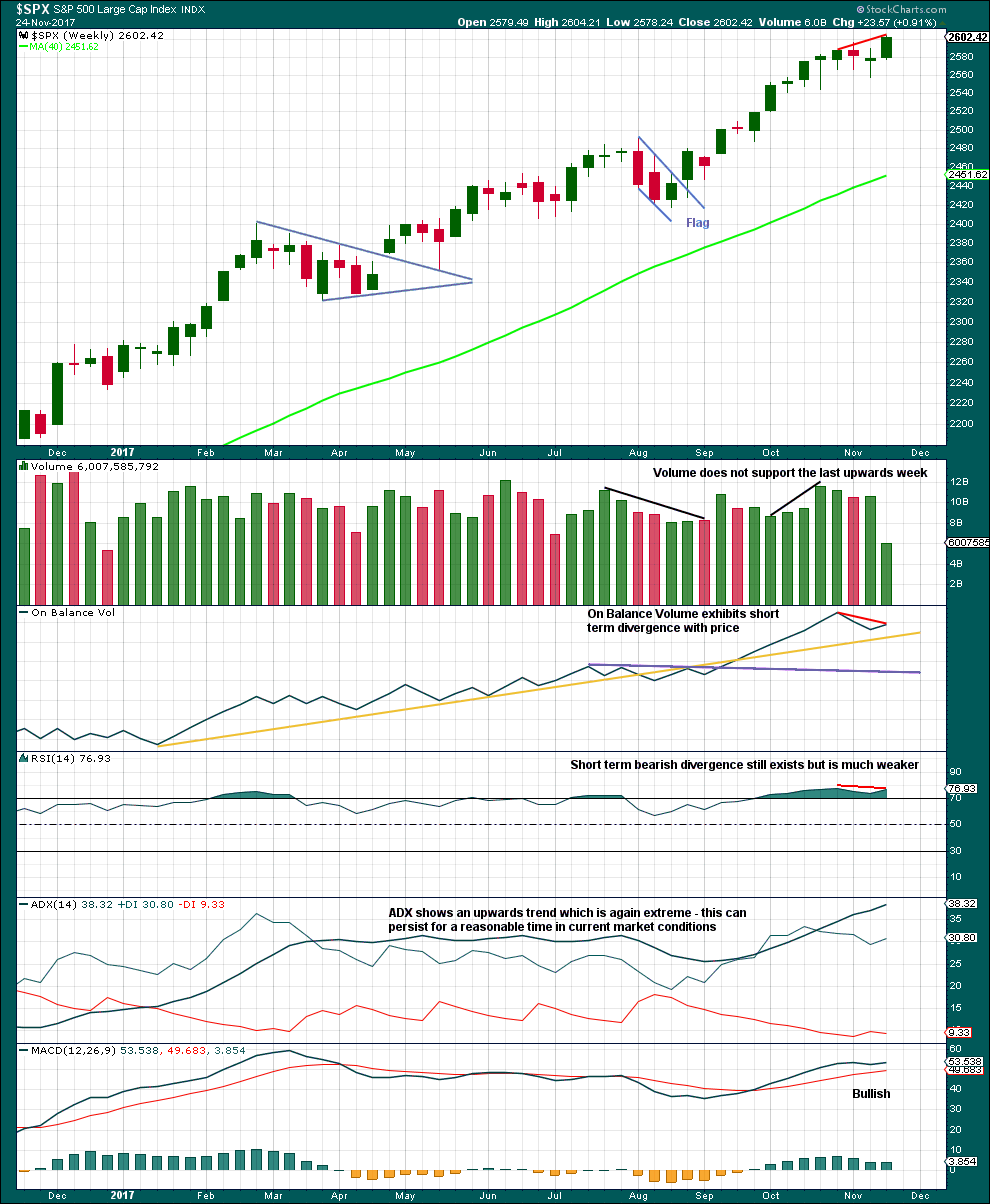
Lighter volume for a week with a US holiday in it would be expected. On its own, this lighter volume should not be taken as a signal that a high is in place.
Some weakness and overbought indicators should be expected as intermediate wave (3) comes to an end.
DAILY CHART
Click chart to enlarge. Chart courtesy of StockCharts.com.
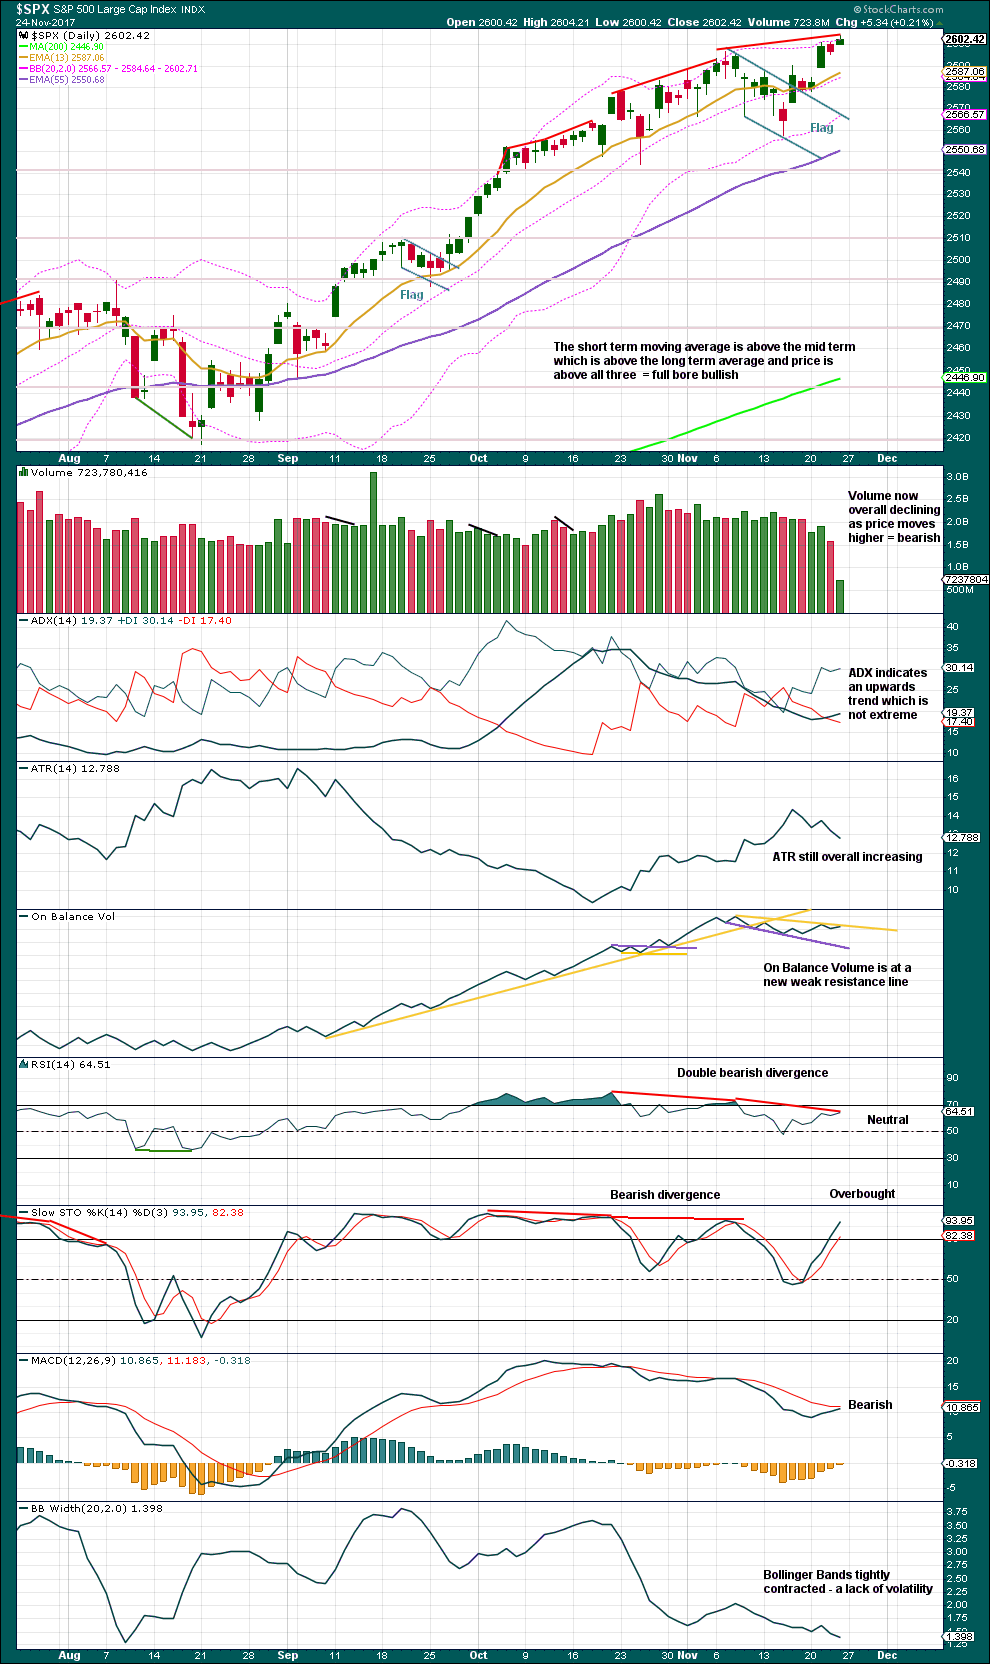
Stochastics is again only just entering overbought. If it develops clear bearish divergence, that may signal a high quickly approaching or in place.
The target using the measured rule for the flag pattern is at 2,634.
VOLATILITY – INVERTED VIX CHART
Click chart to enlarge. Chart courtesy of StockCharts.com.
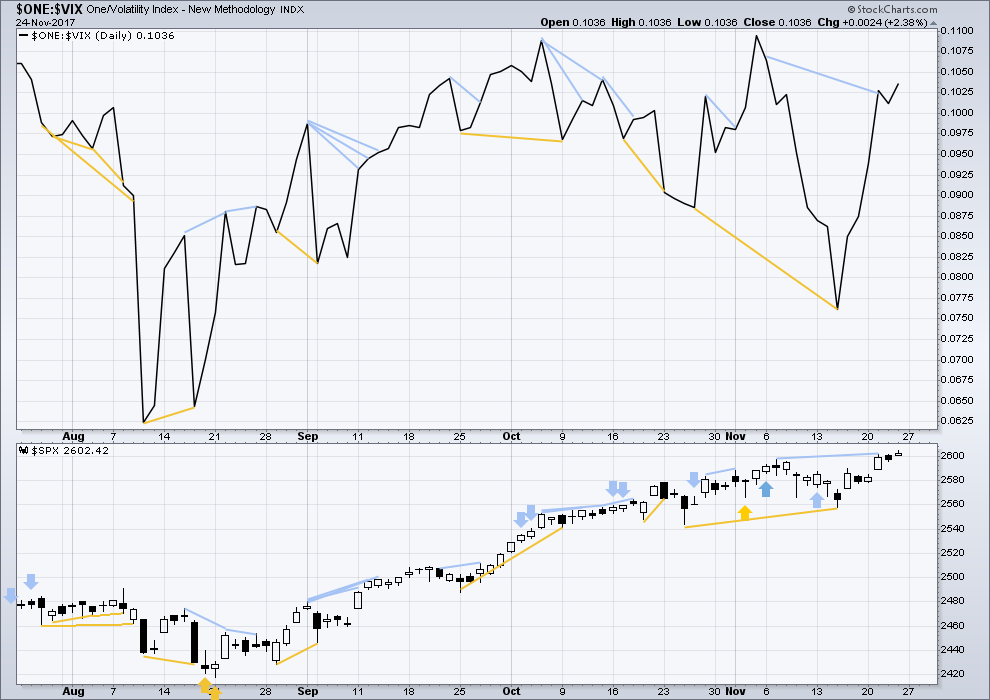
So that colour blind members are included, bearish signals will be noted with blue and bullish signals with yellow.
Normally, volatility should decline as price moves higher and increase as price moves lower. This means that normally inverted VIX should move in the same direction as price.
There is still mid term bearish divergence between price and inverted VIX. This indicates weakness in price. It has been noted in recent months that mid term divergence for VIX does not appear to be very reliable, so it will be given no weight today in this analysis.
BREADTH – AD LINE
Click chart to enlarge. Chart courtesy of StockCharts.com.
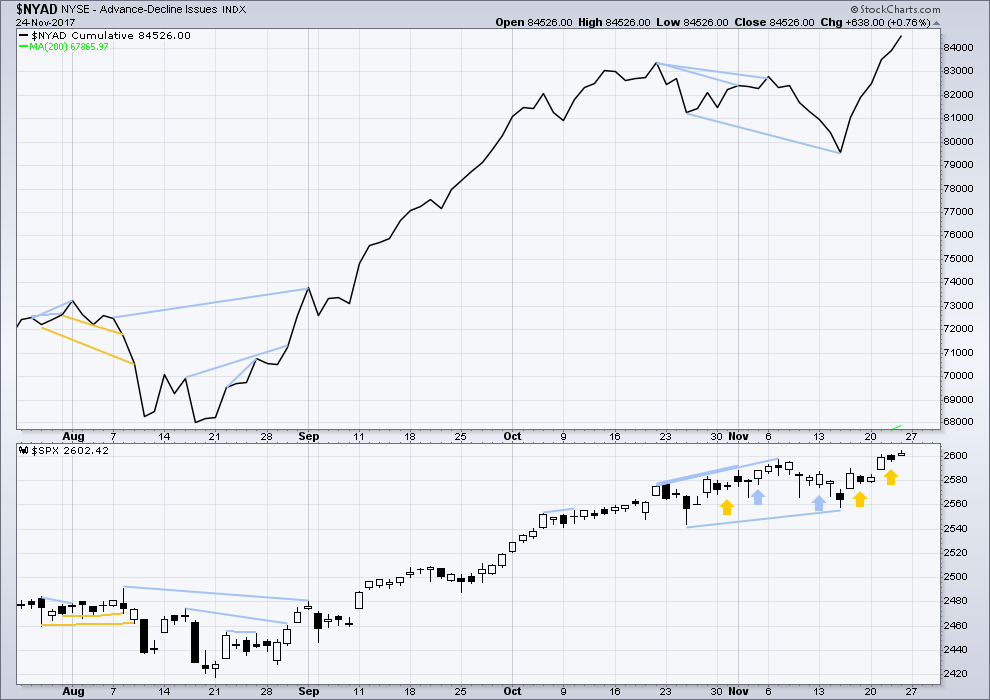
There is normally 4-6 months divergence between price and market breadth prior to a full fledged bear market. This has been so for all major bear markets within the last 90 odd years. With no longer term divergence yet at this point, any decline in price should be expected to be a pullback within an ongoing bull market and not necessarily the start of a bear market.
All of large, mid and small caps this week have made new all time highs. The rise in price has support from market breadth.
The AD line has also made new all time highs. Market breadth is full bore bullish.
DOW THEORY
Only DJT has not made a new all time high this week. The S&P500, DJIA and Nasdaq all this week made new all time highs.
Failure to confirm an ongoing bull market should absolutely not be read as the end of a bull market. For that, Dow Theory would have to confirm new lows.
The following lows need to be exceeded for Dow Theory to confirm the end of the bull market and a change to a bear market:
DJIA: 17,883.56.
DJT: 7,029.41.
S&P500: 2,083.79.
Nasdaq: 5,034.41.
Charts showing each prior major swing low used for Dow Theory are here.
Published @ 03:40 p.m. EST on 25th November, 2017.
Kevin Muir from Macrovoices is the first guy I have heard talking about what is likely to happen when the short vol trade blows up. It is truly stunning that no one else has been talking about what could happen when we finally get a correction. He is of the opinion that all those ETFs short vol futures could end up owing the exchanges billions of dollars with massive premiums on the futures contracts and no willing sellers.
Here again is a link for the interview and Muir can be heard at about the 63 minute mark talking about this.
http://www.zerohedge.com/news/2017-11-25/francesco-filia-worlds-twin-asset-bubbles-could-collapse-under-their-own-weight
Updated hourly chart:
The wave count fits best if todays new high is the end of minute iii. Still good Fibonacci ratios.
Minute iv may have begun with todays downwards movement. It should last just a little bit longer than it has so far, so I wouldn’t want to label it as a complete zigzag at todays low. That would see inadequate alternation and poor proportion.
Minute iv may be a flat, combination or triangle. Minuette wave (a) or (w) so far looks best as a three on the five minute chart.
Conclusion: more sideways chop for a small shallow correction, followed by an upwards breakout to new highs quite soon. Use corrections as an opportunity to join the upwards trend.
Thank you Lara. What do you consider the potential or likelihood that these minute moves are in fact minuette moves, and the impending completion of minor 5 will in fact just be the completion of minute 1 of minor 5? Because I continue to be struck by the extremely short nature of this minor 5 as labeled (though I recognize it would still meet EW rules). To put it a little differently, what compels your current labeling vs. having it all “down a timeframe” here?
I’d say about 50:50 actually Kevin.
My go-to alternate is always to move the degree of labelling down. And so when the impulse up looks complete that’s exactly what I’ll do.
I’ll have a main wave count then that moves the degree down and so assumes the trend remains the same (I should get a t-shirt with that as a slogan, LOL)
Then the current labelling will become an alternate.
Which will mean that we will need a new low below the start of minor 5 at 2,557.46 for price to confirm that intermediate (3) is over and intermediate (4) has arrived.
I will say though that for the S&P it’s fifth waves can often be quite short. They do tend to equality with the first wave.
Looks really good. We could get one more VIX dive ahead of the turn up for minor five. Look for strong VIX divergence to continue as minor 5 comes to an end…
Waiting for that dive but I suspect the correction to make $$$ might be a few months out due to seasonal bias.
Could be. The market seems to be bucking seasonal bias this year as we saw for expectation of bearish moves. If that continues, the same could happen for bullish seasonality…
The “stink bid” is a great way to pick up volatility on the cheap. Who ever executed that spike down last Friday gave me a very quick double on a few stink bids. I did not even know it had happened until I looked at my account and went “What the….!!!!”
It is really incredible that they do this. If more people start to leave stink bids open ahead of these ridiculous spikes market makers are going to be in some very serious hot water if they keep doing it….keep it quiet will ya??!! 🙂
Verne,
I was looking out to April 2018 timeframe and options premiums are huge so might as well by the underlying using your technique of stink bids. As Kevin pointed out, the drops have been smaller and smaller but I suspect one of the days this week, we will get that swish into $8 range and that might be the time I open 1/3 position on it and see how it goes.. atleast that is the plan but markets have a different agenda.. 🙂
Let the games begin!
Bearish engulfing candle in IWM today but bid on at -the- money puts retreating….hmmnnnn…!
ADI doing a large expanding flat correction and approaching a 38.2% fibo, a good set up for a long could be just around the corner.
The moment I saw the market popping up this morning I thought I smelled a rat. Bought some VXX just as it started breaking down from the consolidation zone. Should have bought a lot more…
On the positive side, the lower XIV goes, the more potential for a big score!! It will be back to new highs sooner or later, with sooner much more likely.
“Saying Bye to Buybacks
Companies in the S&P 500 are on pace to spend the least on buybacks since 2012.”
“Large companies are repurchasing their shares at the slowest pace in five years, as record U.S. stock indexes and an expanding economy propel more money out of flush corporate coffers into capital spending and mergers.
Companies in the S&P 500 are on pace to spend $500 billion this year on share buybacks, or about $125 billion a quarter, according to data from INTL FCStone. That is the least since 2012 and down from a quarterly average of $142 billion between 2014 and 2016. ”
Source: Wall Street Journal… By Ben Eisen and Chris Dieterich
Updated Nov. 23, 2017 2:47 p.m. ET
11:17AM ET… Did a pin just get inserted?
My feed indicated that bitcoin (GBTC) was up 23% this morning (but has sold off and is now at up 14%…only!). Total insanity. Anyone got a position in this? It’s tempting, but…every time I’ve tried to get on fast moving elevators like that, I end up getting in at just about the top floor somehow. And the market makers behind GBTC I’m suspicious about too. Anyone??
Bitcoin… Fantasy Money!
I have one question on those that dabble in this? What is your Legal recourse when you wake up one morning and your account is zero from a previous balance of 1000 Bitcoin?
The block chain technology and the cryptography that enables it is a far better assurance than, say, a bank “managing” your money (how often and how much are they ripped off yearly by the Russian mafia/government, the North Koreans, etc every year? Billions, I do believe!). Your bitcoins cannot disappear…unless of course you lose your key(s) that enable access to the coins (to someone else who uses them).
You could wake up and find the value of your coins to be zero. But that can also happen with any single equity holding too.
Anyone have solid ideas about when bonds should start falling due to rising interest rates (and thus TBT start rising)? I’m underwater in TBT and may want to double, under the theory that interest rates “for sure” are going to rise, and then bonds “must” come down. It’s that for sure and must parts that have me cautious….
Which Bonds? High Yield will tank 1st!
20 year US treasury
1st the Tax Bill must become Law… signed by the President.
Then… you will ONLY know that a higher level of rates are in the cards when the 30 Year US Treasury breaks above a Yield of 3.26% and accelerates higher.
Short of that occurring the US Treasury Yield is going to get Very, Very FLAT! 10 basis point spread across all maturities is my definition of Very, Very Flat!
High Yield Rates will surge higher before anything else.
The so-called wealth management firms in China ( a way for shadow banks to pump cash into the Chinese economy) are actually selling their more credit worthy government bonds to meet redemption requirements and holding onto riskier junk rated bonds. This is wholly unexpected but does make sense when you think about. The selling of those bonds in masse would trigger runaway rates and a plunge in those asset prices, destroying portfolios willy nilly. Besides, they can maintain a semblance of solvency by still recording the higher rates these bonds pay. Many have commented on how strange it is that the rates of these instruments have not moved despite the massive deleveraging that is underway. They are not being sold…yet!
TBT is probably a safe trade in your long term account. Here is a pretty good take on what we could expect…
http://www.zerohedge.com/news/2017-11-25/francesco-filia-worlds-twin-asset-bubbles-could-collapse-under-their-own-weight
It’s just another means of exchange. Albeit, one which is currently in a huge speculative mode and the value of it is whipsawing.
I accept Bitcoin as payment for membership here. Have done for a long time.
I would actually prefer it to USD.
Just buy some Bitcoin and hold on for a couple of years. Or more. That would be my conclusion.
Or, more profitably, wait for the bubble to burst and for it to begin its way down and short it.
You can do that with a BitStamp account.
“Most indications suggest that activity was down at stores. ShopperTrak found that store traffic fell by about 1%.”
Check out AWC (Animated Weapons Company). It is listed on the WGN exchange.
I’m buying Rodney!! I’ll add it to my very long term hold of ACME!!
Grab me 100K shares, thank you!! 🙂
Can I sell covered calls against my position??!!
From the looks of this weekend’s postings, defense stocks should be up hard! Buy, Buy, Buy.
Lara-re the Grand Supercycle analysis,I presume you’re preferring the Bullish count now?
Yes, I am.
I should probably update that and republish it, shouldn’t I.
Once again the first horse out of the gate. That’s why they call me lightning Rod!
If you are so fast, buster, care to meet me at the Carrot Corral? 🙂
what are you smokin wabbit?
Cohibas, Doc… 😀
I’m yo hucklebewwie, wabbit!!!
Please….No tanks!!! Six shooters ONLY, Y’hear Doc??!! 🙂
Get ready to dance, wabbit!!
Dodgy wabbit.
O.K. Doc, just remember, yer asked for it..!