
A small inside day is inconclusive.
Members are given guidance on how to draw a trend channel on the hourly chart, and which price point will differentiate the two Elliott wave counts for the short term.
Summary: The first target is again at 2,614. A second target is at 2,773. At the end of the week, bullishness from both the AD line and VIX supports the main wave count.
A second wave correction to come may possibly offer a good entry point to join the upwards trend, but be aware although it is likely to be deep it does not have to be.
Always trade with stops and invest only 1-5% of equity on any one trade.
Last monthly and weekly charts are here. Last historic analysis video is here.
MAIN ELLIOTT WAVE COUNT
WEEKLY CHART
Click chart to enlarge.
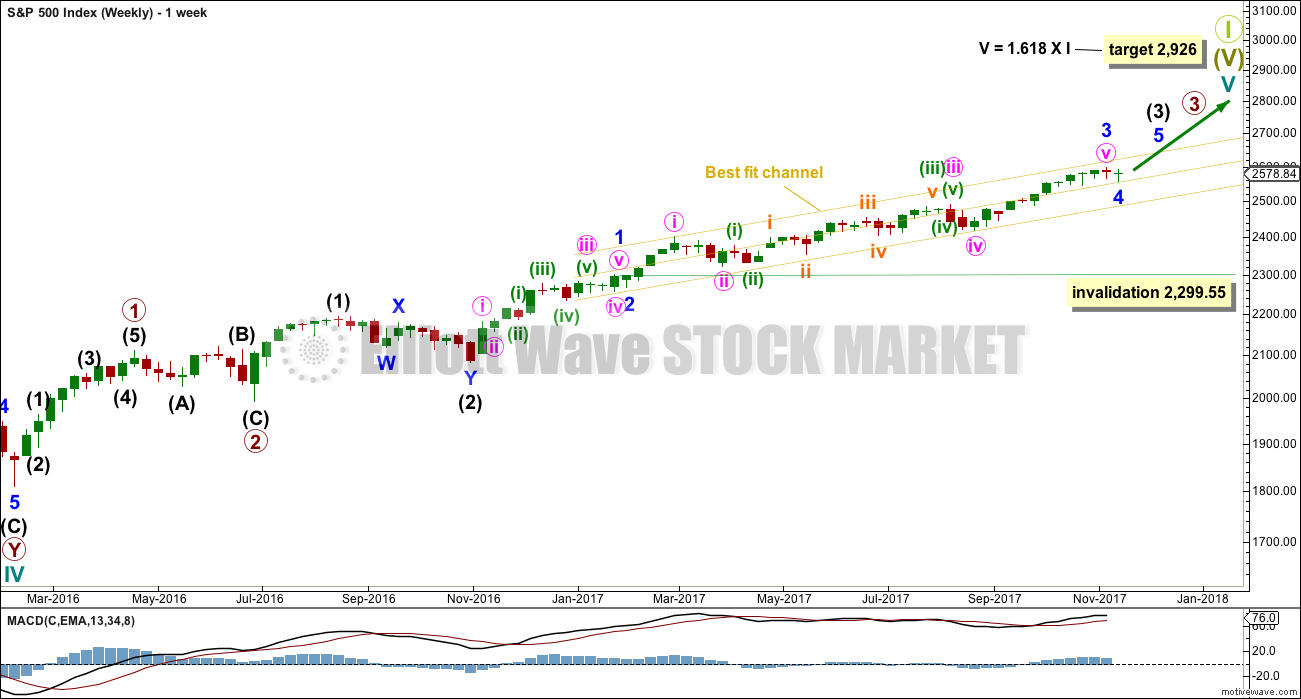
Cycle wave V must complete as a five structure, which should look clear at the weekly chart level. It may only be an impulse or ending diagonal. At this stage, it is clear it is an impulse.
Within cycle wave V, the corrections for primary wave 2 and intermediate wave (2) both show up clearly, both lasting several weeks. The respective corrections for intermediate wave (4) and primary wave 4 should also last several weeks for the wave count to have the right look at the weekly and monthly time frames, so that they show up at weekly and monthly time frames.
Cycle wave V has passed equality in length with cycle wave I, which would be the most common Fibonacci ratio for it to have exhibited. The next most common Fibonacci ratio would be 1.618 the length of cycle wave I.
Intermediate wave (3) looks incomplete. It may only subdivide as an impulse. Within intermediate wave (3), minor wave 4 may now be complete. If it continues further as per the alternate wave count below, then it may not move into minor wave 1 price territory below 2,299.55. However, minor wave 4 should remain contained within the yellow best fit channel if this wave count is correct.
DAILY CHART
Click chart to enlarge.
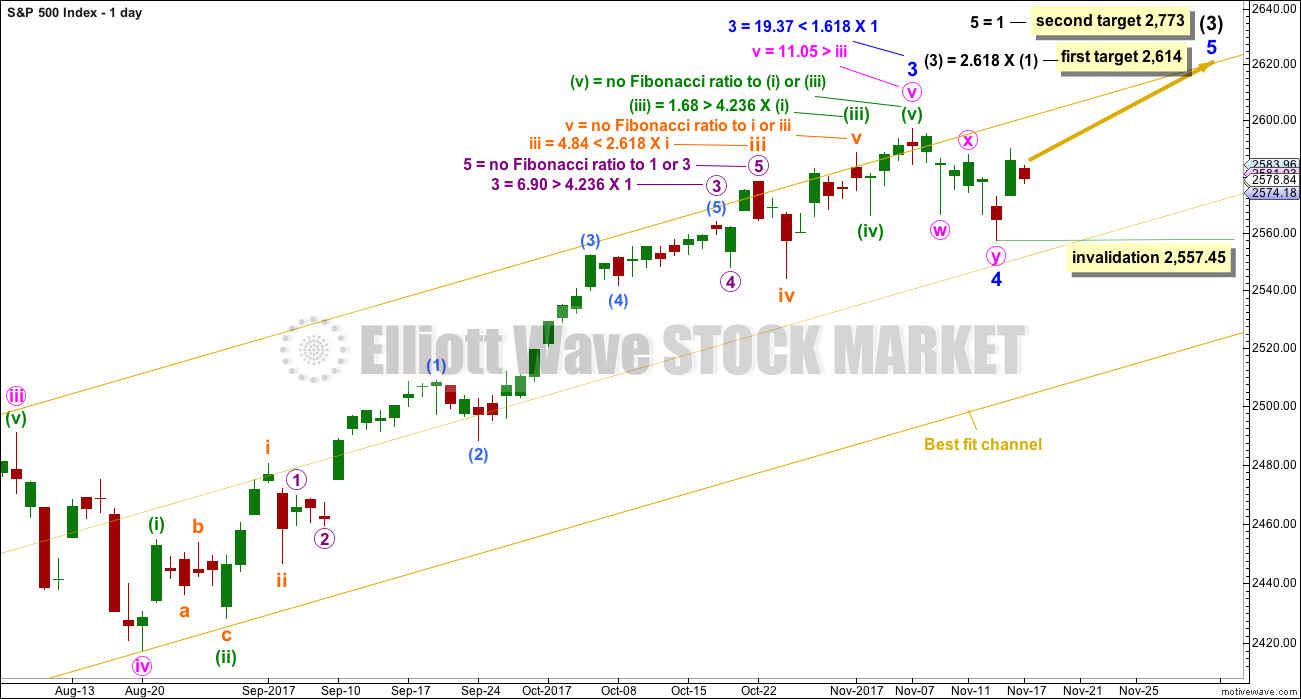
Minor wave 4 may now be complete. It will subdivide very well as a double zigzag. This provides only a little alternation in structure with the single zigzag of minor wave 2. There is also poor alternation in depth: minor wave 2 was very shallow at only 0.16 of minor wave 1, and minor wave 4 would be only 0.12 of minor wave 3. Alternation is a guideline and not a rule; it is seen more often than not, but not always. This is one reason why this wave count had to be judged to be an alternate until price has shown it may be more likely.
The first target at 2,614 would see a Fibonacci ratio between intermediate waves (3) and (1), but no Fibonacci ratio for minor wave 5. This would be acceptable. There is already a somewhat reasonable Fibonacci ratio between the two actionary waves of minor waves 3 and 1, so minor wave 5 may not exhibit a Fibonacci ratio to either of minor waves 3 or 1.
In making a judgement as to whether a reasonable Fibonacci ratio exists or not, it is my method to calculate the variation from an exact Fibonacci ratio. If the variation is less than 10% the length of the wave being judged, then the ratio is acceptable. If the variation is more than 10%, then I conclude there is no adequate Fibonacci ratio.
The second target calculated for minor wave 5 expects it to exhibit the most common Fibonacci ratio for a fifth wave. This target would not expect a Fibonacci ratio for intermediate wave (3) to intermediate wave (1).
If price gets up to the first target, and the structure may be complete and there is some divergence with price and Stochastics or RSI, then members are warned that it would be possible for a high to be in place for the mid term. But if price keeps rising through the first target, then the second target would be used.
Within minor wave 5, no second wave correction may move beyond the start of its first wave below 2,557.45.
HOURLY CHART
Click chart to enlarge.
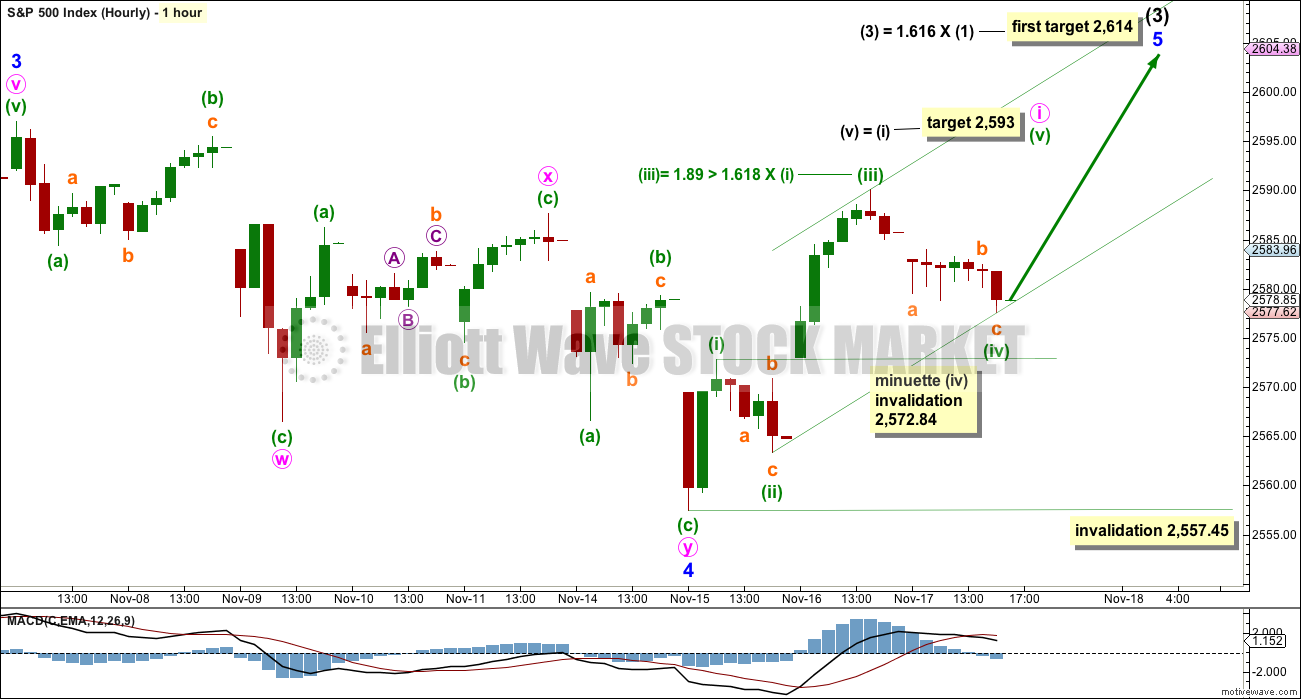
If a low is in place, then a five up on the hourly chart should develop. This is not yet complete.
Within the first five up, minuette wave (iv) may not move into minuette wave (i) price territory. When a new high is seen above today’s high, then a five up could be complete at any time.
Price has not remained within the channel, which was drawn on the hourly chart in last analysis. This is a warning that this main wave count may not be correct. However, it does remain valid and reasonable.
When fourth waves breach channels drawn using Elliott’s first technique, then the channel must be redrawn using Elliott’s second technique: draw the first trend line from the ends of minuette waves (ii) to (iv), then place a parallel copy on the end of minuette wave (iii). This channel may be used to show where minuette wave (v) may end, either mid way within the channel or at the upper edge.
If price remains above 2,572.84 and makes a new high above the end of minuette wave (iii), then a five up would be complete at the hourly chart level. That would offer strong confidence to this main wave count.
Thereafter, a breach of the Elliott channel would indicate the five up should be complete and a three down should follow.
Minute wave ii may be relatively shallow and brief; although this is not common, members are warned that it has happened before: corrections in the beginning were brief and shallow at the start of minor wave 3.
Minute wave ii may be a more common deep second wave correction. The 0.618 Fibonacci ratio of minute wave i would be the preferred target.
Minute wave ii may not move beyond the start of minute wave i below 2,557.45.
ALTERNATE HOURLY CHART
Click chart to enlarge.
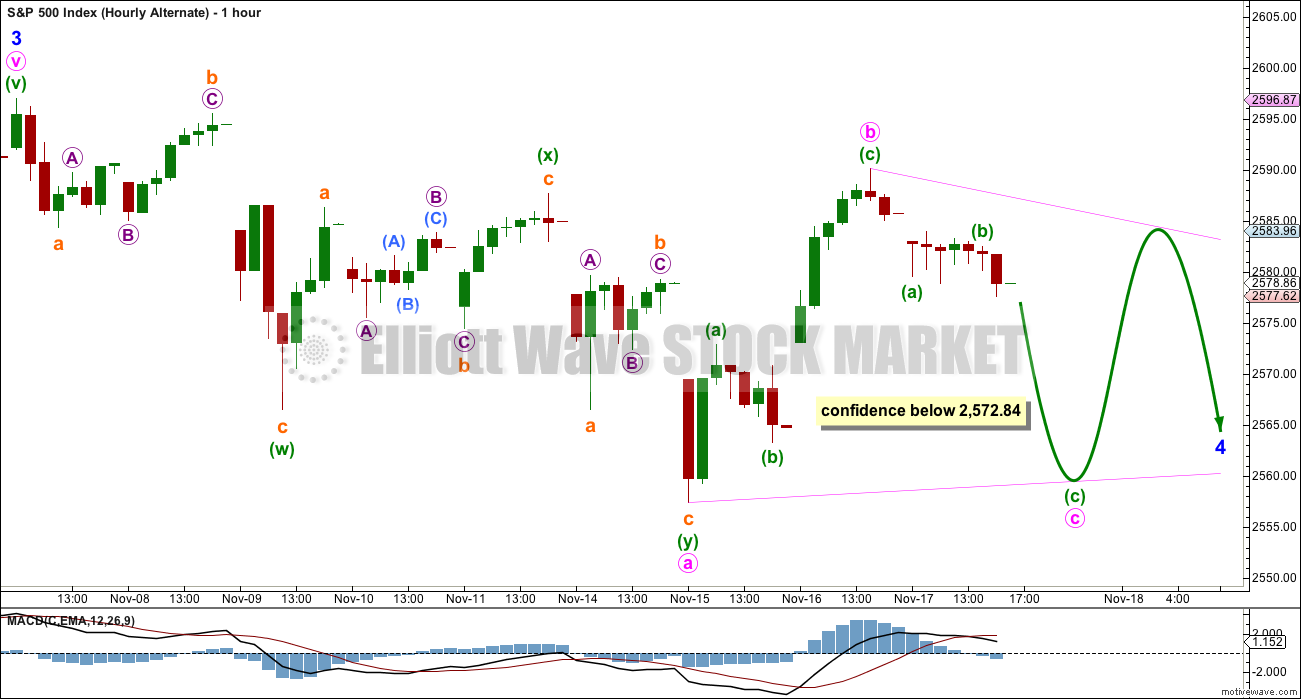
By simply moving the degree of labelling within minor wave 4 down one degree, it is possible to see that it may not be over and may continue sideways for a few days yet as a triangle or flat correction.
Here, minor wave 4 is labelled as a possible triangle. This looks at this stage to be the most likely alternate scenario.
Within a possible triangle, the first sub-wave of minute wave a fits best as a double zigzag. If this labelling is correct, then all remaining triangle sub-waves must be simple A-B-C corrections, and all but one must be single zigzags.
Minute wave b within the possible triangle would have to be complete here. It cannot move higher as a double zigzag because only one triangle sub-wave may be a more complicated multiple.
Minute wave c may not move beyond the end of minute wave a below 2,557.46.
Minute wave d to follow upwards may not move beyond the end of minute wave b above 2,590.09.
Minute wave e downwards to end the triangle may not move beyond the end of minute wave c.
The triangle may take another five days minimum to complete, if it totals a Fibonacci thirteen days.
What about a possible flat correction for minor wave 4?
This is the other possibility, but it looks less likely at this stage. Within a flat, both minute waves a and b must be three wave structures. Minute wave a can be any structure except a triangle, but A waves within flats are most commonly zigzags. The next most common structure for them would be a flat correction. They are uncommonly double zigzags.
Minute wave b within a flat correction would have to move higher as a double zigzag to reach the minimum requirement of 0.9 the length of minute wave a at 2,593.06. The most common length for minute wave b would be from 1 to 1.38 times the length of minute wave a, giving a range of 2,597.02 to 2,612.06.
While it is possible for both minute waves a and b to be double zigzags, it is not a common occurrence, and for that reason it is not charted today.
What about a possible double combination for minor wave 4?
If the downwards wave labelled here minute wave a is correctly labelled as a double zigzag, then a combination continuing sideways for minor wave 4 may be eliminated. The maximum number of corrective structures within a multiple is three: this refers to W, Y and Z. Within each of W, Y and Z, the structures may only be labelled as simple A-B-C corrections (or A-B-C-D-E in the case of triangles). To label multiples within multiples is to increase the number of corrective structures beyond three, violating the Elliott wave rule.
TECHNICAL ANALYSIS
WEEKLY CHART
Click chart to enlarge. Chart courtesy of StockCharts.com.
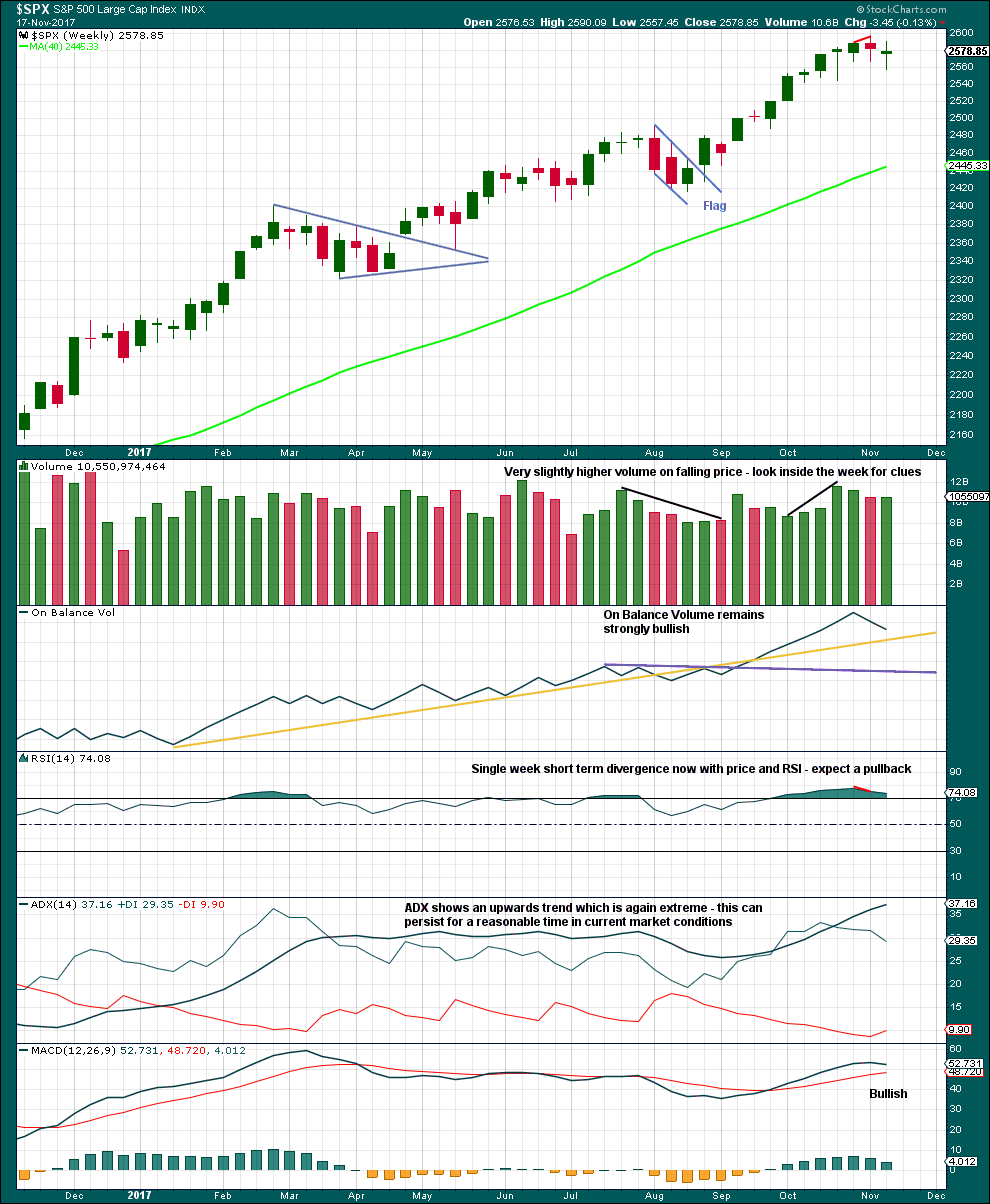
A small range, downwards week completes as a small doji. This indicates a balance of bulls and bears and indecision. At this stage, this small week does not look like a convincing beginning of a new downwards trend, and looks much more like a small pullback within an ongoing upwards trend that should be used as another opportunity to join the trend.
There is a little distance below before On Balance Volume finds support. It is entirely possible that the pullback is not over.
DAILY CHART
Click chart to enlarge. Chart courtesy of StockCharts.com.
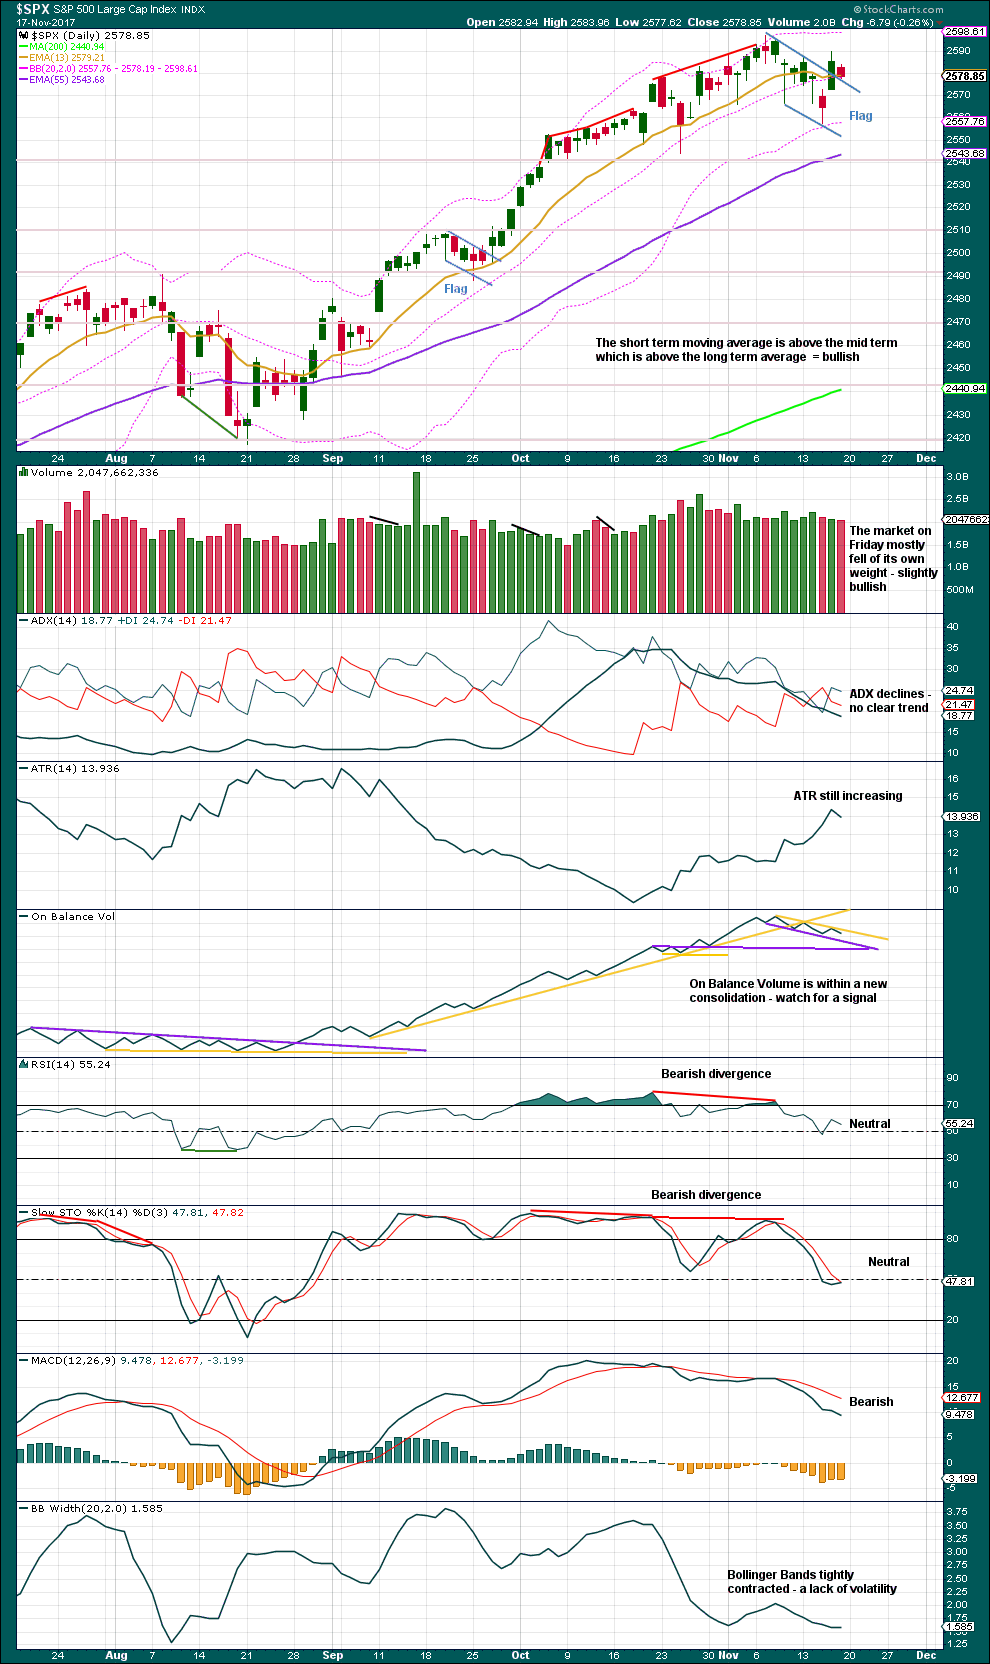
After a possible upwards breakout from a small flag pattern, it looks today like price may have turned down to test support at the upper edge of the flag.
Watch On Balance Volume for the next signal.
VOLATILITY – INVERTED VIX CHART
Click chart to enlarge. Chart courtesy of StockCharts.com.
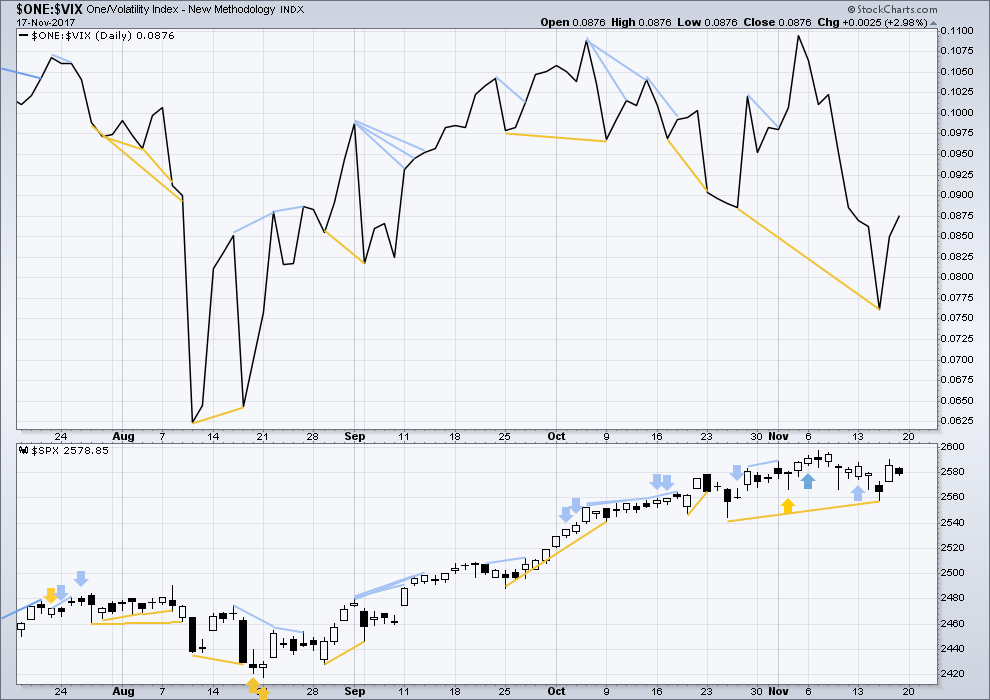
So that colour blind members are included, bearish signals will be noted with blue and bullish signals with yellow.
Normally, volatility should decline as price moves higher and increase as price moves lower. This means that normally inverted VIX should move in the same direction as price.
Price moved lower during the session, but inverted VIX diverged as it moved higher. The decline in price for Friday was not accompanied by a normal corresponding increase in volatility. The conventional interpretation here is of regular bullish divergence; there is weakness within price.
BREADTH – AD LINE
Click chart to enlarge. Chart courtesy of StockCharts.com.
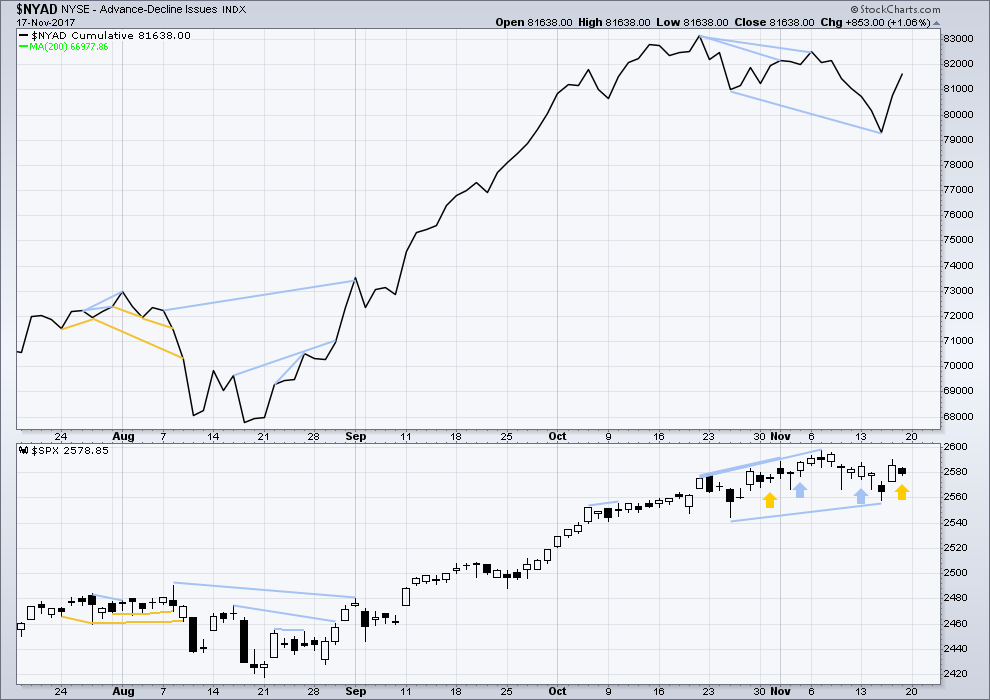
There is normally 4-6 months divergence between price and market breadth prior to a full fledged bear market. This has been so for all major bear markets within the last 90 odd years. With no longer term divergence yet at this point, any decline in price should be expected to be a pullback within an ongoing bull market and not necessarily the start of a bear market.
Mid and large caps this week moved lower, but small caps moved up to make a high above the prior week. Small caps are this week strongest and may be leading the market at this time.
During Friday, although price moved lower, market breadth improved. As the AD line may be a leading indicator, this is interpreted as bullish; price may follow with upwards movement.
DOW THEORY
Only Nasdaq has made a new all time high this week. The S&P500, DJIA and DJT have not yet made new all time highs.
Failure to confirm an ongoing bull market should absolutely not be read as the end of a bull market. For that, Dow Theory would have to confirm new lows.
The following lows need to be exceeded for Dow Theory to confirm the end of the bull market and a change to a bear market:
DJIA: 17,883.56.
DJT: 7,029.41.
S&P500: 2,083.79.
Nasdaq: 5,034.41.
Charts showing each prior major swing low used for Dow Theory are here.
Published @ 06:13 p.m. EST.
cont. from below…
Follow the MONEY! That is who is in bed with the Russian Government!
FBI & other Law Enforcement have followed the money in Racketeering Cases against the Mob for Decades!
That’s how you Solve the Russia thing! You are all NOT going to like where it leads, however! It’s certainly not to Trump!
It’s to the people screaming the loudest… Russia… Russia… Russia…!
They have Committed Treason!
Not Trump!
I’m all increasingly disenfranchised by the continued and subdividivion of our society into two factions. My generation,25-35, are going the bear the burden of this next giant reset; while all of
Most I speaker want is Washington out their daily lives and the ability to succeed. As a small businesses owner we are no position to be afforded the ability to leverage up to revive the free money from the Fed and also no a very difficult position to continually comply with all the changing regulations. I also believe it’s childish to succumb to the two party narratives as both do the same thing. Where’s all the free market purists to call out both sides? $5b for Amazon who’s deliveries are subsidized by the taxpayer. GTFOH, I know plenty of quality retail operation who would love that opportunity. Apologies for the rant, but I do believe all of us you trade the capital markets; especially for clients, should
All be on the same side of indetifying the real structural and macro prudential problems with developed governments, in order to educate the public and our peers of the real problem. Will are all
On the same side of reforms and should no longer be victims and chess pieces played into a false narrative. My two cents, we need more passionate and enlightened people to undermine both politics and their minions on K street and the central. A historical reset is nearly upon us and we have to prepare by uniting good people who will be left the mess once the rest begins. And it seems increasingly childish to think of important issues in democracy or republican terms when our forefathers did not intend it to be so. We are all on the same side and need to realize it soon. The vulnerability of oceanic oxygen production scares me more than any enemy bankster.
VIX below 10.50. A close below almost certainly means a new 52 week low ahead…
Verne,
Noticing that Apple is not being agreeing with the market . Typically, there is a alignment and sync between the bell weather such as Apple and markets but that has been off. Either Apple will wake up one fine morning and start running or the markets will follow Apple to make a short term bottom. This misalignment can’t stay for long but we shall see.
Yep. It is looking rather lethargic…
Well well well. A very interesting debate in comments today, and well done to everybody who is participating for keeping it so very civil.
Like I keep saying, we’re all adults here. We should feel free to discuss whatever we like in this forum, because we can all behave perfectly well in an online space.
Nicely done folks, very nicely done.
I’ll make my own comment later, I’ll quickly outline the NZ example. But right now… gotta go catch a few waves while I wait for NY to close and StockCharts to finalise their data.
Updated hourly chart:
Pretty much no change really. Price remains within the Elliott channel with small overshoots. Fifth waves are more often than not weaker than third waves for the S&P, so this so far looks typical.
If that channel is breached at this stage I’d be suspicious that the alternate is correct. While price remains within the channel then it looks like a five up is completing.
Lara,
I’ve been thinking about your first target of 2614 for Minor 5 / Intermediate 3. It seems to me if we are just completing Minute 1 of Minor 5, there is not nearly enough room for Minute 3, 4, and 5 to complete. Am I correct in this thinking? If so, the next target of 2773 is really on the table now.
That’s a great question Rodney! Among other things, it adds to my suspicion that the minor 4 isn’t complete yet. The next downleg of that alternate hourly triangle might just be right around the corner.
The first target at 2,614 would probably need the degree of labelling within minor 5 moved up one degree, that would still expect minute v within it to be extended.
The argument that politicians are offering for big tax breaks for C corporations make no sense. What CEO in his right mind would make any kind of capital investment in the face of flagging demand dynamics? That argument has sway only with those uninformed about the true state of the economy. Capital expansion in an environment that demographically points to years of spending contraction is simply not going to happen, no matter how big the tax breaks for these companies. Sub chapter S and LLCs have a much better likelihood of pushing tax relief back into the economy…
Vern, I don’t agree… Back in the early 80’s after the initial tax cut/reform… Accelerated expensing caused a vary large capital investment boom in the USA which laid the foundation for the Growth we had in the 80’s and 90’s and that was as we were going into a deep recession. That accelerated expensing drove growth with some quarters exceeding 7%+.
The timing was right then and the timing is right now! Now of course you have two drivers… 100% expensing upon the time invested and the change to a territorial tax system + 20% rate for C corps and 25% for pass throughs.
But… This will build the foundation for accelerated growth going forward… but all that expensing is not good initially for earnings and therefore stock prices. There will be an adjustment period, a cleansing for 12 to 18 moths.
Joe the big difference then was surging demographics, with baby boomers entering their peak spending years. Not so today.
I have read and listened to this demographic argument for years and it doesn’t really tell you anything ahead of time.
And yes I heard all the arguments from Dent over the years! He has a much worse track record than EWI.
I believe in the 1990’s he was using that argument to say DOW to 40,000… and that was before the dot com bust in 2000 – 2003. Then he changed his tune after that bust.
Whether due to demographics or other reasons, demand is on the wane. Look for instance at retail. The contraction, whatever the reason, is being reflected in consistently shrinking top and bottom line revenue. Not sure how capital expansion and/or reinvestment will remedy that.
The Reason… ZERO income growth of the middle class for 17 years.
They can no longer afford to spend without regard to their budget. Up to 2008-9… they used the equity in their homes to make those purchases. Now they have neither.
Absolutely right! In fact a recent statistic I saw speaks volumes to that specific point. A recent spike in consumer debt did not see a commensurate increase in spending. The implication is that consumers are going into debt just to meet bare necessities! 🙁
Verne, if i hadn’t made it clear how much I love your analysis, let me reiterate, right on Brother! This whole “economy is safer, healthier, more profitable” is BS. All the benefits under Obama went to the top and they’re looking to continue that bias!
Another significant issue is the growth of the US debt long term. I found the opinion piece by Jeffrey Sachs of Columbia University to be highly informative in this regard, and extremely concerning. It was published on CNN, if you care to find it. The title is “Dear Senators: Don’t Bankrupt our Country”.
Haha, right on Kevin, but methinks no one is intending to pay it back
I think I am done trading market indexes!
Unless you are going to trade Futures and I am NOT!
It’s impossible to play the waves… impossible! Can’t get a point for dollar move in the index.
When I am ready, I am going to post what I have purchased and the price (Specific Stocks)… and what I have sold and the price. When I execute. The waves will only be informational for material turns in the market. Which may help with the specific buy and sell points for each specific stock.
The markets have gone nowhere for weeks now. This is one of the toughest trading environments I’ve ever seen. Low volume means constant whipsawing. I have been trying to avoid that by trading big lots and grabbing profits before they gang up on your position. Sadly, scalping has been the ONLY way to survive what has been going on.
I suspect the trading environment is only (generally) going to get even more difficult, as the market moves into this sequence of yet larger and larger 4-5 waves. Those whose neural nets (human or otherwise) have been trained on the prior stages of the bull market are in for some surprising market action, me thinks.
As we move ahead with the complexity and magnitude of the tax reform, one might claim how could they take this week off with the deadline that’s on the table?
Wouldn’t they all want to hear a massive quite cheer looming in the air from the American’s if it gets done this year? Wouldn’t they all be tempted to work around the clock and devote themselves to developing a tax machine that will build the economy? I’m not defending the case but pyramiding work for the last minute would surly break ’em down before they build ’em up. The engine of prosperity in America comes from the generations and generations of immigrants trying to achieve the American dream and the opportunity is still there but if the government can’t keep it’s promise it may symbolize a freedom that’s straining for an excuse to hang on. Anyhow, for all those 70% or more who celebrate Thanksgiving, Happy Holidays.
A recent poll indicates that only 16% of Americans believe this tax theft plan will reduce their taxes. I don’t expect much cheering. Oh, there will be 1% of the population cheering loudly though. Windfalls off the backs of others tend to do that. I personally will be giving thanks for the millions in the US who are #resisting the growth of fascism, white supremism and the resurgent dumpster fire of racism in our country.
That’s a Dumb Ass poll as the majority of americans don’t understand how to do there own taxes! They either use a program to calculate or pay a professional to do it.
That is a poll of the Press that tax reform has received on the airwaves and news reports or the typical Dem talking points that have been repeated for the last 50 Years over and over again! Witch is all same Fake BS with no economic reality!
LA times on 11/19 said: “A Quinnipiac Poll last week found that 52% of voters oppose the GOP plans; only 25% support them.”
Of course this is all irrelevant. The Republicans are not in the game to serve the citizenry. They are in the game to serve their constituents, which is the 1% and the large corporates (and their party, which is why the tax burden is being strongly adjusted to fall on the democratic states and away from the republican states, as well). With this plan, they will finally be delivering for those constituents. The rest of us get the shaft. “Democracy” at work!!
Like I said… nobody {Vast majority} understands Taxes… until it’s either felt in their paycheck or at the time their return is filed. How much their check went up or how much they got back as a refund or if they have to pay anything when return filed.
That is the extent even of some very smart and savvy people I know.
Unless your educated in public accounting… nobody understands it!
So the Poll taken before final details of the plan put into law… is absolutely meaningless… Just pure Fake!
The growth of fascism is only coming from the “leftists” who embody what it means to be hypocritical. Resisting plutocracy and oligarchy would make a lot more sense, and both political parties have had in creating the monster we are in now. I certainly share your disdain for policies that overtly confiscate wealth and distribute it to the 1%; taxes are theft.
I personally find the following Trump actions and behaviors plenty fascist:
– attacking and attempted to stifle a free press
– threatening violence against his political enemies
– use of overt racism, nativism and bigotry to mobilize his voters
– a utter lack of respect for facts and a willingness to grossly mislead to achieve political objectives
– an utter lack of respect for the norms and traditions of American democracy
– gross and continual violations of the constitutional law
– an attempt to stifle a free and independent judiciary
– ongoing attempts to influence others to violate constitutional law
– use the presidency to enrich himself, his family, and his close associates regardless of considerations of the nation and of the law
– solitary focus on corporate enrichment at the expense of consumer and environmental protections
I’m sure there are plenty of fascist leaning people on the left too. However, they don’t sit in the white house today.
You mean the biased and Dem bought and paid for Press? Nothing more fascist than that!
He has done or said NOTHing …overt racism, nativism and bigotry… That is the BS of my 1st statement above!
In fact to every one of your points… my 1st statement above applies!
Well there you have it, the two sides of America today, in a nutshell.
Oh, I forgot one (but it’s not really under the “fascist” label): he’s a traitor to the country as well. The country was overtly and egregiously attacked by Russia in the 2016 election. Trump refuses to acknowledge it, accept it, and act on it, despite proven evidence from the US’s own capable intelligence agencies. (Why? Because he was the beneficiary.) That’s treason, sir!!!!
1st of all that attack if it was anything more than what Russia has done for many years happened with Obama’s people in charge, why did they allow it to occur? That’s the question that should be asked!
But they don’t… They try to say only Trump collusion with the Russians… which is pure garbage and made up BS!
The Clintons {through their foundation} are the only people who Got Hundreds of Millions of Dollars from people tied to the Russian government.
That is a money trail the fascist media and Dems chose to ignore!
In every crime, you should follow the money! But since its the Clinton they all look the other way or chose not to investigate!
The primary reason it was “allowed to occur” is because it was executed through private corporation social media platforms, which are unregulated by both the government, and themselves (meaning, they will happily sell anything to anyone if they can get away with it without horrible press; there’s a fascinating opinion piece on exactly this in the NYTimes today by a former employee responsible for privacy controls back in the FB IPO time period). It was an extremely well executed “legal” social engineering attack right under our noses. Recent studies have shown how incredibly susceptible people are to propaganda (something the ad industry has known for a long time!). Enabling/allowing foreign parties to spread disinformation and propaganda through the US citizenry is extremely problematic for democracy. Our government MUST act to defend ourselves from this, by making is clearly illegal and putting all kinds of defenses and response mechanisms into place. Trump won’t accept the intelligence communities findings, nor the reports of the social media companies themselves, and furthermore accepts the nonsensical denials of the head of the foreign power responsible. Most significantly, he refuses to raise a finger to address it. Per Merriam-Webster: “legal Definition of treason: the offense of attempting to overthrow the government of one’s country or of assisting its enemies in war; specifically :the act of levying war against the United States or adhering to or giving aid and comfort to its enemies by one who owes it allegiance.” Russia subverted our election, and Trump knows it and won’t do anything about it. So, Trump’s behavior given the facts fits the definition quite well as I see it. He’s a traitor: he won’t take action against a foreign power who executed social engineering to subvert our democratic process, and who will do it again and again.
If you look at Trump’s energy plan and ask “what nation benefits the MOST from this?”, the answer is more than disturbing. An energy plan that is 100% about oil and gas is of HUUUUUGE benefit…to Russia, whose economy is HUUUUGELY based on oil and gas revenues. Shock and awe there, eh?
Thats pure BS…
Everything of the internet (News Headlines… just everything) and facebook & other… was 90%-95% Negative to Trump (During the campaign) ! Meaning 90 to 95% positive to Clinton!
I know… I am on the internet all day and night long as that is how I conduct my business. Every time I launched browser I had to read all those negative headlines… It was sickening!
What you state is the BS narrative the media, dems and Clinton are and have been spewing since election day!
You know how Trump won… He got 15 to 30 thousand people to come to his rally’s. He did on average 3 per day for most of his campaign and the last two weeks 5 per day!
Everyone who went to one and everyone who listen to all of them… In-filtered with media talking heads), Voted for Trump! That’s why he won!
Hillary could not get more than a couple of hundred… unless she also booked the A list in music stars!
There is good evidence that suggests that Russian Collusion was a fabrication og Podesta and the Clinton campaign to try an explain her inexplicable loss. What sealed the deal for me personally
was their prior contacts with Natalia Veselnitskya.
Apparently, we live in different realities. In mine, the US intelligence community has spoken, and is credible (Russia engaged in substantial social engineering to effect the 2017 election through social media). In mine, the social media companies have spoken, and are credible (in their admission of culpability in this; they said so in clear and definite terms to congress just a few weeks ago). In mine, the Russians have been forgiven by Trump despite the crystal clear and compelling evidence (just a week ago). In my reality, Trump is therefore a traitor. He is coddling an enemy state who did and will again attack our nation. Utter shame.
I highly recommend “On Tyranny”, a small pamplet style book relating the tyrannical actions of the WWII fascists to what is happening daily in the US today. Read it! Education can’t ever hurt, can it?
I am curious, and this is entirely non-political. Based on what you know about Clapper and Brennan, do you trust them?
Keep in mind that the ” 17 intelligence agencies” has been proven a completely false narrative.
BTW, the 17 intelligence agencies claim so widely repeated was retracted by NYT, hardly a bastion of Trump support.
All of a Sudden the Dems & their bought and paid for media groups are at war with the Russians!
For years (in 70’s, 80’s) they wanted to make Friends with them and surrender all our nuclear capability to them.
Until 2017… Make friends with Castro, and all the other corrupt leaders in South America & elsewhere!
Now all of a sudden… Russia… Russia… Russia… It’s like bad Brady Bunch episodes … Marsh… Marsh… Marsha…
The news reported that Cohn asked a room full of CEO’s how many would be increasing their investment after the tax theft plan passes. Only a very few raised their hands. Economists when asked “why?” had the clear and simple answer: those corporations already HAVE tons of cash, and/or access to very cheap credit. They aren’t investing NOW not because of lack of funds! It’s because of lack of market demand. The “trickle down” theory is nonsense in today’s conditions; giving the corporates yet more profits off the taxpayers back is pure giveaway, and will be used for share buybacks and larger bonuses and more cash hoarding. How could the government manipulate taxes to drive economic growth? Economists answer: cut the taxes on the middle class and poor: that will stimulate spending (and some savings, which is also good), and create increased demand that will in turn motivate the CEO’s to invest more of their massive piles of cash from profits already in their (often offshore) coffers.
CEO’s of what… Financial Services firms or Services firms in general???
They have nothing to invest in.
Ask CEO’s of Companies that make REAL THINGS?
Most likely both Joseph.
It was the Wall Street Journal CEO council. The list of members is available online. It’s a very, very diverse set of corporations/CEO’s, to my eyes.
Okay… so what now on VIX… any signs to get back in???
Perhaps when it gets back to 9, though this cycle perhaps it goes even lower? Meanwhile, XIV up over 2.5% today alone, and that on a flat market!! XIV is headed to 135 over the next few months, IMO.
Okay… I will buy it! XIV
Tight stops are in order. Another SPX inside day warrants some caution imho…
Yep. I am getting SVXY puts for free selling the 103/105 bull put credit spreads. Will exit 105 short puts when VIX reclaims 200 or SVXY gives reversal signal.
Not yet. Hang tight. Break of 200 day means a new 52 week low reset likely. A much better entry coming up. I am in on ANY move below 10,00
Aug-Oct rise in IYT has retraced exactly 61.8%, popped up a bit, and is now pulling back (still above the 61.8). I will be a buyer on a turn back to the upside with short term EMA’s crossing and 20 minute swing highs taken out.
The muted response to the ECB’s negative interest rate scheme introduced a few years back has led them to take the next logical step. They are now proposing doing away entirely with deposit guarantees. That means exactly what you think it does-an end to the concept of “demand deposit”. Simply put, they would no longer have to hand over YOUR money when you demand, and there would not be a thing you could do about it. American banks have been less brazen but no less confiscatory. Instead of negatvie rates, they sneakily went to “maintenance” fees, even for large business accounts. It is outright theft. I took every penny out of a bank I had dealt with many years after that stunt. They claimed the charges over several months was “a mistake” when I told them why I quietly departed. A mistake indeed.
I’ve often thought of moving my savings account to my home safe. No fees!
Do it!
Even better get a storage unit and keep it quiet…
That’s a good idea. Fire proof safes are readily available at hardware stores.
Actually, that makes me think about the velocity of money. We’re probably not the only folk to have this idea in an environment of low (here in NZ) and negative (in Europe) interest rates.
If lots of people are holding cash then that cash isn’t flowing. Less $$ flowing = less economic activity as the $$ are harder to come by. And that’s most definitely NOT good for our economies!
Hiya Guys! I was just enjoying a tasty cawot!
I bet you all thought I was “busy” now didn’t cha??!
We did wabbit, we know how dodgy those bunnies can be!
where is the king rabbit!
He is most likely playing with the bunnies.
Speedy!!