
A new high above 2,539, within the second hour of trading today, indicated the alternate hourly Elliott wave count was more likely correct and price should continue overall higher, which is what happened for the rest of the session.
Summary: The first target is again at 2,614. A second target is at 2,773.
A second wave correction to come may possibly offer a good entry point to join the upwards trend, but be aware although it is likely to be deep it does not have to be.
Always trade with stops and invest only 1-5% of equity on any one trade.
Last monthly and weekly charts are here. Last historic analysis video is here.
MAIN ELLIOTT WAVE COUNT
WEEKLY CHART
Click chart to enlarge.
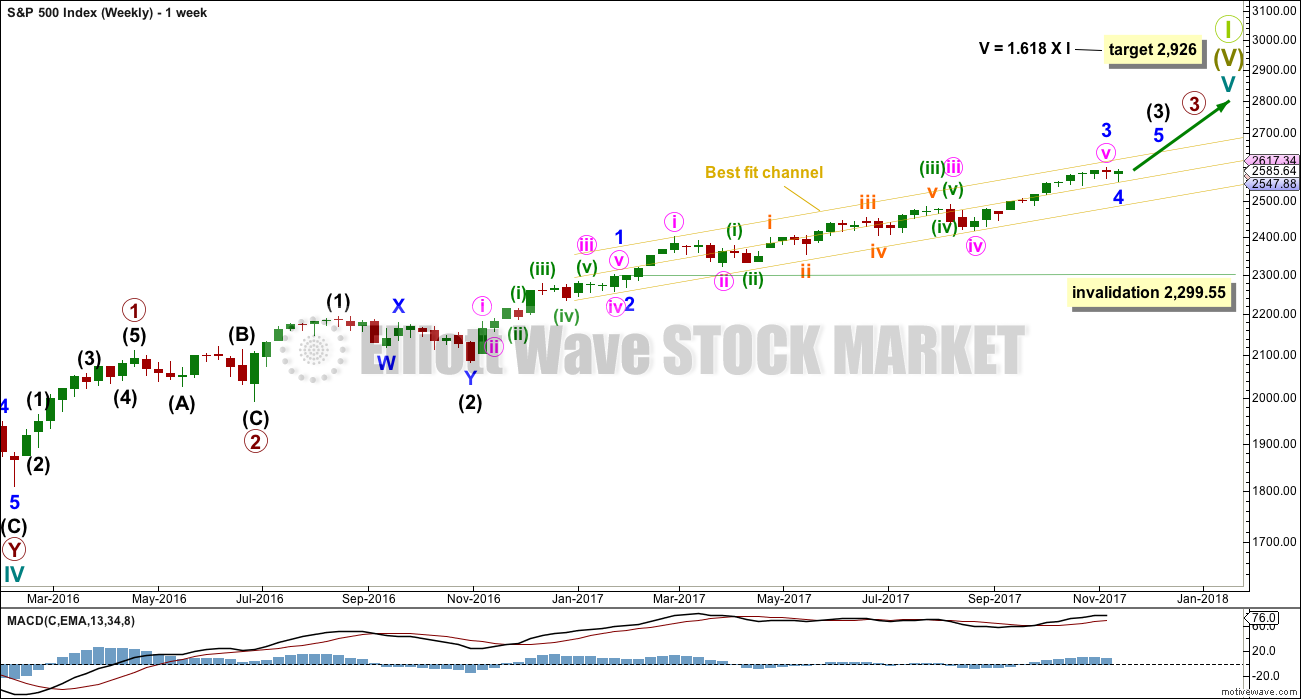
Cycle wave V must complete as a five structure, which should look clear at the weekly chart level. It may only be an impulse or ending diagonal. At this stage, it is clear it is an impulse.
Within cycle wave V, the corrections for primary wave 2 and intermediate wave (2) both show up clearly, both lasting several weeks. The respective corrections for intermediate wave (4) and primary wave 4 should also last several weeks for the wave count to have the right look at the weekly and monthly time frames, so that they show up at weekly and monthly time frames.
Cycle wave V has passed equality in length with cycle wave I, which would be the most common Fibonacci ratio for it to have exhibited. The next most common Fibonacci ratio would be 1.618 the length of cycle wave I.
Intermediate wave (3) looks incomplete. It may only subdivide as an impulse. Within intermediate wave (3), minor wave 4 may now be complete. If it continues further as per the alternate wave count below, then it may not move into minor wave 1 price territory below 2,299.55. However, minor wave 4 should remain contained within the yellow best fit channel if this wave count is correct.
DAILY CHART
Click chart to enlarge.
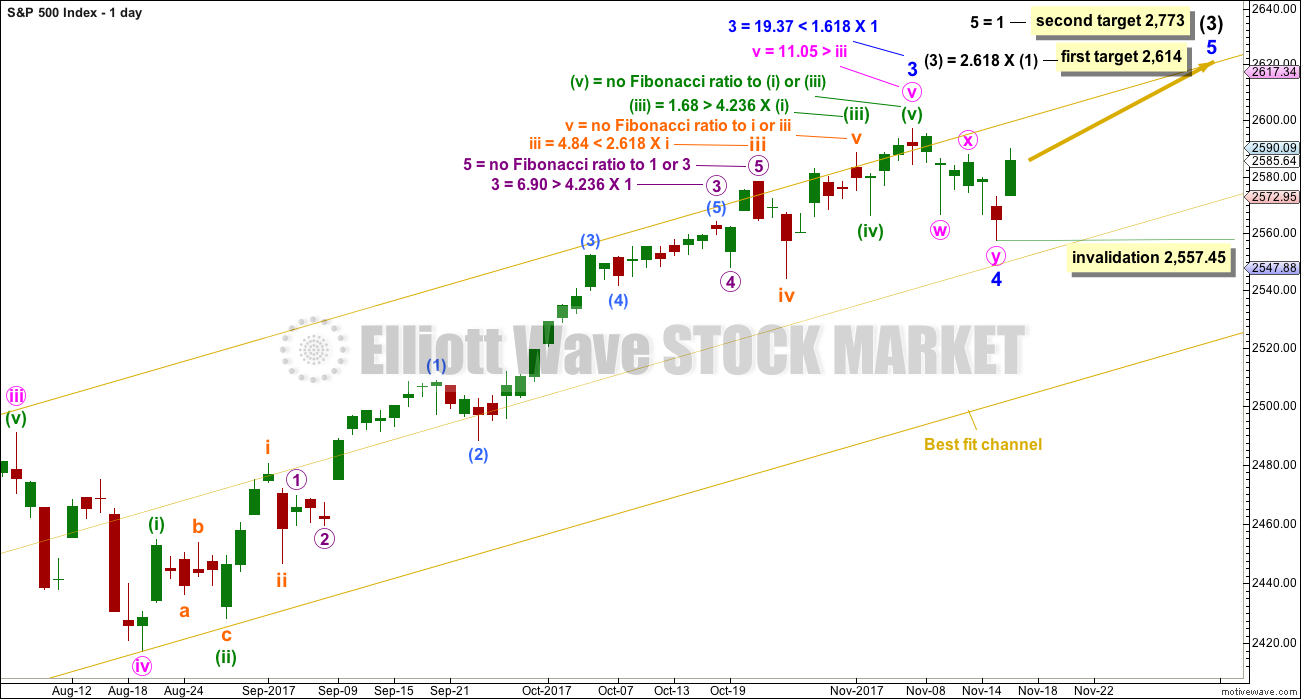
Minor wave 4 may now be complete. It will subdivide very well as a double zigzag. This provides a little alternation in structure with the single zigzag of minor wave 2. There is also poor alternation in depth: minor wave 2 was very shallow at only 0.16 of minor wave 1, and minor wave 4 would be only 0.12 of minor wave 3. Alternation is a guideline and not a rule; it is seen more often than not, but not always. This is one reason why this wave count had to be judged to be an alternate until price has shown today it may be more likely.
The first target at 2,614 would see a Fibonacci ratio between intermediate waves (3) and (1), but no Fibonacci ratio for minor wave 5. This would be acceptable. There is already a somewhat reasonable Fibonacci ratio between the two actionary waves of minor waves 3 and 1, so minor wave 5 may not exhibit a Fibonacci ratio to either of minor waves 3 or 1.
The second target calculated for minor wave 5 expects it to exhibit the most common Fibonacci ratio for a fifth wave. This target would not expect a Fibonacci ratio for intermediate wave (3) to intermediate wave (1).
If price gets up to the first target, and the structure may be complete and there is some divergence with price and Stochastics or RSI, then members are warned that it would be possible for a high to be in place for the mid term. But if price keeps rising through the first target, then the second target would be used.
Within minor wave 5, no second wave correction may move beyond the start of its first wave below 2,557.45.
HOURLY CHART
Click chart to enlarge.
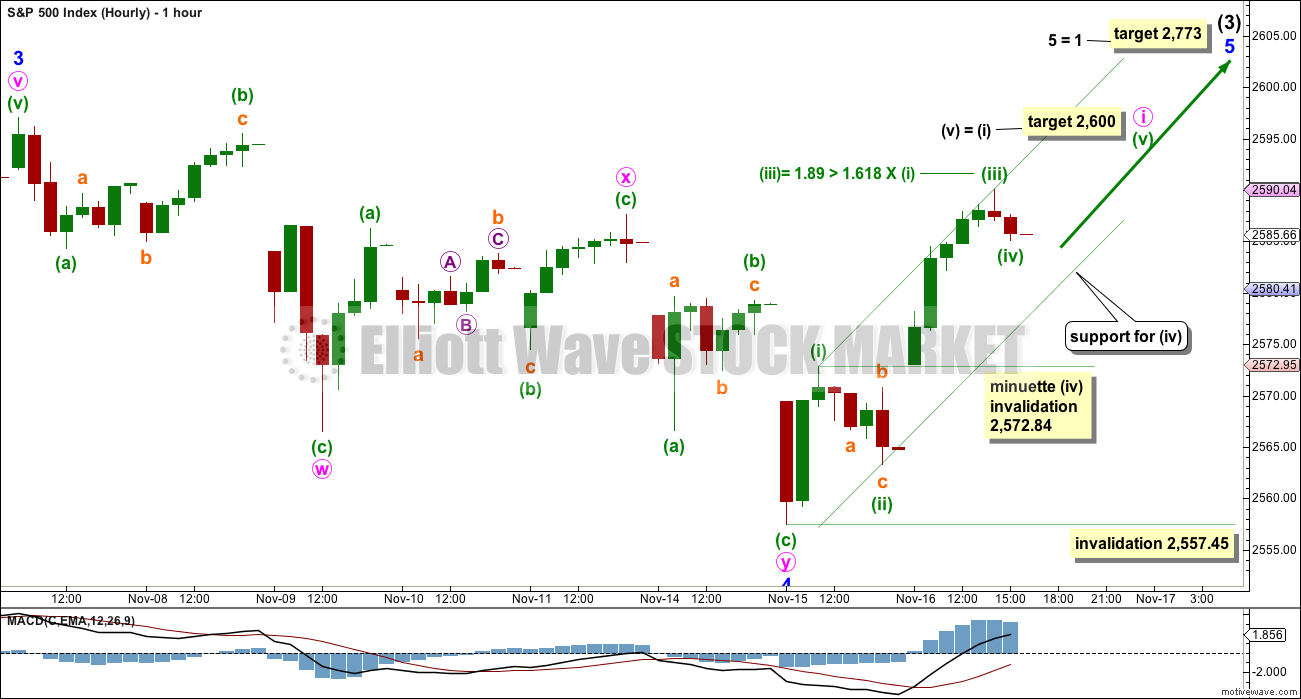
If a low is in place, then a five up on the hourly chart should develop. This is not yet complete.
Within the first five up, minuette wave (iv) may not move into minuette wave (i) price territory. When a new high is seen above today’s high, then a five up could be complete at any time.
Price should remain within the green Elliott channel while minute wave i continues higher. A breach of this channel by downwards movement would be an indication that upwards movement at this time frame should be over and a new wave down should be underway.
Minute wave ii may be relatively shallow and brief; although this is not common, members are warned that it has happened before: corrections in the beginning were brief and shallow at the start of minor wave 3.
Minute wave ii may be a more common deep second wave correction. The 0.618 Fibonacci ratio of minute wave i would be the preferred target.
Minute wave ii may not move beyond the start of minute wave i below 2,557.45.
ALTERNATE HOURLY CHART
Click chart to enlarge.
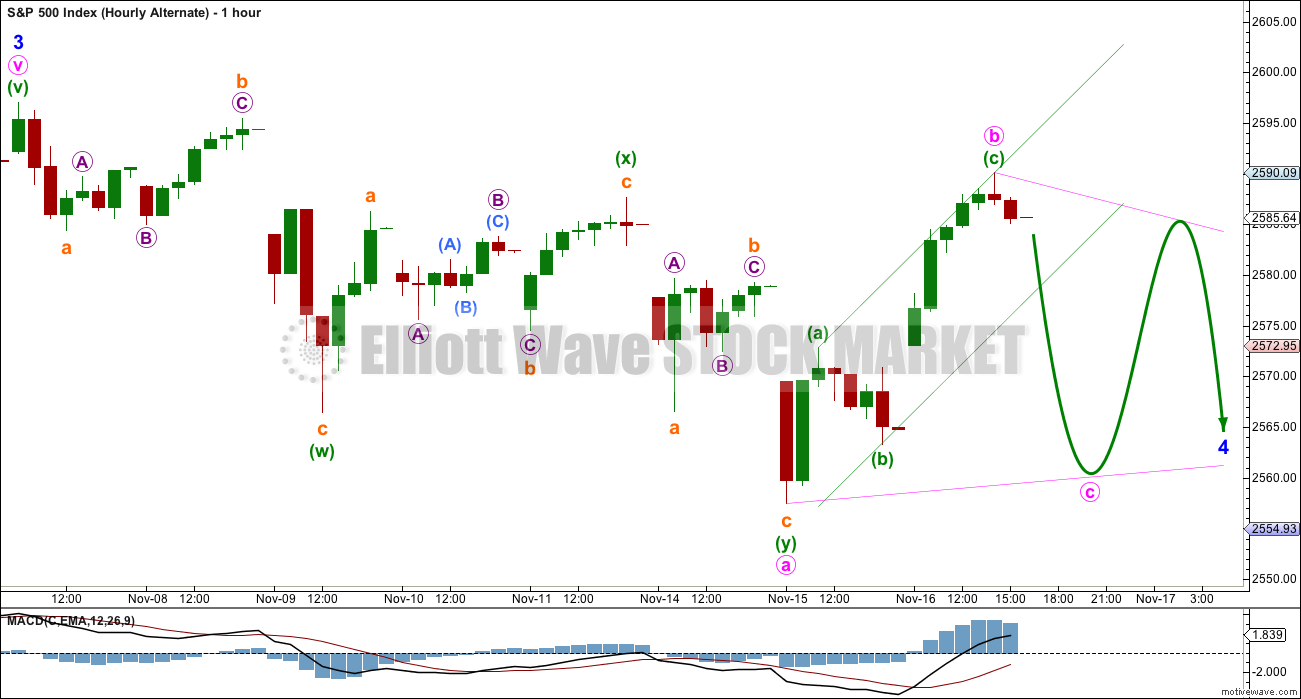
By simply moving the degree of labelling within minor wave 4 down one degree, it is possible to see that it may not be over and may continue sideways for a few days yet as a triangle or flat correction.
Here, minor wave 4 is labelled as a possible triangle. This looks at this stage to be the most likely alternate scenario.
Within a possible triangle, the first sub-wave of minute wave a fits best as a double zigzag. If this labelling is correct, then all remaining triangle sub-waves must be simple A-B-C corrections, and all but one must be single zigzags.
Minute wave b within the possible triangle would have to be complete here. It cannot move higher as a double zigzag because only one triangle sub-wave may be a more complicated multiple.
Minute wave c may not move beyond the end of minute wave a below 2,557.46.
Minute wave d to follow upwards may not move beyond the end of minute wave b above 2,590.09.
Minute wave e downwards to end the triangle may not move beyond the end of minute wave c.
The triangle may take another six days minimum to complete, if it totals a Fibonacci thirteen days.
What about a possible flat correction for minor wave 4?
This is the other possibility, but it looks less likely at this stage. Within a flat, both minute waves a and b must be three wave structures. Minute wave a can be any structure except a triangle, but A waves within flats are most commonly zigzags. The next most common structure for them would be a flat correction. They are uncommonly double zigzags.
Minute wave b within a flat correction would have to move higher as a double zigzag to reach the minimum requirement of 0.9 the length of minute wave a at 2,593.06. The most common length for minute wave b would be from 1 to 1.38 times the length of minute wave a, giving a range of 2,597.02 to 2,612.06.
While it is possible for both minute waves a and b to be double zigzags, it is not a common occurrence, and for that reason it is not charted today.
What about a possible double combination for minor wave 4?
If the downwards wave labelled here minute wave a is correctly labelled as a double zigzag, then a combination continuing sideways for minor wave 4 may be eliminated. The maximum number of corrective structures within a multiple is three: this refers to W, Y and Z. Within each of W, Y and Z, the structures may only be labelled as simple A-B-C corrections (or A-B-C-D-E in the case of triangles). To label multiples within multiples is to increase the number of corrective structures beyond three, violating the Elliott wave rule.
TECHNICAL ANALYSIS
WEEKLY CHART
Click chart to enlarge. Chart courtesy of StockCharts.com.
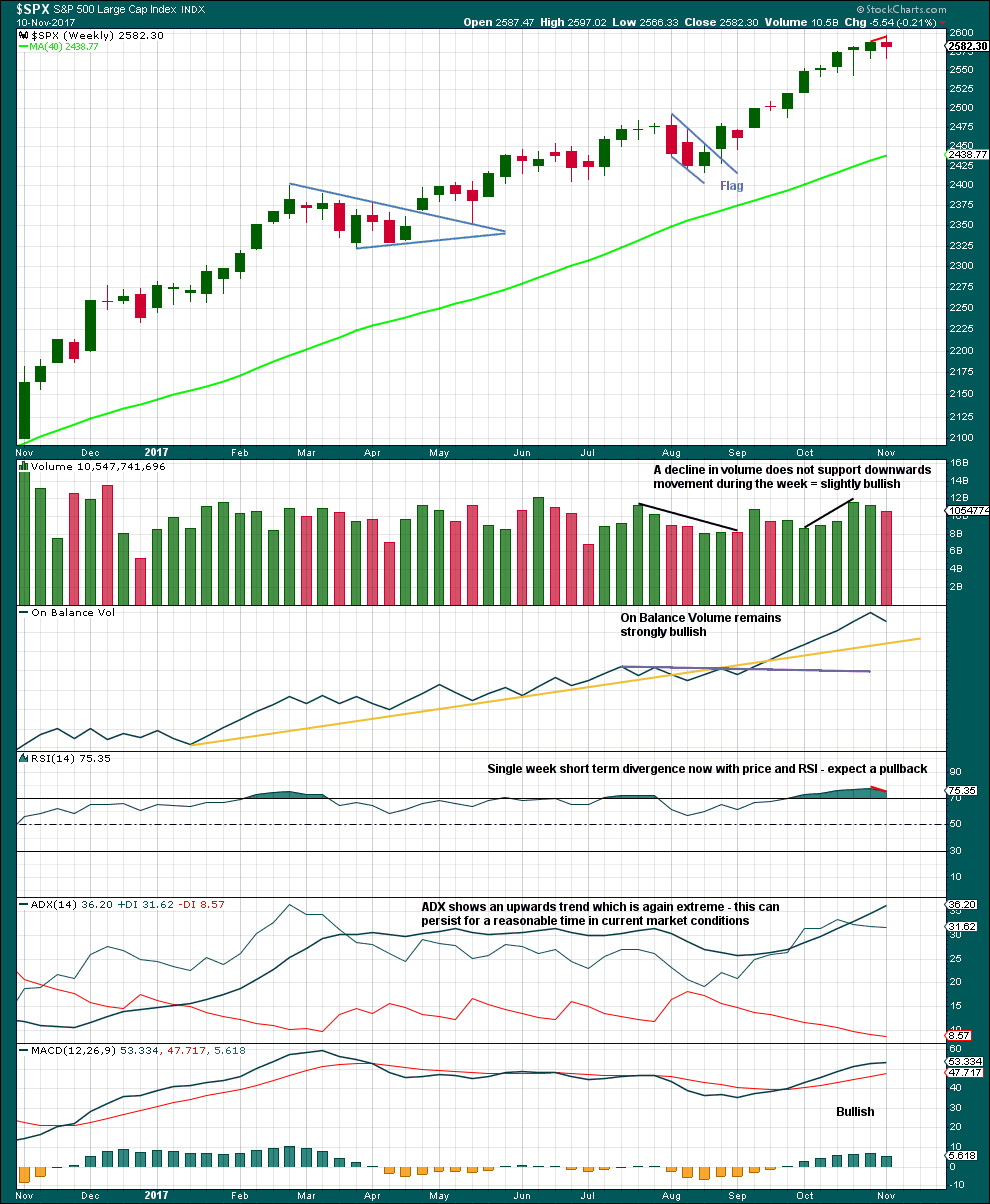
Last week moves price higher with a higher high and a higher low, but the candlestick closed red and the balance of volume was down. Volume did not support downwards movement during the week; this is slightly bullish, but it would be better to look inside the week at daily volume to make a clearer judgement.
With ADX now extreme and RSI exhibiting divergence while overbought, some pullback to resolve this seems a reasonable expectation.
The overall trend does remain up though, so pullbacks are still an opportunity to join the trend.
DAILY CHART
Click chart to enlarge. Chart courtesy of StockCharts.com.
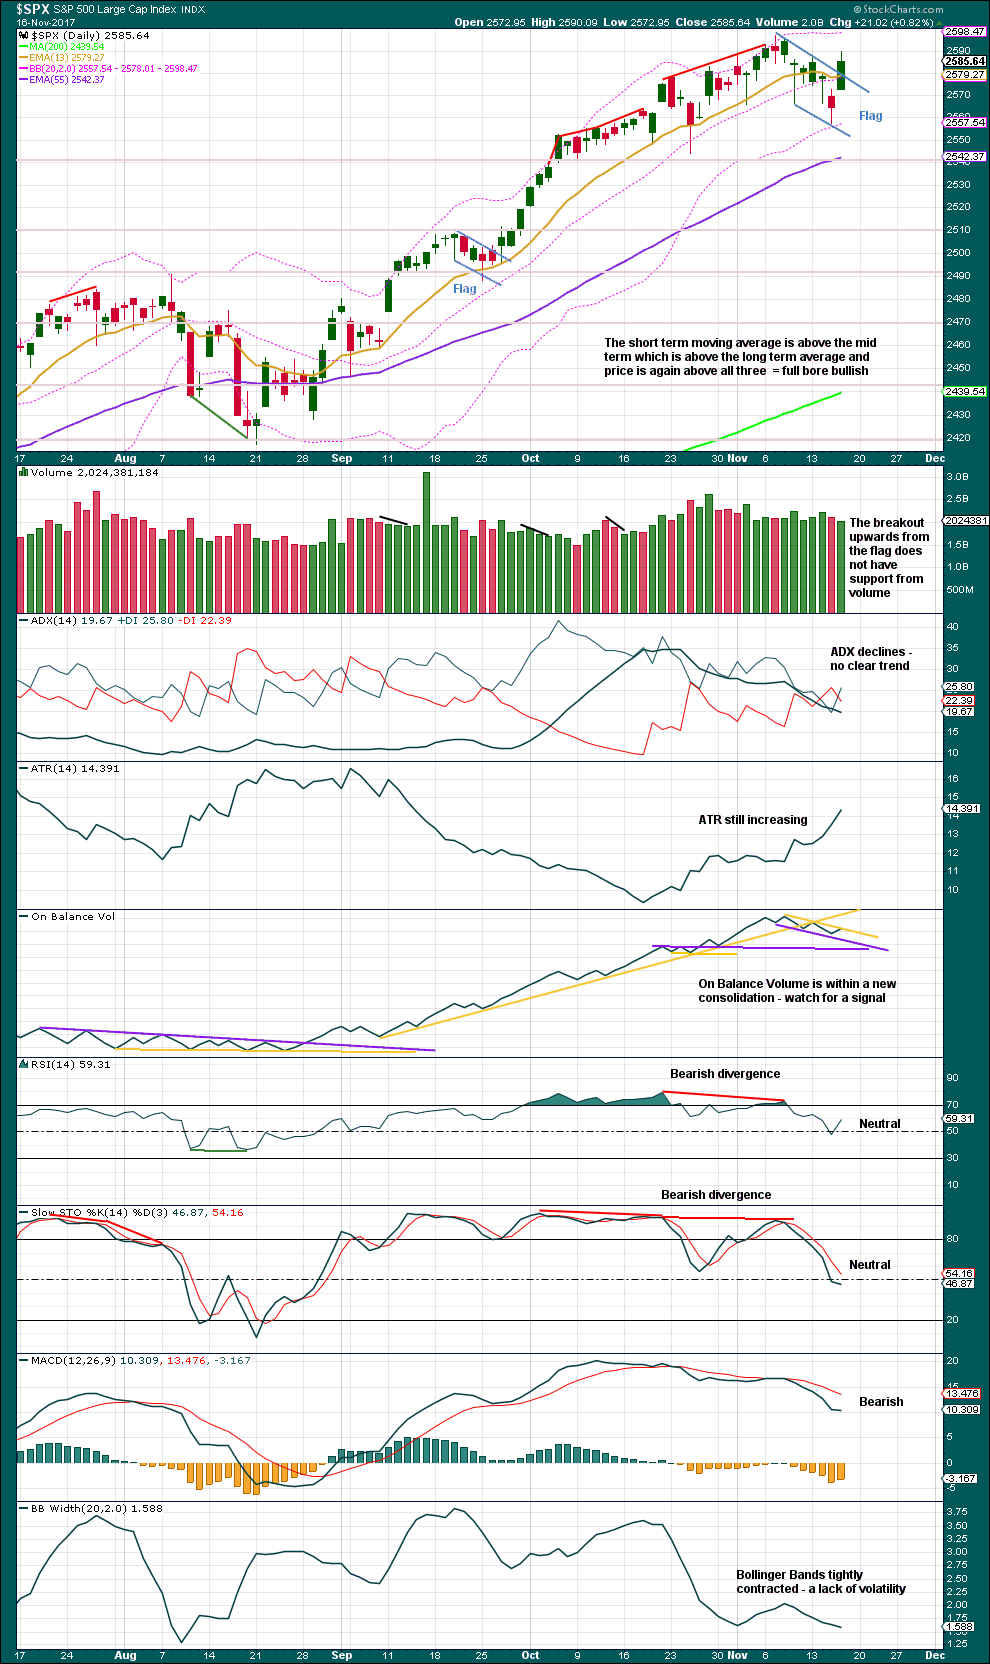
It now looks like a small flag pattern may be complete. These are reliable continuation patterns. If the beginning of the flag pole is taken as the low for the 25th of October (which looks about right), then a target using the measured rule is about 2,630, if the breakout comes about 2,577.
The upwards breakout today does not have support from volume, so it should be approached with some suspicion. However, it is noted that there are recent examples on this chart where price has risen with light and declining volume. This market appears to be able to drift slowly higher on weak volume. That may certainly happen again here.
VOLATILITY – INVERTED VIX CHART
Click chart to enlarge. Chart courtesy of StockCharts.com.
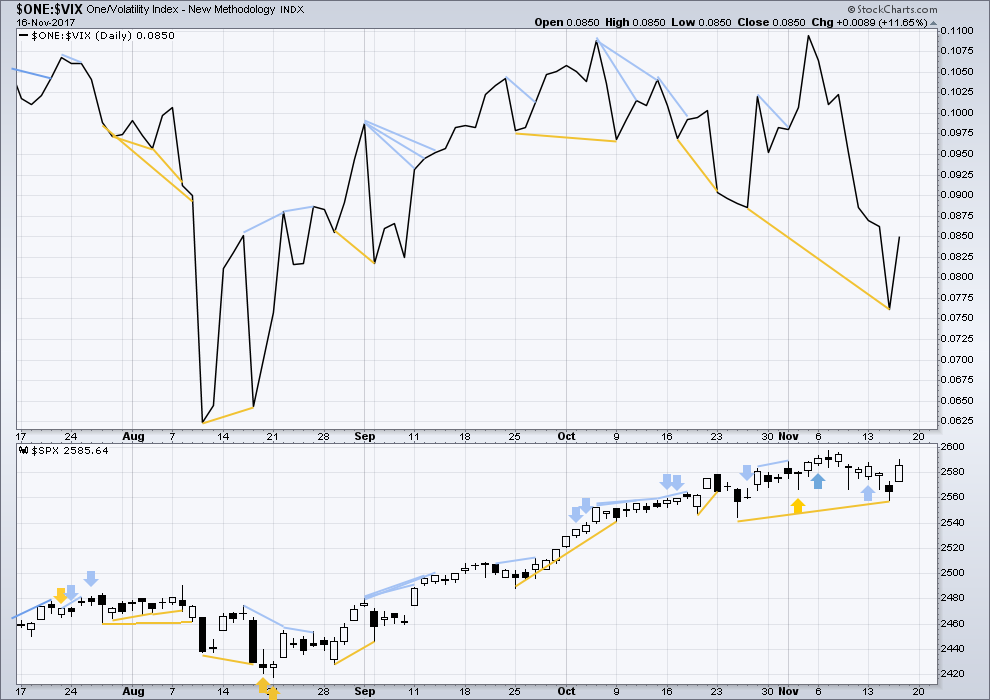
Normally, volatility should decline as price moves higher and increase as price moves lower. This means that normally inverted VIX should move in the same direction as price.
Mid term bullish divergence noted yesterday has now been followed by an upwards day. It may be resolved here, or it may need another upwards day to resolve it.
BREADTH – AD LINE
Click chart to enlarge. Chart courtesy of StockCharts.com.
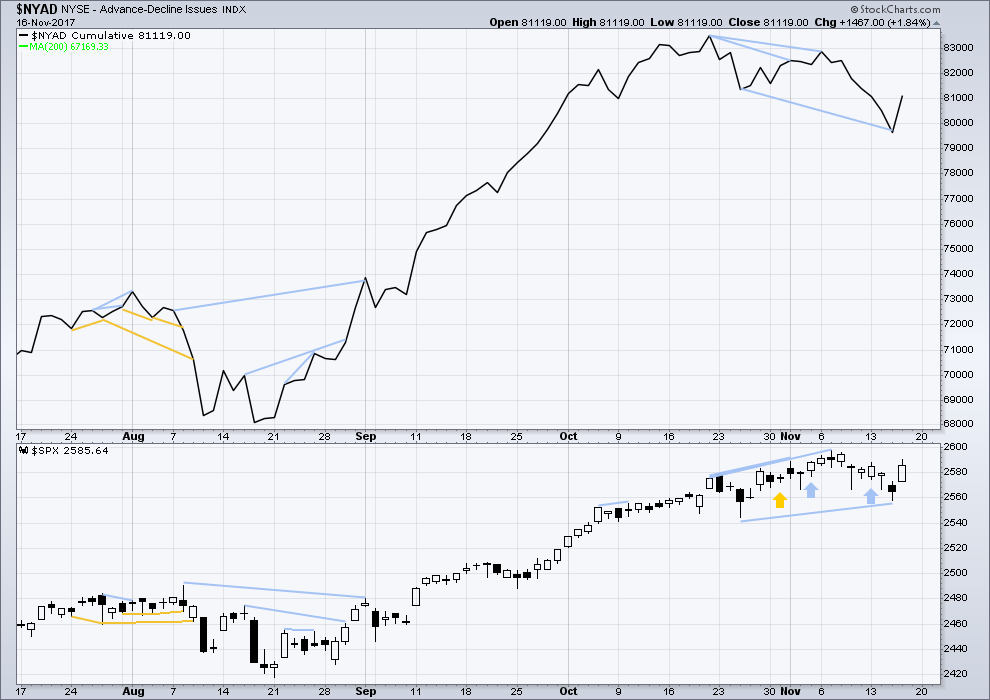
There is normally 4-6 months divergence between price and market breadth prior to a full fledged bear market. This has been so for all major bear markets within the last 90 odd years. With no longer term divergence yet at this point, any decline in price should be expected to be a pullback within an ongoing bull market and not necessarily the start of a bear market.
Small caps have moved strongly lower last week and mid caps have moved somewhat lower. This market continues to show some short term weakness in support of the new main hourly Elliott wave count.
Bearishness noted in last analysis by the AD line has not been followed by downward movement for price.
Upwards movement today has support from rising market breadth. This is bullish.
DOW THEORY
At the end of last week, DJT has still failed to make a new all time high. The S&P500, DJIA and Nasdaq have made new all time highs. DJT has failed so far to confirm an ongoing bull market.
Failure to confirm an ongoing bull market should absolutely not be read as the end of a bull market. For that, Dow Theory would have to confirm new lows.
The following lows need to be exceeded for Dow Theory to confirm the end of the bull market and a change to a bear market:
DJIA: 17,883.56.
DJT: 7,029.41.
S&P500: 2,083.79.
Nasdaq: 5,034.41.
Charts showing each prior major swing low used for Dow Theory are here.
Published @ 05:55 p.m. EST.
A very nice bullish signal today from the AD line rising. I have some confidence in the main wave count.
Anyone else paying attention to the computer chess championship (with all opening books removed from all engines, very interesting!) on chess.com, then starting tomorrow the world championship (Carlsson of Sweden is the title holder)? I’m definitely into it. I play one of the computer players (Shredder) a lot, though only at vastly reduced strength (I would have zero chance against shredder at full strength!).
An interesting discussion below on taxes and tax rates. Something I’m really curious about as it impacts me greatly. NZ’s tax rate isn’t very low and TBH it does my head in. Still, compared internationally our tax rates aren’t too high either. I just hate paying this much tax 🙁
NZ is an interesting example of what happens to an economy which is quickly opened up to globalisation. And which had tax rates generally lowered since 1984.
The theory, which I see is the one Joseph is using, is that reducing taxes, tariffs, and regulations for business will provide conditions for business to thrive. That their profits will then trickle down to the middle and working classes.
Well, it most certainly did not happen in NZ to the degree expected.
But then I’m not sure that NZ and the USA is comparing apples to apples. We are quite different, and one helluva lot smaller!
It worked when Kennedy did it in the 1960’s and it worked in the 1980’s when Reagan did it.
It’s more than just Taxes though, a whole variety of things need to be implemented all within a two year period for it to work. Some parts without the other mutes the growth. This is what tends to happen because the politician’s (mostly Lawyers) can’t do anything right.
Minuette (iv) has broken below the channel drawn using Elliott’s first technique. Redraw the channel using his second technique now: from (ii) to (iv), a copy on (iii).
Minuette (v) may end within this channel.
As minuette (iv) has moved a little lower today the target for minuette (v) to reach equality with minuette (i) must also move correspondingly lower.
While price remains above 2,572.84 it looks like a five up is developing.
This may be another entry opportunity to go long here. Properly, stops should be just below 2,557.45 for a longer term buy and hold. For a short term scalp of minuette (v) they can be just below 2,572.84.
For a longer term buy and hold be prepared to hold an underwater position if minute ii is deep and more time consuming, which is entirely possible. But an entry here would be good if minute ii is quick and shallow, which is also possible as the S&P has done this before.
TICK!!!!!!!!
Inverted Cup and Handle Pattern in $DJI and SPX! 20 Min. Chart 2 days
I see things…. What things? … Things … many things!
Please put me away and throw away the key!
Give me until this afternoon and I’ll join you in the vision quest! Mine though will be all about putting pool balls into the corner left pocket (yea, I’m a big one pocket player, the greatest physical game of strategy and tactics in the world!). Supported by appropriate mental lubrication and positive attitude adjustment of course.
LOL
mental lubrication 🙂
I’m off to a wedding later today. I think I’ll have some mental lubrication as well.
I used to try and play pool. But Cesar keeps winning. Every. Single. Time. It really isn’t good for the confidence. I stopped enjoying it.
I told him that maybe he could just quietly let me win very occasionally…. but that’s just not in his nature. He’s too darned straight up and honest to be that manipulative.
Secretly go take a few lessons from a pro. It’s all about the basic mechanics; once you have that, you’ll give him a real game! And he’ll love you even more for it (after he finishes steaming a little!).
Have a great party and good weekend. Everything in the market is proceeding as you have foreseen!!
I love that idea! Secretly taking lessons from a master poolster and then when he leasts expects it: WHACK!! hyuk! 🙂
This is a situation where the EW count enables me to range trade with confidence. It’s a go nowhere watch the paint dry slightly down day. But I’m scoring by simply “buying low/selling high” (about 3x now) in XIV. The EW count is key: it’s a backstop that tells me if I look away and suddenly SPX has dropped and XIV has gone from 110 to 107…it’s fine. I can just wait for a relative low (bottom area of this presumed 4 continuing if that happens), optionally double or triple down, and let the eventual 5 wave up take care of business. Without the backing of the EW count, I’d be much less comfortable with each successive buy. It’s a bit different tactical way of thinking about and taking advantage of our count knowledge from the norm of “trading the 3 wave up”, etc.
Buying back UVXY short calls of bear spread entered on anticipation of VIX retest of 200 dmsa..
I on the other hand am back in XIV and a bit of a push up in SPX right about now to drive VIX down and XIV up a tad would suit me fine!! Still suspicious price is going to drop today to 2573.5 but have to trade what is, not what I suspect. The 38% retrace has been holding for a few hours, so my confidence in a 2 finishing and turning up into a 3 here is growing a bit. My XIV stop is BE tight however! I refuse to ride XIV down if this turns into a big triange continuation of the minor 4.
We probably are seeing a coordinated attack on a trader with a massive long vol trade that wraps up this vweek.
We have now reached new levels of market insanity, in which traders INCREASE exposure risk in the face of declining prices.
How will they unwind?!
Prices are not declining (well, except in the very short term). We aren’t the only ones who know EW, and the whole world expects conclusion of a massive corporate windfall in a few days thanks to the US lower and middle income taxpayers. (Did you see we’ll be paying to reduce the costs of the use of private jets by the extremely well to do? The kleptocratic pigs are really at the tax trough now!!). The VIX is inverted today because of the discounting of the likely bull run coming over the next 30 days. IMO. It’s a significant bullish signal, as I see it. That all said, I’m still waiting for this pullback to play out, as I’m suspicious that it’s only 1/2 way done for the day…even as I watch XIV, my target play here, creep up.
Oh my, shouting matches in senate finance committee this morning, after analysis has shown that EVERYONE with income under $75k gets TAX INCREASES by 2027! Oops!!! Yet Orin Hatch persists that this is NOT a giveaway to the rich! Hilarious. I suspect Orin wants to use private jets after retirement, too. It’s for this kind of reason I’m a bit cautious here for the next few days at least. Until closure, I just cannot see SPX taking off to the upside in any significant way. Could be wrong!!
Also this morning, Mnuchin the Head Kleptocrat bragging about how the stock market is going to soar. I believe he is correct! However, as “justification” for the theft of trillions from Americans, it’s pathetic.
That’s a Dumb ass argument. To fit the senate reconciliation rules to pass this with a simple majority they set rate benefit to expire in 10 years 2027.
When Reps have more than 60 Senators to pass something or if Dems would do what is good for the country… a new bill down the road will be passed to make all permanent!
It always amusing when the counter argument starts with “the current facts don’t matter, new ones will emerge in the future”. Is that what they call “alternative facts”, as well?
You are correct they are doing this to assure they can pass it with a simple majority. Digging deeper, the reason it’s necessary to enable THAT is because with out, deficits balloon way beyond the “limit”. So easy, just say that for SOME (the lower and middle classes), the tax cuts expire. But note who they DON’T expire for: the corporates, and the extremely rich. Rather revealing, that.
FACT: To pass something in the Senate as a simple majority vote, budget reconciliation is used. To fit the budget rules for pay fors… you set things to expire in 10 years!
That is a fact!
To get the Corps to come back & build and create jobs in the USA you make the 20% Rate and change to territiorial tax system for them permanent. NOTE: 100% expensing for them is due to expire in 5 years…
All will be made permanent or extended down the road for all. Why? because that is what they have been doing for the last 20 years for other Bills passed using the senate rules for reconciliation!
I see the logic there Joseph.
But there is an unacknowledged assumption, and it is this:
A lower tax rate will attract corporations to invest more, and the profits they make will then trickle down to the middle and working class folks.
But that’s not the only thing they can do with their profits. They can hoard $$ in offshore tax havens, they can pay people in their upper tier more. Probably other scenarios too.
Expecting that large corporations would be attracted to a 20% tax rate enough to shift major offices (and so jobs) from overseas tax havens to then pay 20%… would probably mean they pay more tax still. So if that’s right, it’s not probably gonna happen.
I like to take an evidence based approach to questions like this.
Are there some examples of countries where taxes for highest income earners and corporations have been reduced to 20% from (whatever the rate is currently in the USA) and what happened?
Compare apples with apples though, so the examples to look to would have to also be ones with equivalent rates of corruption and equivalent conditions for employment. Because IMO those are two factors that play a huge role in the ability of business to develop and thrive.
And actually, Singapore may possibly be an example you might think of. Alan Tham is a member at EWG, he’s in Singapore and very knowledgeable. But from what I know of Singapore it’s a highly managed economy, which is diametrically opposite to the USA. So that’s not an apple.
A whole package of things need to be implemented. It’s not just taxes.
You can put everything into on Bill. The Tax bill is only one part of the program.
The lowering of corporate taxes started big time in the 1980’s with the Reagan tax cuts, then we had Bush tax cuts in the early 1990’s, then we had W Bush tax cuts in the early 2000’s. And EACH time, what followed was (1) a stimulated economy ala increased earnings (but not necessary REAL economic growth), (2) a increase in the RATE OF GROWTH of the wealth gap between the top 1% and everyone else, (3) generally falling wages and rising cost of living for the bottom 80%, and massive increases in income for the top 1%. Followed in EVERY case by a major recession. Having been in business for 35 years (Big Corp and little companies), I can say definitely: no executive looks at a gift horse of cash and says “I’m going to pay my workers more!”. Never, ever, ever. That cash is either stored away, or used to buy back shares, and ALWAYS used to some degree to pad the earnings which drives (ta-da!) pay increases and LARGER BONUSES for the top brass. That is exactly what this tax cut is going to do. It’s massive give away to the rich, by the rich (who run the US), for the rich (who will benefit massively, on the backs of the common people). It is driven solely by our political environment in which Money is Speech and unlimited in politics, so those with the Most Money Rule. That would be the 1% and the large corporates (who are LEGALLY PEOPLE in the US, riddle me that batman!). That’s the system I see. I could be wrong!!
We had real substantial economic growth in the 1980’s and everything done in the 1980’s laid the foundation for the 1990’s as well.
We had some QTRS around 7%…
It’s worth noting the both Reagan and GH Bush both RAISED taxes again after their tax cuts exploded the deficit… remember the ‘read my lips’ speech?
This is a different animal.
When Obama tried to pass an infrastructure bill to stimulate the economy in 2009 (when we really needed stimulation) there was a outcry about adding to the deficit: ‘we don’t want our grandchildren to pay for this’.
Now, no Republican seems to care.
Now, no Republican DARE vote against it, because they lose their corporate and fat cat funding. It’s a totally different political landscape re: pragmatics of election and who the real constituents are, post the 2011 Citizens United total corruption of democracy decision.
Really? OK, If you say so… 🙂
I don’t say so Verne! I’m just reiterating the core message of Lara’s analysis: bullish! Very! After this minor 4 finishes, UP. We all work with that as we see fit. I lean on it fairly hard myself.
Plain and simple taxes are theft, whether personal or corporate!
What VIX is doing today implies a FREAKISH amount of near term call buying. I don’t believe it…!
I am done trying to play this VIX animal to include UVXY! Highly manipulated both are!
I am holding ALL positions…this ends only ONE way…
DO you see this in VIX and UVXY right now???????????
Makes not FKing sense!
Insanity. So what’s new? 🙂
Mild short term divergences between VIX and VIX derivatives and SPX action are not uncommon at all. Over the slightly bigger picture, there is no question but that the SPX market action will drive the VIX and derivatives “appropriately”. As Lara points out in every report every day, such a short term divergence may be a leading indicator. VIX only discounts 30 days out (the strip of option prices used to calculate VIX is only for options expiring within 30 days). So there is some discounting of the future…but not lots. This very mild divergence is indicating is that Lara’s bullish wave count is correct. IMO.
NOT what is going on today my friend. This is a whole new level of weirdness…..
Very VERY strange…NOT GOOD! 🙁
Anybody trading NAIL? Sick upside action since the election (27 to 76!), and just since the start of Oct it’s gone from 50 to 76. I guess hurricanes and fires are awfully good for the construction business! It’s at a relative high at the moment but was a good buy at the open today (I missed it). Monstrous upside action. I view such as providing me, the short term trader, a tremendous edge.
VIX 200DMA which today is at 11.15
Low today 11.17
That is close enough…!
What index do you see an Island Reversal?
Also, I see a cup and handle pattern in VIX forming and almost complete on the daily for a one month duration. Just need a move above 14.51 & acceleration higher when that occurs… to confirm.
Island reversal. Why on earth is VIX red? I have never ever seen anything like this…!!!
Those who sell options “know” the market will soon be going up? Discounting of the short term (30 day) future? Only explanation I see. I bailed on XIV and watched it rise as the market has fallen, so I’m with ya! It’ll all get straightened out soon enough. More down coming at the moment!
I’m managing my positions today under the assumption price will continue as per the alternate, until/unless price gives more wave 5 confirming signals. I believe many days to a few weeks of continued tax plan work in committee will result in continuation of the minor 4, with no minor 5 initiating until “done”. It’s a subtle shift in mindset that does change how I manage a position or two. I think caution here is the best stance.
Interesting. Thanks for your thoughts. I’m watching the lower channel line for the move up from 2557 to 2590. It needs to provide support for a continued move up.
2573.5 is the 61.8% retrace fibo for the upmove from Nov 15, and just below is the high of the initial 1 push up at 2572.7. Price turns there, perhaps still in the main. Through it and the matter is decided. At the moment the 38.6% is holding though.
On VIX looks like it does want to get closer to the 200DMA which today is at 11.15
I don’t understand why the markets are down and the VIX is down.
May just show how hugely complacent investors continue to be.
Bounced off of 11.26
This divergence is I think important.
This is how I’d think it through:
Normally as price falls volatility should rise. VIX should be a measure of that volatility. Theoretically.
But here today price falls and VIX also declines. The fall in price does not come with a normal corresponding rise in volatility, and so there is some weakness in price.
I’d read this as bullish for price.
And this is the conventional view point. But you’ll note that after a year of subscribing to Lowrys now I’m reading the AD line differently from this conventional view. I’m reading that as a leading indicator.
Number uno … 🙂
Er… Hey Doc, yer in my space…please make way for king wabbit…!