
Price has moved slightly higher, to complete an outside day, and remains within the invalidation point for the new main Elliott wave count.
Summary: The target for a multi day pullback is now about 2,539. Today, this is supported by bearish divergence with price and the AD line, price and inverted VIX, and On Balance Volume at resistance.
Pullbacks and consolidations at their conclusions offer opportunities to join the upwards trend.
Always trade with stops and invest only 1-5% of equity on any one trade.
Last monthly and weekly charts are here. Last historic analysis video is here.
MAIN ELLIOTT WAVE COUNT
WEEKLY CHART
Click chart to enlarge.
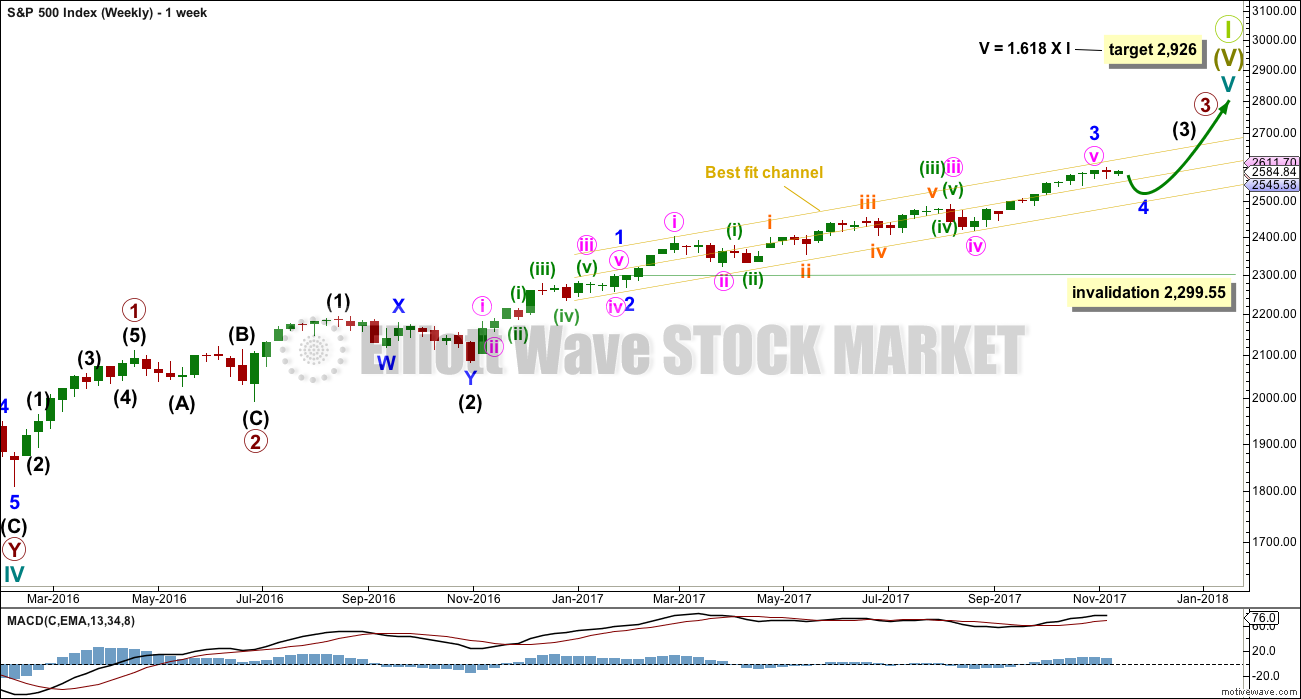
This wave count has strong support from very bullish On Balance Volume at the weekly chart level. While classic analysis is still very bullish for the short term, there will be corrections along the way up. Indicators are extreme and there is considerable risk to the downside still.
As a Grand Super Cycle wave comes to an end, weakness may develop and persist for very long periods of time (up to three years is warned as possible by Lowry’s for the end of a bull market), so weakness in volume may be viewed in that larger context.
Minor wave 4 should find support about the lower edge of the best fit channel. Minor wave 4 may not move into minor wave 1 price territory below 2,299.55.
The next reasonable correction should be for intermediate wave (4). When it arrives, it should last over two months in duration. The correction may be relatively shallow, a choppy overlapping consolidation, at the weekly chart level.
DAILY CHART
Click chart to enlarge.
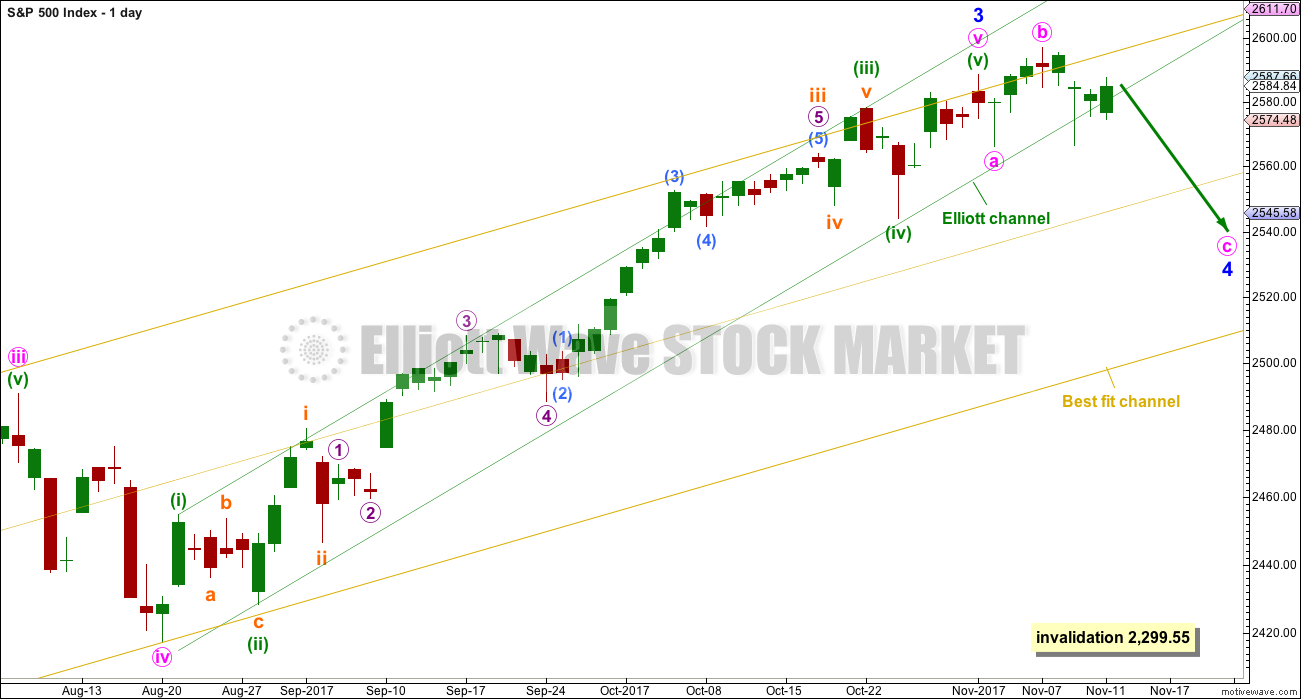
While it is still possible that minor wave 3 is not over, that will now be an alternate wave count.
Minor wave 2 was a shallow zigzag lasting only three days. It does not show up on the weekly chart, but at the daily and hourly chart levels the subdivisions all fit very well. Zigzags can be relatively quick structures.
Given the guideline of alternation, minor wave 4 should be expected to be a flat, combination or triangle. It is labelled here as an expanded flat, which is a very common structure. However, the labelling within it may still change as the structure unfolds next week; it may still morph into a combination or less likely now a triangle.
Minor wave 4 should be expected to break out of the channel that contains minor wave 3. Minor wave 4 in this instance would be expected to remain within the yellow best fit channel.
Minor wave 4 has lasted eight days so far. The next Fibonacci number in the sequence would be thirteen, requiring another five days to complete.
HOURLY CHART
Click chart to enlarge.
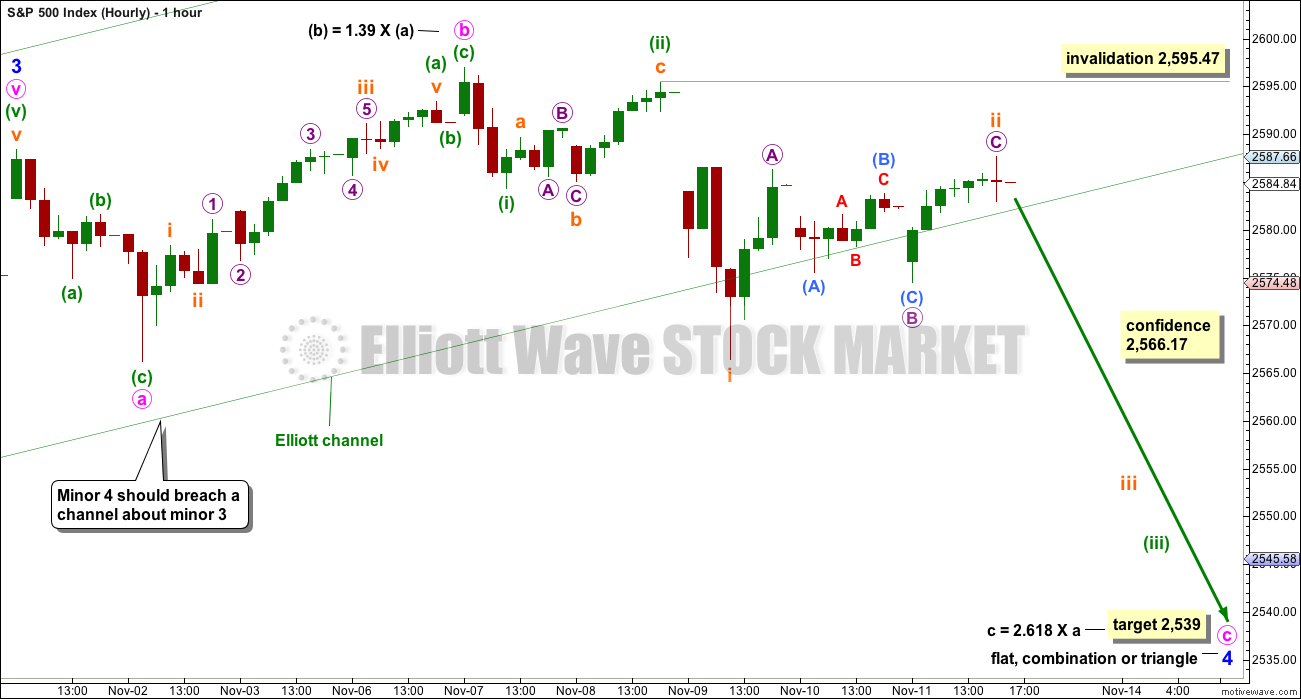
If price makes a new low below 2,566.17, then we may have more confidence in this wave count.
It is possible that minor wave 3 could be over.
Minor wave 4 may be a flat, combination or triangle although it is labelled here as the most common of these structures, an expanded flat.
If minute wave c has now begun with two overlapping first and second waves, then it needs a reasonable amount of space below to complete a five wave structure.
It is also possible that minor wave 4 may be a triangle or combination. If price moves slowly sideways in a choppy consolidation, rather than sharply lower, then this wave count may be relabelled.
If minor wave 4 continues as a triangle, then waves A and now B would be complete. A smaller zigzag or double zigzag downwards for wave C may now begin. If downwards movement unfolds with a lack of momentum, then this hourly wave count may be relabelled as a triangle.
The following commentary assumes that minor wave 4 will complete as the most likely expanded flat correction, so please do keep in mind that this is not certain:
Minute wave c must subdivide as a five wave structure. So far it may have begun with two overlapping first and second waves. If this is correct, then a strong downwards movement may begin next week as the middle of a third wave down unfolds.
Subminuette wave ii may now be a completed zigzag; micro wave C has moved above the end of micro wave A at 2,586.27. A zigzag upwards is complete. This labelling now expects to see an increase in downwards momentum this week.
ALTERNATE HOURLY CHART
Click chart to enlarge.
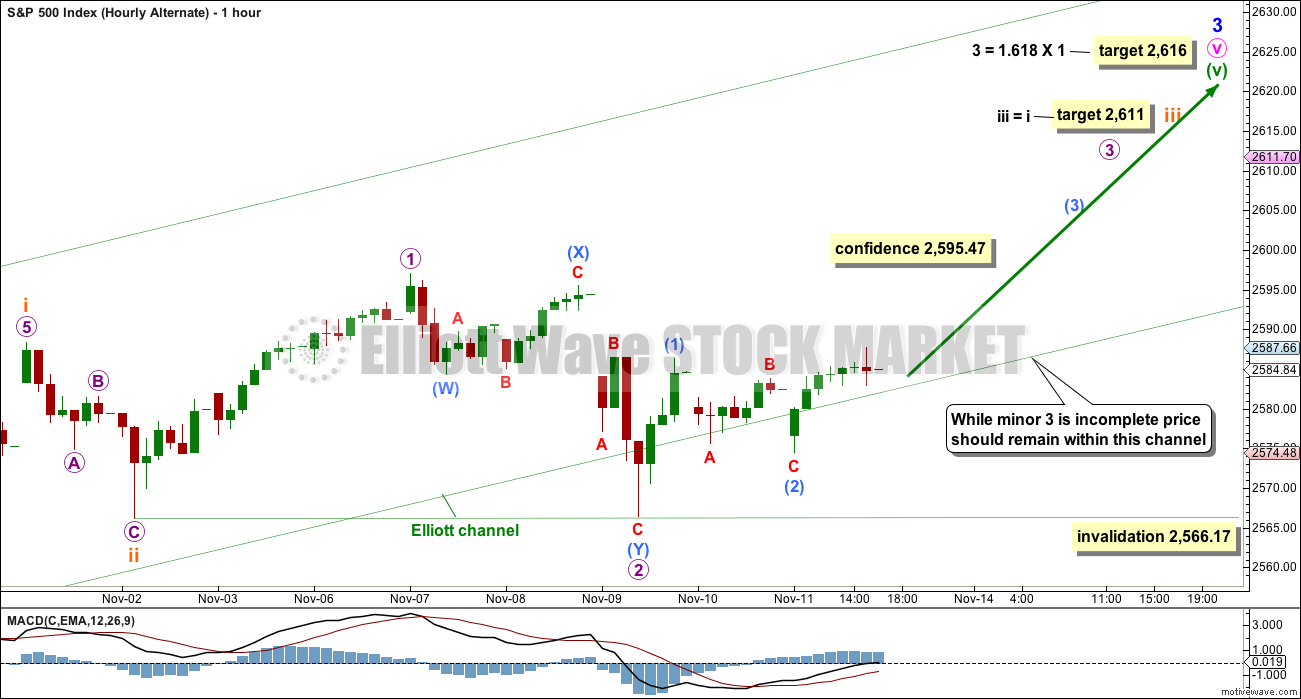
This alternate hourly wave count assumes that minor wave 3 is not yet over, that minute wave v within it is extending.
Minuette wave (v) must subdivide as a five wave structure. It may be an impulse with subminuette waves i and ii complete.
This wave count expects to see a further increase in upwards momentum as a small third wave up unfolds.
Within the impulse of subminuette wave iii, micro wave 1 may now be complete. Micro wave 2 may be complete. It may not move beyond the start of micro wave 1 below 2,566.17.
Micro wave 2 is now very deep indeed, and is longer in duration than subminuette wave ii one degree higher. This does not have quite the right look, but the S&P does not always exhibit good proportions. This wave count is acceptable still for this market.
A breach of the green channel by downwards movement would an indication that this first wave count may not be correct. So far the channel is overshot twice, but not properly breached. I define a breach as full candlesticks outside and not touching the channel.
TECHNICAL ANALYSIS
WEEKLY CHART
Click chart to enlarge. Chart courtesy of StockCharts.com.
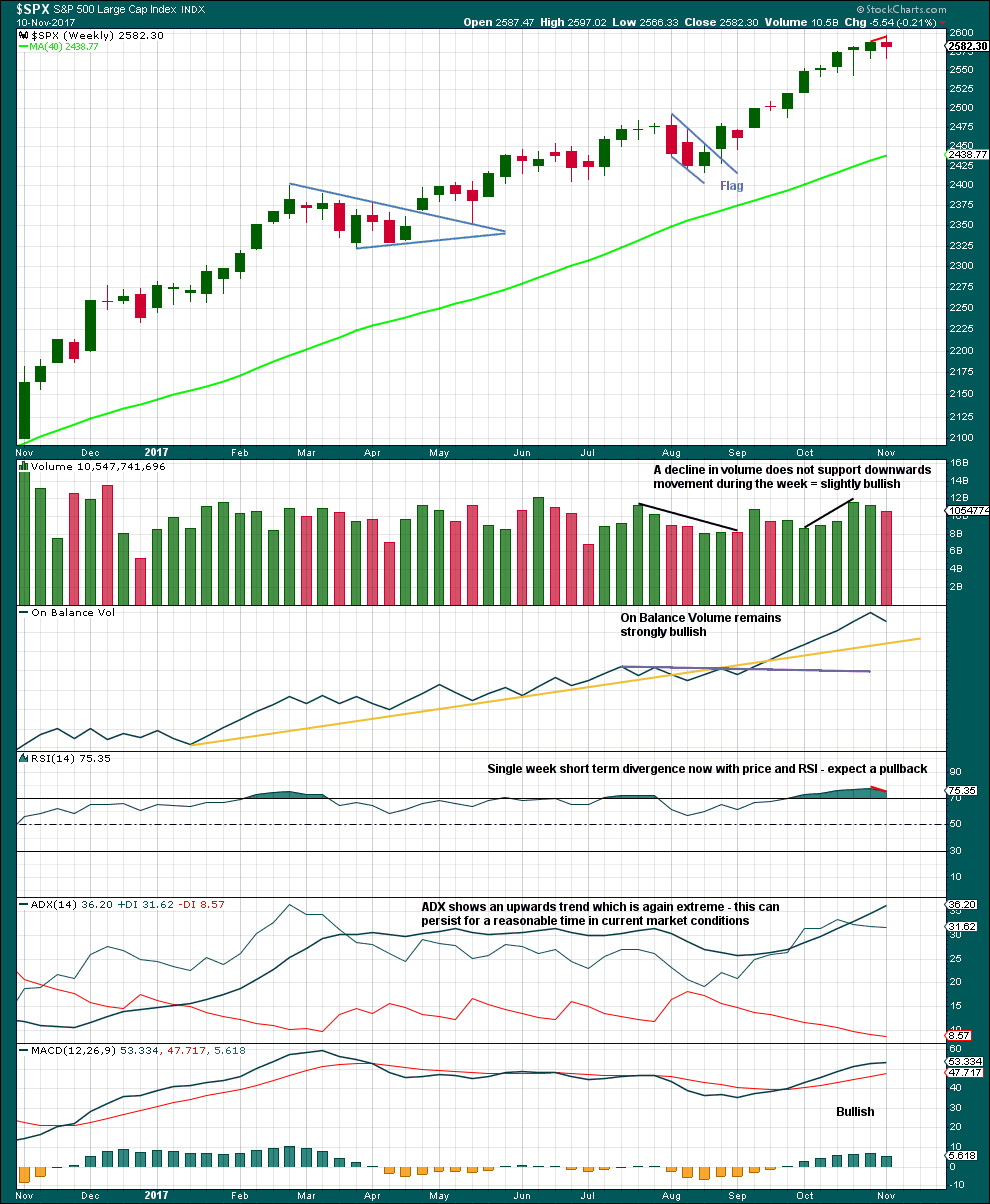
Last week moves price higher with a higher high and a higher low, but the candlestick closed red and the balance of volume was down. Volume did not support downwards movement during the week; this is slightly bullish, but it would be better to look inside the week at daily volume to make a clearer judgement.
With ADX now extreme and RSI exhibiting divergence while overbought, some pullback to resolve this seems a reasonable expectation.
The overall trend does remain up though, so pullbacks are still an opportunity to join the trend.
DAILY CHART
Click chart to enlarge. Chart courtesy of StockCharts.com.
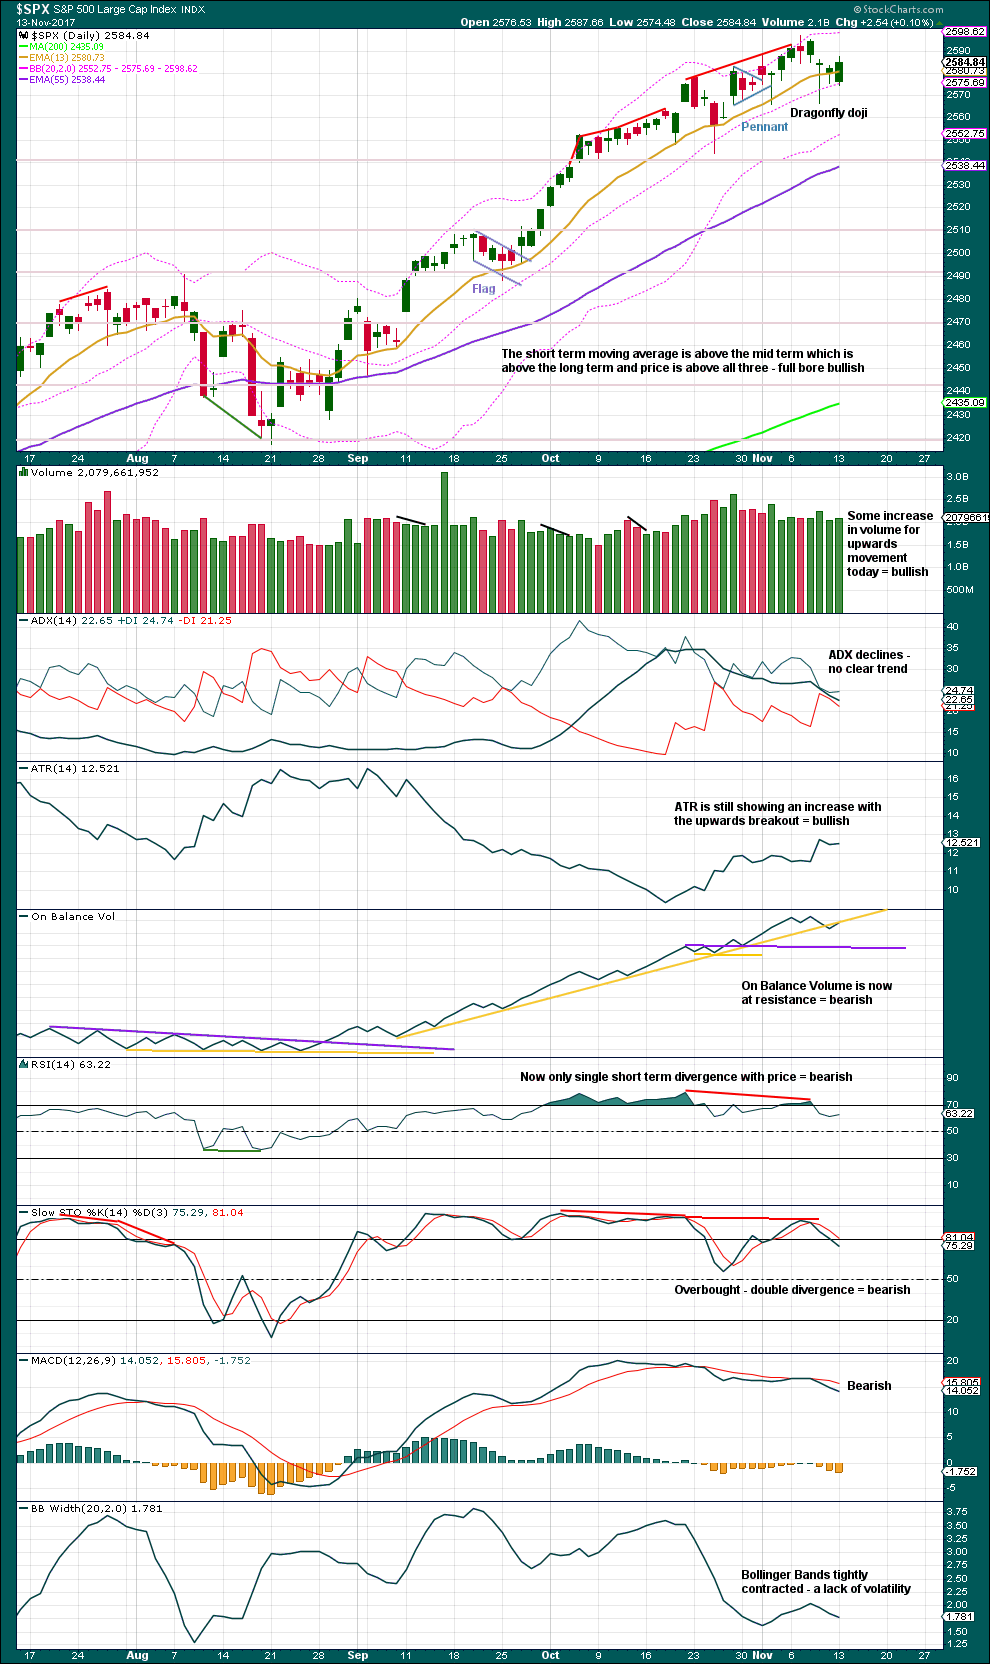
On Balance Volume suggests that upwards movement may end with resistance here, but volume suggests it is not over.
Overall, this chart is still looking more bearish for the short term than it has in quite some time.
VOLATILITY – INVERTED VIX CHART
Click chart to enlarge. Chart courtesy of StockCharts.com.
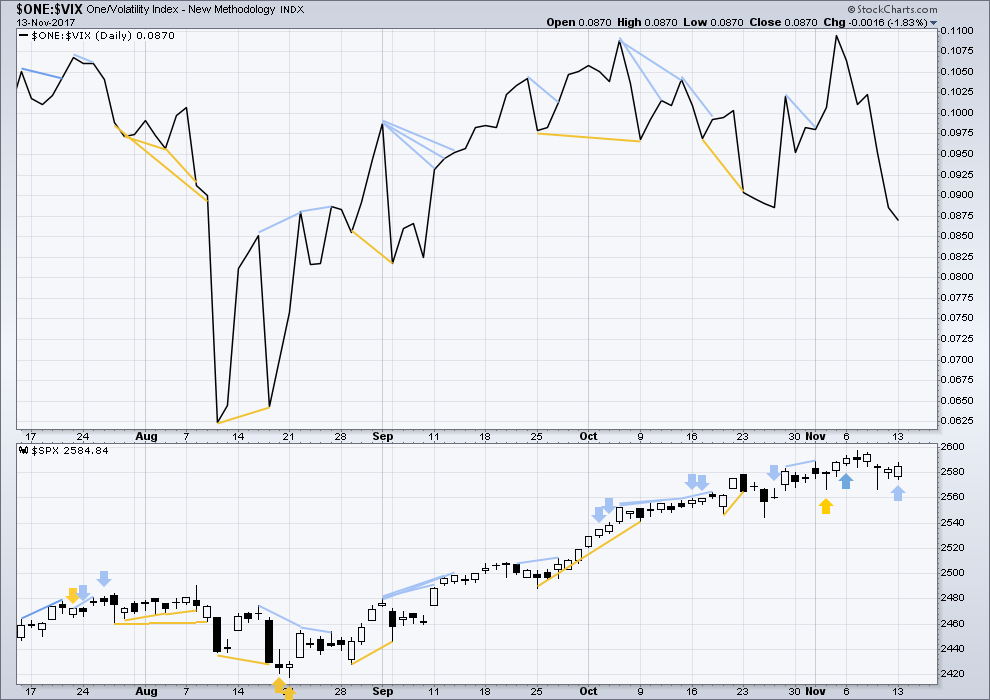
Normally, volatility should decline as price moves higher and increase as price moves lower. This means that normally inverted VIX should move in the same direction as price.
The balance of volume was upwards today and the candlestick was green. There is single day divergence with inverted VIX: as price moved higher overall volatility has increased. There is weakness within price; this is bearish.
BREADTH – AD LINE
Click chart to enlarge. Chart courtesy of StockCharts.com.
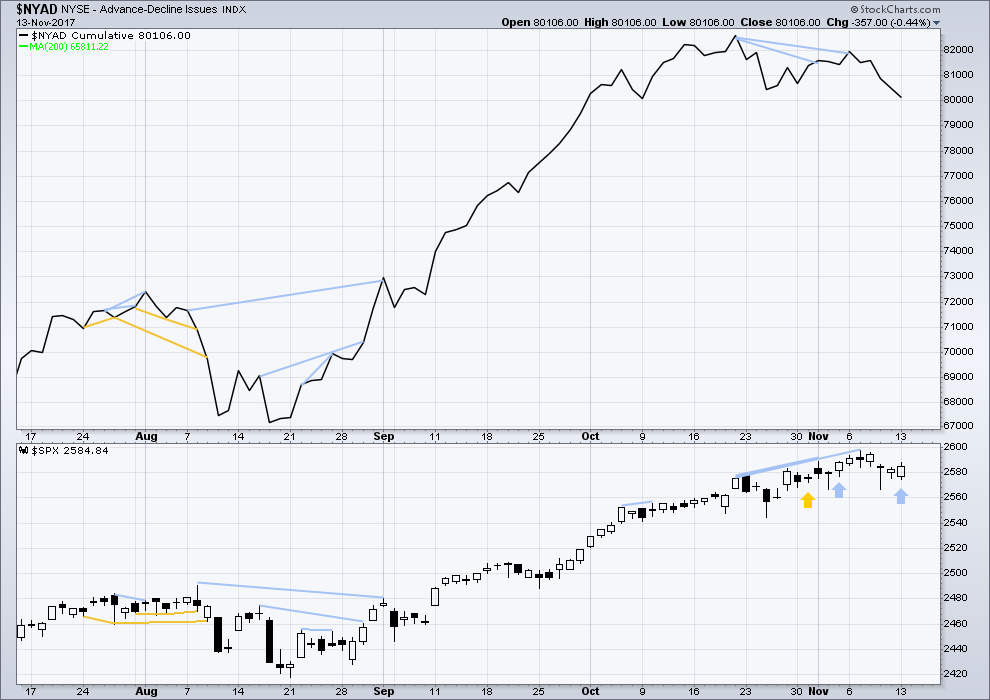
There is normally 4-6 months divergence between price and market breadth prior to a full fledged bear market. This has been so for all major bear markets within the last 90 odd years. With no longer term divergence yet at this point, any decline in price should be expected to be a pullback within an ongoing bull market and not necessarily the start of a bear market.
There is still some mid term divergence back to the 20th of October. As minor wave 3 comes to an end, this should be expected.
Short / mid term divergence with breadth and price will be noted today. This is bearish, and it may be indicating the end of minor wave 3 (main hourly Elliott wave count) to come in a few days, or it may be indicating the alternate hourly Elliott wave count is correct and price is ready to move strongly lower for a few days right here.
Small caps have moved strongly lower last week and mid caps have moved somewhat lower. This market continues to show some short term weakness in support of the new main hourly Elliott wave count.
There is today single day bearish divergence with price and the AD line: price moved higher during the session, but breadth has declined. This supports the main hourly Elliott wave count.
DOW THEORY
At the end of last week, DJT has still failed to make a new all time high. The S&P500, DJIA and Nasdaq have made new all time highs. DJT has failed so far to confirm an ongoing bull market.
Failure to confirm an ongoing bull market should absolutely not be read as the end of a bull market. For that, Dow Theory would have to confirm new lows.
The following lows need to be exceeded for Dow Theory to confirm the end of the bull market and a change to a bear market:
DJIA: 17,883.56.
DJT: 7,029.41.
S&P500: 2,083.79.
Nasdaq: 5,034.41.
Charts showing each prior major swing low used for Dow Theory are here.
Published @ 07:23 p.m. EST.
Lara, in light of your new hourly chart, is last night’s main hourly now less likely? By virtue of today’s action?
Hey everybody, I put up a Bitcoin analysis over at Elliott Wave Gold yesterday. Find it here.
I did a video too, here.
The video also shows how to upload data to Motive Wave in .csv format.
I’m looking for another entry point to buy some Bitcoin.
We may buy some very soon, leaving power dry to buy more if it has another pullback. That would make the current pullback a nice three wave structure.
I am over 90% confident that Bitcoin has not found its high yet. If I can find a nice entry then I’ll hold onto my Bitcoin for months, maybe over a year.
Lara,
Where are you buying and selling BITUSD from?
Cesar did the research on that for us. He chose BitStamp
This? This is possible. A shallow sideways chop to continue for a few days, then another upwards breakout.
Still providing at it’s conclusion an opportunity to join the upwards trend.
This is what I meant below when I said corrections are so difficult to trade profitably because they can morph into 23 different possible wave patterns. Those who want to join the trend must wait patiently during the corrections looking for the completion of the correction.
Thanks Lara. This morning when we had the gap down followed by more downwards movement, I was disappointed I did not short the SPX yesterday. A few hours later as it moves sideways, I am happy I did not short it yesterday.
Thanks for the very timely update Lara!
Picking up a few SPY 258.50 Nov 22 calls to hedge my short trades just in case we get a sharp C up to complete sub min c of min b. Paid 0.84 per contract for the insurance…
Wow. Anyone who can EW count their way through that mess deserves a Gold EW Star!! I can see how newbies and even experienced folks would often if not typically get things wrong re: the expanding flats.
Figures! I put a little order in to grab some VIX calls as it heads downward and what does it do? Uh huh!
Turns right around and scurries in the opposite direction… What the….!!! 🙂
If VIX moves down test 11.50 again, 11.50 strike calls expiring tomorrow should trade for about 0.30. Opening speculative trade to buy a few at limit of 0.29 just in case I get lucky and someone gets giddy! 🙂
For you relative newbies I have said this before but I am going to repeat it again as I think I myself need to occasionally be reminded of it. I was a subscriber to Lara’s analysis for awhile before I began to notice something funny. While she was very good at keeping everyone on the right side of the trend I started to realize that I was leaving a lot of money on the table on my trades. Then EUREKA! I thought to myself. “You dummy!”
Hear me now and believe me later. One of the most valuable things about what Lara provides is her price targets. Capisce??! 🙂
Thanks Verne 🙂
When a market is consolidating, those targets will have to change as the structure becomes clearer. Because there is much greater variety in how consolidations unfold we have to be very flexible as they do.
When a trend / impulse is unfolding I try to refine my targets closer and closer to the end, as I can add calculations at more degrees.
Price support for VIX over the last few days has move up from 10.00, to 10.50, and now appears to be at just about 11.50, well above the 200 dsma. A close above argues for a continued move higher the next day or two…I will reload on any retest of 11.50…
I am taking the 30% pop on my UVXY calls and running. While I think it is going higher, I am sticking with my rule of not letting profits sit in this market.
B bands still containing VIX price and that is generally bullish for VIX…showing steady accumulation…
Impulse up negated. Move up probably corrective with further downside ahead…
B, after 18 months or so of up, has done a very significant retrace, and could very soon be in prime position for a intermediate to longer term long. Watching closely for a break of the down trend line, then some higher highs/higher lows, then I’ll jump on it. Perhaps in a day or three or five.
Yep.I think we are going to get that Santa rally but not before Mr. Market dumps a few giddy bulls ahead of the ramp higher… 🙂
Nothing but coal under the tree this year!
Why Joseph, are you implying that EVERYBODY has been naughty??!! 🙂 🙂 🙂
I have tried to be VERY good this year, and so I hope that Santa will be very nice to me 🙂
Is IYT bottoming? Maybe. I’ve taken a small pilot position. (weekly/daily/hourly/5 min around the clock starting top left).
Below 2572.92 negates impulse up…
Possibly in fourth wave of a five up. If we see a three wave decline after five and then go on to fill the gap we are going higher, and it’s time to exit short trades…this would be confirmed by a VIX surrender of the 200 dsma…
Probably a full flag in VIX, so I would not be shorting it just yet…
I hope now is okay…bgt XIV again!! No stop. It’ll be good someday…maybe even in 30 minutes!!
Well, no stop until I’m solidly in the green, then of course a BE stop…oh, that didn’t take long! Sweeeeeet….
A break of 2562 in ES violates neckline of a potential H&S and the measured move would be almost precisely Lara’s target for minor four FWIW…
We are seeing a classic example of how banksters and market makers abuse cubbies trying to execute bearish trades even in an established downtrend. Anyone trying to get on board during the declines get their faces ripped off. Clearly you don’t sell the dips but instead sell the rips. This is the advantage of having an EW chartist who knows what she is doing people! 🙂
Having had my face ripped this way a time or two in the recent few months I certainly agree with the core thesis, that successful shorting of SPX requires positioning “early”, not selling after the downward action is under steam! I don’t buy the thesis that SPX is in an established downtrend though. The weekly chart is still full bore uptrend, and the daily is only neutral. On my charts. (I use ADX and CCI to characterize strength of trend.) So far.
You are absolutely correct Kevin. The SPX trend still remains up. This correction will be entirely regained when the next impulsive move up begins. I try not to trade the corrections because there are 23 possible patterns which tend to morph from one to another. I cannot and do not stay connected to my computer for daily or hourly trades.
The trend is our friend. I am waiting and looking to go long as we see the completion of what looks to be Minor 4.
Agreed Rodney! The key question here is, how large might this correction get to the downside before that next impulse up starts? If this tax plan passes, we’ve probably seen the lows? If it fails, this market could utterly tank (though the RUT will be hit even harder I suspect).
When you talk about trend, clearly you have to define the time frame. According to Lara’s main count we are in a minor fourth wave down so at minute degree the current trend is down. I agree the larger trend is up.
Gee, I thought I said weekly and daily, and defined my measurement criteria too: ADX and CCI (not EW). Yes, the lower timeframes are mixed and changing by the hour and minute. And yes, the main EW count has us in a jumbled minor 4 wave correction, which generally means “downtrend”, though arguably at this point it means “lots of oscillations”. Certainly my strength of trend indicators at the 5 minute and hourly level are changing colors rapidly!!
I mentioned FXE had reached a decision zone a week ago. It’s been idling there since, until today, with a clear break to the upside. It’s at 113 now and I suspect a move to the 116 area is in the cards. I’ve doubled my position size after today’s move. here’s the daily view…
Now begins the slow torturous climb to fill the gaps as the banksters attempt to maintain the illusion of bullishness, until the next gap down. I am beginning to detect a pattern here. I suspect the gaps down are just going to become incresingly violent. Idiots!! 🙂
Holding some UVXY calls for a potential 10X upside trade. I did not want to post it as the trade to the upside used to be pretty reliable in times past. You could count on one or two sure bet opportunities at least per year. The market has gone well over year without an even 5% much less a normal correction so vol capitulation spikes have all but disappeared making that trade very tough. Shorting the upside spikes is still a good trade but not like it used to be. Catching the move up has always been a bit tricky as you have to catch in within literally a 24 hour period to make it worth while. Much easier said than done.
Nothing is more frustrating than getting stopped out of option plays when VIX is moving higher as you miss the nice pop of the exploding short term premiums. I am going to have to widen my stops when the wave count is this high probability in the future…..ARRRGGGH!!! 🙂
I’m taking some XIV here myself.
Ka-ching!!!
Plenty of time to short VIX if it surrenders the 200 day. No need to get cute! 🙂
My view is the market is just going to do spastic up and down action for days and days here. There are trillions in “earnings” for corporates at stake re: the tax giveaway plan. It’s what, 80% priced in? I dunno, a lot anyway. I don’t believe for a moment (barring other stochastic shock like a preemptive strike at NK) that this market is going to make any major move up or down until its resolved. So it’s range trading time, and XIV is awesome for that.
This market is truly starting to behave very strangely indeed. I looked at the bullish engulfing candle yesterday and thought to myself – “You’ve got to be kidding me!”
What does it tell you that a signal like that shows up in the middle of a potentally impulsive decline??!!
That the chances of an impulsive decline are less than you thought??
That either the decline is over…. or…. in this case because that bullish engulfing candlestick came not after a decline of any real magnitude, it looks more like within a slightly bigger consolidation, that it’s not a reversal signal.
The thing that’s really important about candlestick reversal signals here, is there has to be something to reverse for them to be a signal.
Patterns within consolidations should be ignored. According to Nison anyway.
Stopped out of VIX calls at 12.11. Very nice gain.
Will look to reload.
I hate the whipsaw, but you just gotta take what Mr. Market giveth… 🙂
Huge fight over putting in a new low…who will prevail??!! 🙂
DJI has already….divergence would be bullish….
Tough to know whether these declines of the vol morning highs due knee jerk shorting of the bots and lemmings or we are about to see an interim bottom….
A definite attempt to arrest the futures decline. Price action in VIX, which is now unchanged after being up around 3% earlier, suggests that traders think they will be able to halt the wave down. We will see….
Once again, selling 1/4 VIX calls at the open, with a 0.50 trailing stop on remaining position.
Deja Vu all over again as one philosopher observed…. 🙂
After tonight’s analysis, I will post on the anatomy of a ten bagger volatility trade.
Those of you who have been around awhile have already heard the scenario so I hope you don’t mind a revisit as another opportunity may be just around the corner…
PR Debt…. effectively worth ZERO!
Any new Federal help will take a Senior priority position for repayment or PR won’t get the funds. Therefore all existing debt will take a 100% haircut as the PR economy can only support payments for the new help.
Venezuela Debt will in time go to ZERO!
Those High stock dividend yields are high for a reason… chickens will come home to roost in this area. People believe buying dividend paying stocks have zero risk… lessons will be learned!
I agree. What is incredible is that the market apparently does not!
So much for efficient markets!!
Is the PR debt mostly or all held by venture vultures? I.e., it’s private companies that will never get paid, thus this isn’t really a “market” issue? I don’t know, I’m asking. Also, I note that Greece has been in a similar situation for what, 50 years? And always there’s yet another round of “refinancing”. No one wins when it’s all written off!! So the debt just moves into the future eternally. The poor people of PR have been and continue to be royally preyed upon the US capitalist system. And the island may very well become uninhabitable within 50 years with climate change, as well (similar to much of Florida, all of the southwest of the US, and all kinds of shoreline developed areas). There’s going to be so many trillions of $$$ lost due to rising seas and heating atmosphere it is truly beyond all conception. The short of all history is coming, but the world may be a pretty rotten place to spend money in by then!
I know of people who own that garbage personally… chasing yield. They were sold a bill goods, hook line and sinker. At times having the backing of taxing authorities is absolutely meaningless! This is one of those times.
For all you volatility hounds, two key things to pay attention today. We have to stay above the 200 dsma. Also, ideally, B bands should continue to contain price action with outward expansion. If we get some icing on the cake with a close above 13.00, the ten bigger is in play! 🙂
Reposting from yesterday board
Verne,
Would you be able to share with us which strike leap (PUT I am assuming) you are looking at fro AMZN? Trying to learn from all you experts how to structure the trades. 🙂
It is actually a “synthetic put” in the form of a 1125/1130 bear call credit spread for June 2018. AMZN is an expensive stock and one can tie up a lot of capital waiting for the break. The spreads will tell me when to switch to the June 1000 put options. For educational purposes only, of course… 🙂
Verne, legally if you are sharing the actual trades in your actual live trading account, then that is okay.
Only if giving trading advice on how to actually place a trade (entry, stop, instrument used, profit target) that is NOT a trade you yourself are making would there be a problem.
AFAIK what you are doing here is just fine.
Not only is it just fine and legal, it’s incredibly helpful and generous of you to do this for all members here. And for me too 🙂
🙂
Those of you who have been around awhile have had to endure my occasional musings about the bond market, and the role it will play in signaling trouble ahead. We all know about Puerto Rico’s 86 billion disaster which the market seems to have ignored. I contend those losses are simply not being reported, hence no panic so far. Venezuela just missed a payment. Does anyone think it will be the only miss? GE just announced a 50% cut in its dividend. We have also noted turbulence in HYG and JNK. Trouble ahead?
JNK turned down around April of 2015. It accelerated into the fall of 2015. The US equity markets followed suit turning over in August of 2015 and bottoming in February of 2016. That was the end of the Cycle degree wave IV. It is my opinion that JNK often leads the equity market. I think we will see it again. We are right on track to see one last push to ATHs followed by a powerful bear market that will take a few years to complete. Let us be forewarned.
Perhaps. I don’t view JNK as breaking down quite yet. Here’s the weekly chart. It’s just gotten to a significant weekly downtrend (high ADX and high CCI), and hasn’t begun to dive like it did back in 15/16. Could be coming fast though.
The white dots are squeeze markers, the blue dots are volume spikes.
Knock Knock….anyone home 🙂
🙂 I’m home
Oh-mi-gosh Doc…am I TURD??!