
A signal from On Balance Volume for Friday sees the main and alternate hourly Elliott wave counts swapped over.
The mid to long term picture remains the same, but the short term picture for next week is now changed.
Summary: The target for a multi day pullback is now about 2,539.
Pullbacks and consolidations at their conclusions offer opportunities to join the upwards trend.
Always trade with stops and invest only 1-5% of equity on any one trade.
Last monthly and weekly charts are here. Last historic analysis video is here.
MAIN ELLIOTT WAVE COUNT
WEEKLY CHART
Click chart to enlarge.
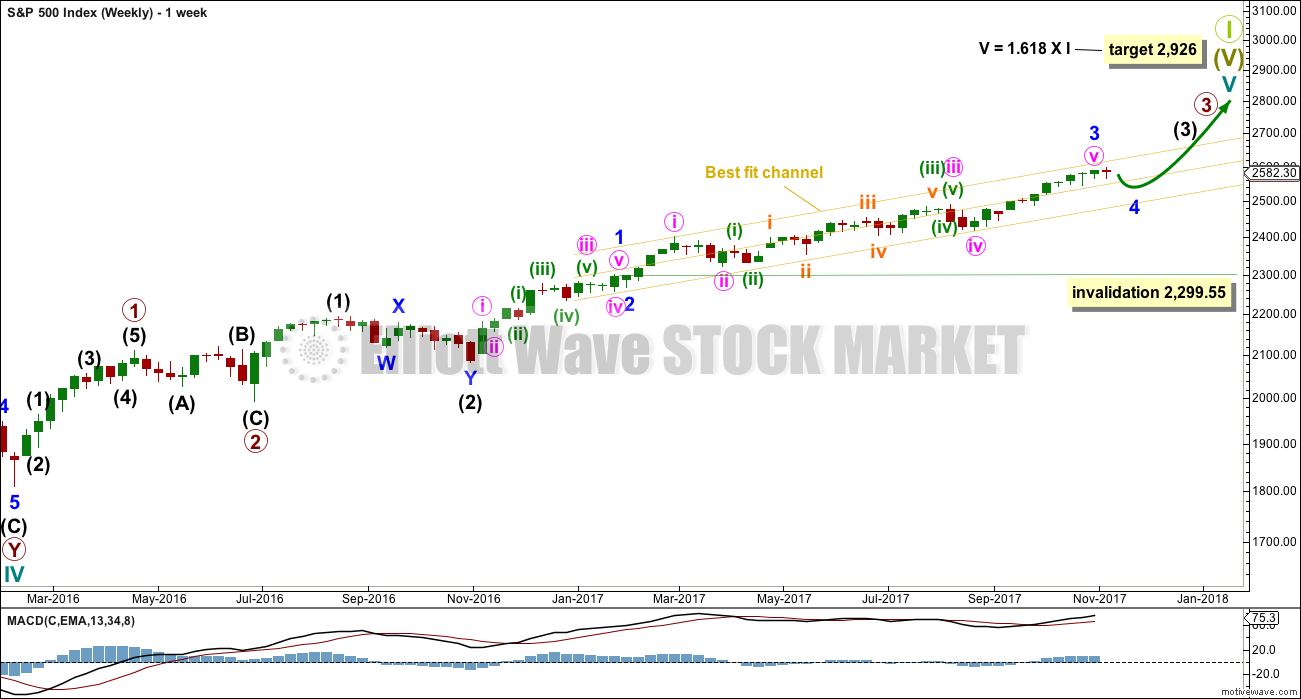
This wave count has strong support from very bullish On Balance Volume at the weekly chart level. While classic analysis is still very bullish for the short term, there will be corrections along the way up. Indicators are extreme and there is considerable risk to the downside still.
As a Grand Super Cycle wave comes to an end, weakness may develop and persist for very long periods of time (up to three years is warned as possible by Lowry’s for the end of a bull market), so weakness in volume may be viewed in that larger context.
Minor wave 4 should find support about the lower edge of the best fit channel. Minor wave 4 may not move into minor wave 1 price territory below 2,299.55.
The next reasonable correction should be for intermediate wave (4). When it arrives, it should last over two months in duration. The correction may be relatively shallow, a choppy overlapping consolidation, at the weekly chart level.
DAILY CHART
Click chart to enlarge.
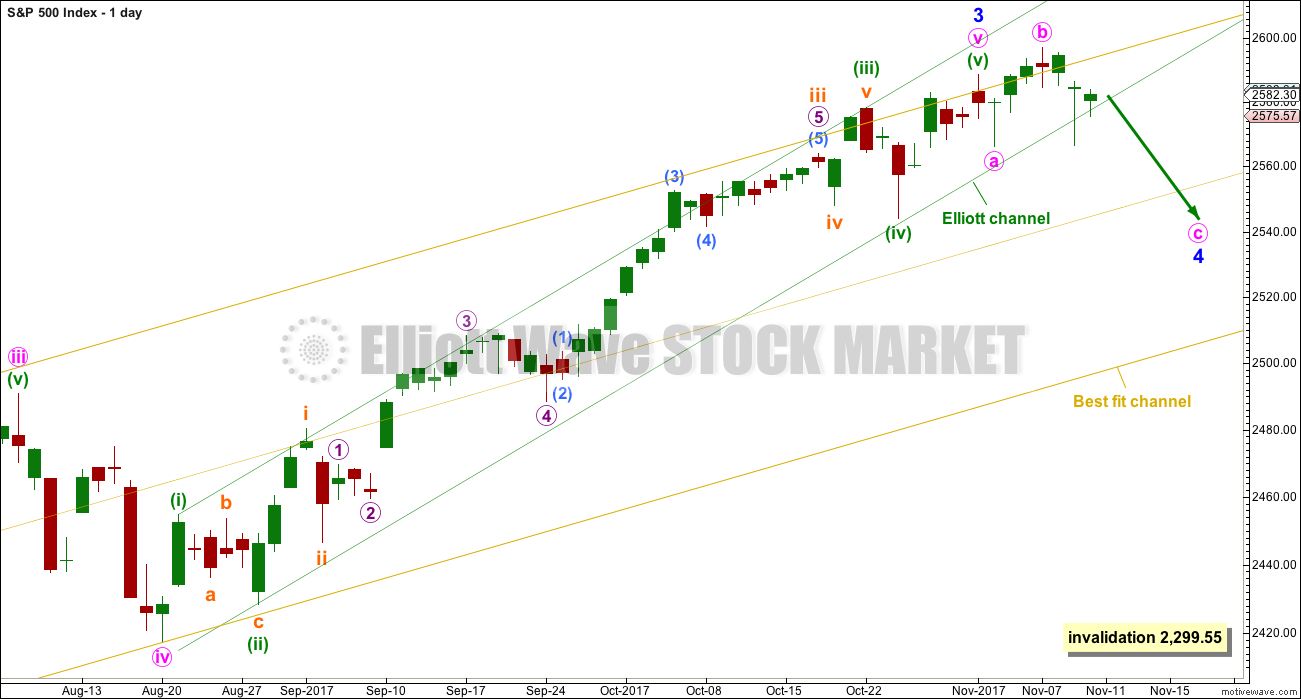
While it is still possible that minor wave 3 is not over, this will now be an alternate wave count.
Minor wave 2 was a shallow zigzag lasting only three days. It does not show up on the weekly chart, but at the daily and hourly chart levels the subdivisions all fit very well. Zigzags can be relatively quick structures.
Given the guideline of alternation, minor wave 4 should be expected to be a flat, combination or triangle. It is labelled here as an expanded flat, which is a very common structure. However, the labelling within it may still change as the structure unfolds next week; it may still morph into a combination or less likely now a triangle.
Minor wave 4 should be expected to break out of the channel that contains minor wave 3. Minor wave 4 in this instance would be expected to remain within the yellow best fit channel.
Minor wave 4 has lasted seven days so far. It looks unlikely to be able to complete in just one more day, so the next Fibonacci number in the sequence would be thirteen, requiring another six days to complete.
HOURLY CHART
Click chart to enlarge.
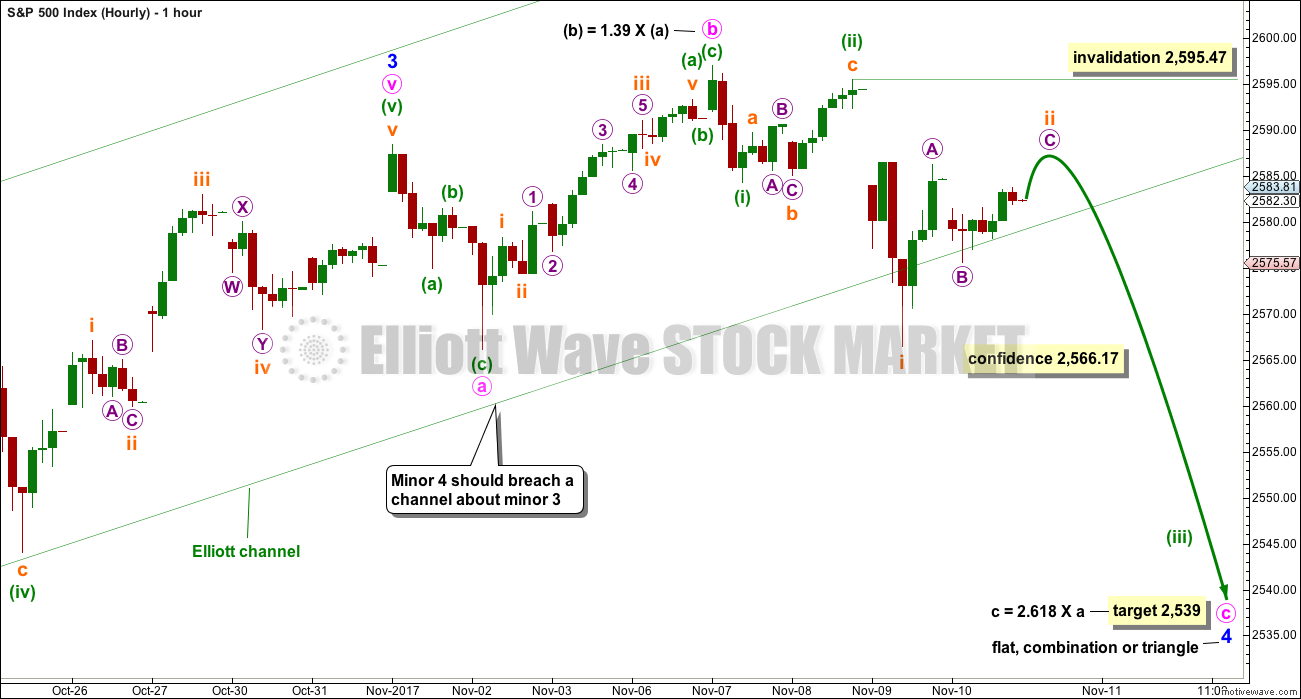
If price makes a new low below 2,566.17, then we may have more confidence in this wave count. A bearish signal from On Balance Volume at the end of this week is given enough weight in this analysis to switch this over to a main wave count.
It is possible that minor wave 3 could be over.
Minor wave 4 may be a flat, combination or triangle although it is labelled here as the most common of these structures, an expanded flat.
If minute wave c has now begun with two overlapping first and second waves, then it needs a reasonable amount of space below to complete a five wave structure.
It is also possible that minor wave 4 may be a triangle or combination. If price moves slowly sideways in a choppy consolidation, rather than sharply lower, then this wave count may be relabelled.
The following commentary assumes that minor wave 4 will complete as the most likely expanded flat correction, so please do keep in mind that this is not certain:
Minute wave c must subdivide as a five wave structure. So far it may have begun with two overlapping first and second waves. If this is correct, then a strong downwards movement may begin next week as the middle of a third wave down unfolds.
ALTERNATE HOURLY CHART
Click chart to enlarge.
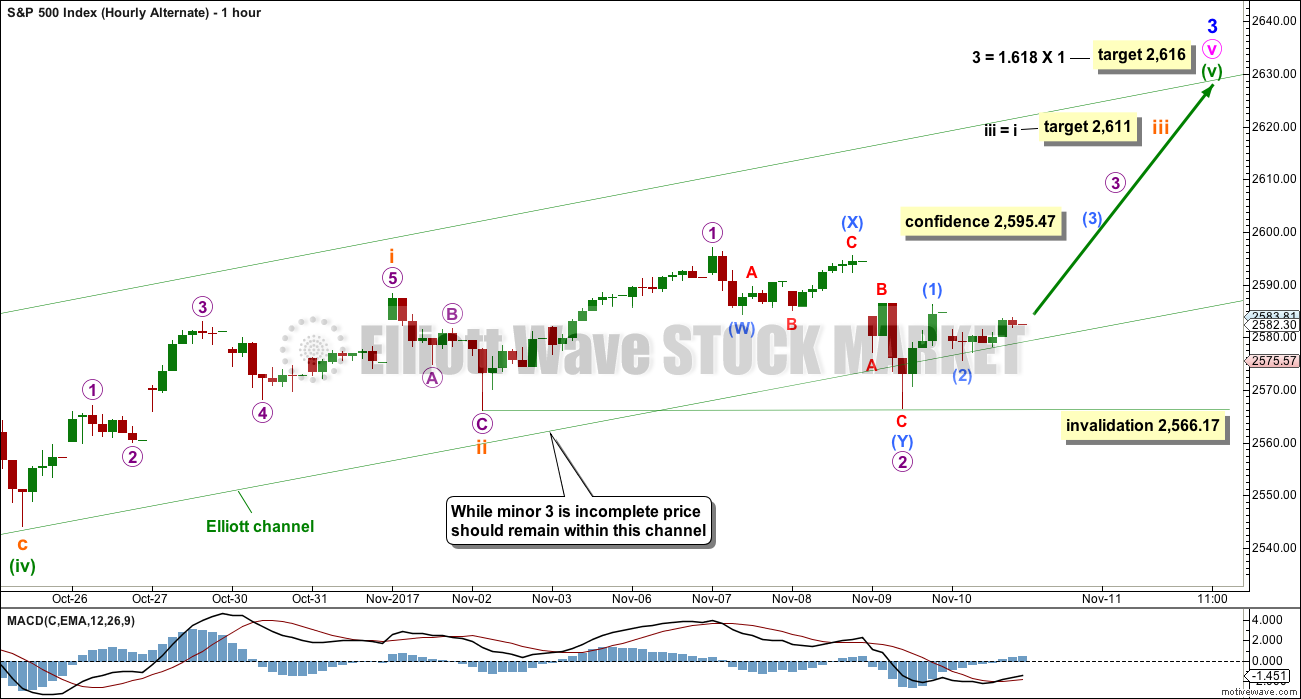
This alternate hourly wave count assumes that minor wave 3 is not yet over, that minute wave v within it is extending.
Minuette wave (v) must subdivide as a five wave structure. It may be an impulse with subminuette waves i and ii complete.
This wave count expects to see a further increase in upwards momentum as a small third wave up unfolds.
Within the impulse of subminuette wave iii, micro wave 1 may now be complete. Micro wave 2 may be complete. It may not move beyond the start of micro wave 1 below 2,566.17.
Micro wave 2 is now very deep indeed, and is longer in duration than subminuette wave ii one degree higher. This does not have quite the right look, but the S&P does not always exhibit good proportions. This wave count is acceptable still for this market.
A breach of the green channel by downwards movement would an indication that this first wave count may not be correct.
TECHNICAL ANALYSIS
WEEKLY CHART
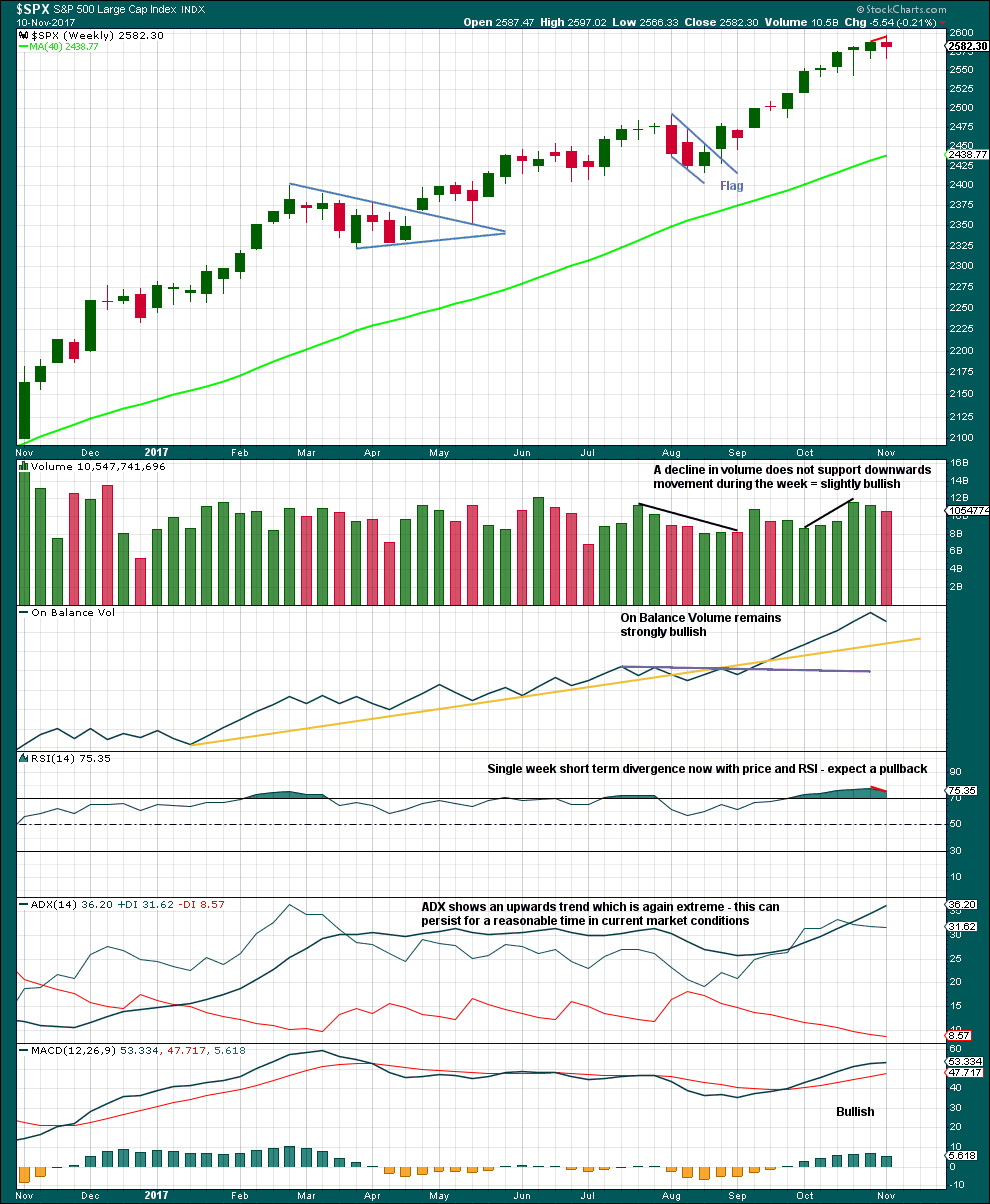
Click chart to enlarge. Chart courtesy of StockCharts.com.
This week moves price higher with a higher high and a higher low, but the candlestick closed red and the balance of volume was down. Volume did not support downwards movement during the week; this is slightly bullish, but it would be better to look inside the week at daily volume to make a clearer judgement.
With ADX now extreme and RSI exhibiting divergence while overbought, some pullback to resolve this seems a reasonable expectation.
The overall trend does remain up though, so pullbacks are still an opportunity to join the trend.
DAILY CHART
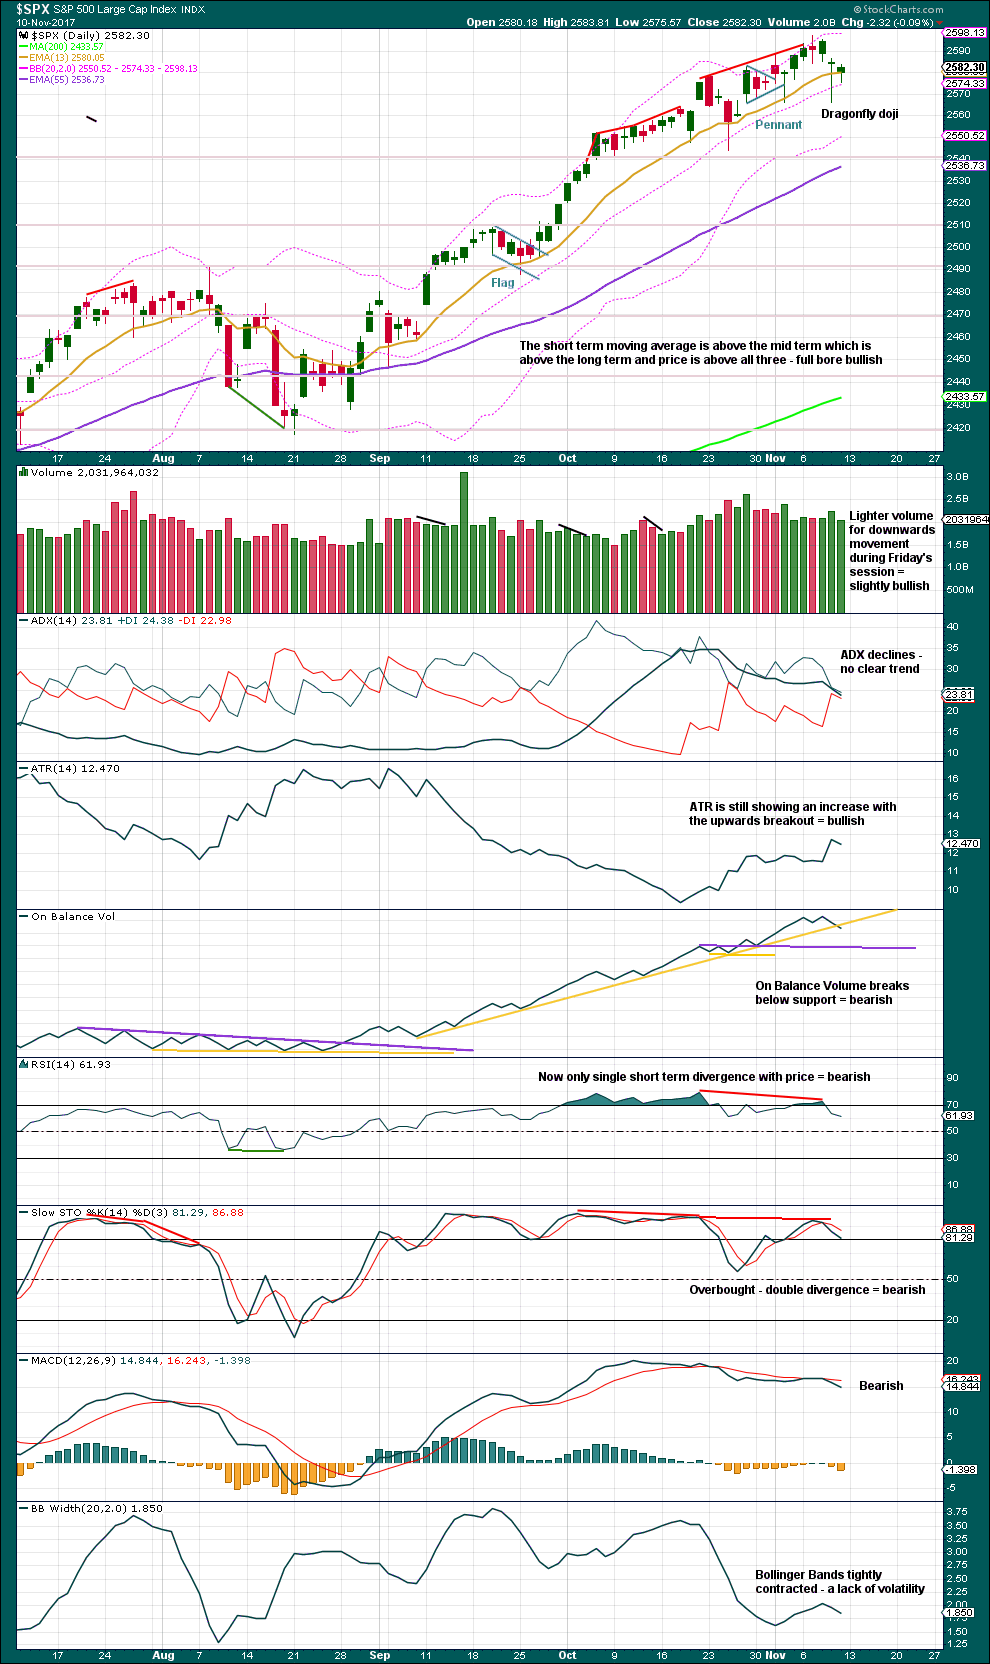
Click chart to enlarge. Chart courtesy of StockCharts.com.
The trend line breached by On Balance Volume on Friday is long held and tested multiple times. It does have a reasonable slope though, so it only has reasonable and not strong technical significance. However, bearish signals from On Balance Volume are rare lately, so this one will be given some weight.
Divergence with price and RSI and Stochastics, and bearishness from MACD, all support the new alternate Elliott wave count.
However, extreme conditions can remain so for a reasonably long time in this market lately. The alternate does remain possible.
The balance of probability looks to have shifted after Friday to expectations of a pullback here.
VOLATILITY – INVERTED VIX CHART
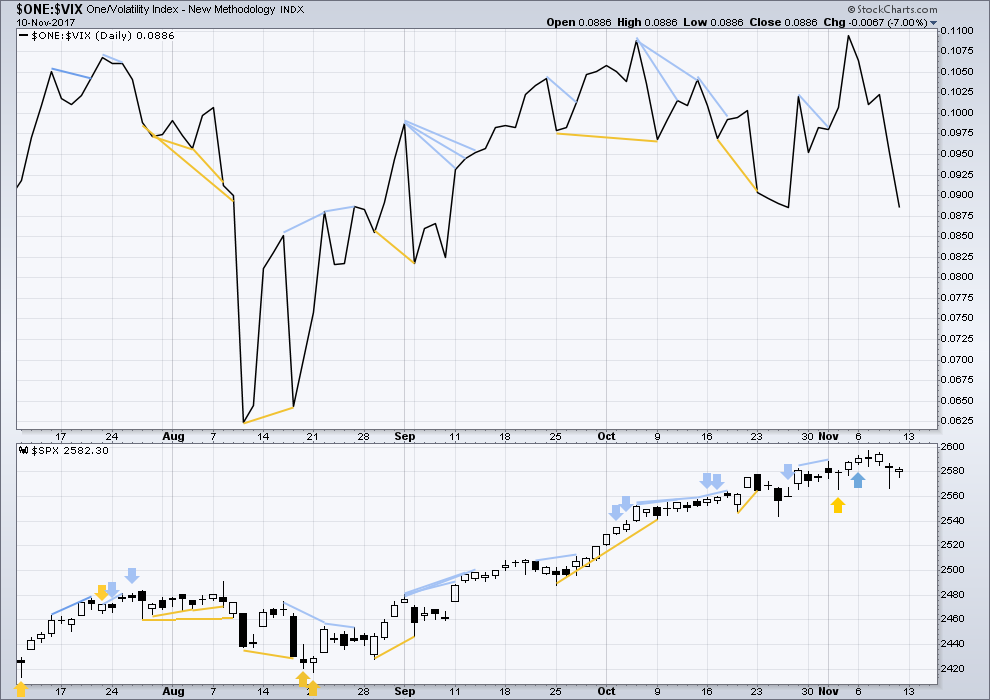
Click chart to enlarge. Chart courtesy of StockCharts.com.
Normally, volatility should decline as price moves higher and increase as price moves lower. This means that normally inverted VIX should move in the same direction as price.
While price moved sideways during Friday, inverted VIX has moved strongly lower. The downwards movement for price on Friday had good support from declining volatility.
BREADTH – AD LINE
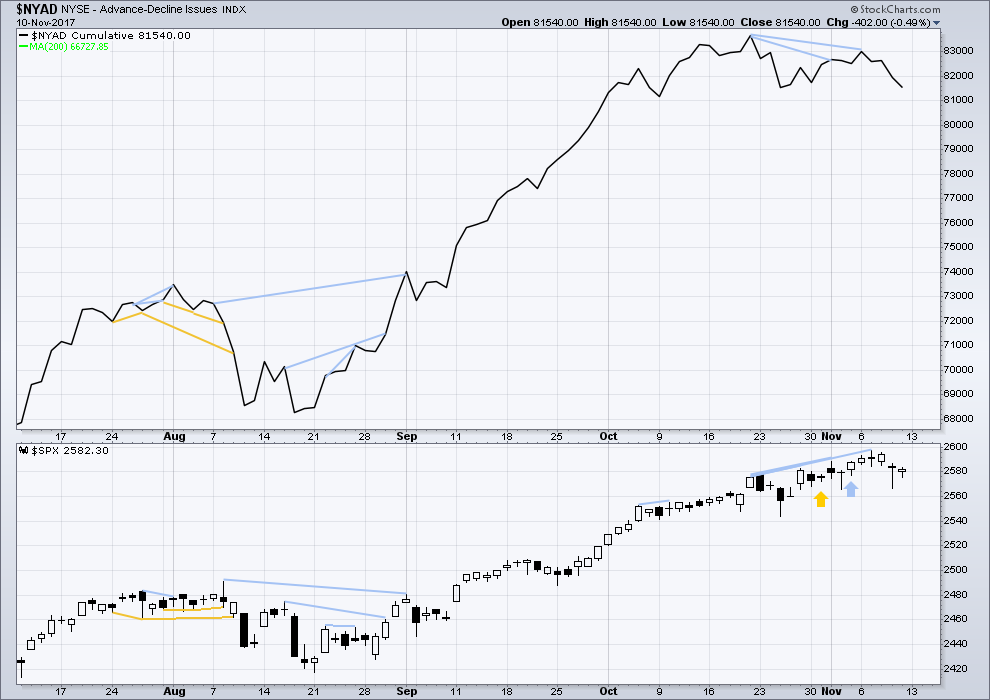
Click chart to enlarge. Chart courtesy of StockCharts.com.
There is normally 4-6 months divergence between price and market breadth prior to a full fledged bear market. This has been so for all major bear markets within the last 90 odd years. With no longer term divergence yet at this point, any decline in price should be expected to be a pullback within an ongoing bull market and not necessarily the start of a bear market.
There is still some mid term divergence back to the 20th of October. As minor wave 3 comes to an end, this should be expected.
Short / mid term divergence with breadth and price will be noted today. This is bearish, and it may be indicating the end of minor wave 3 (main hourly Elliott wave count) to come in a few days, or it may be indicating the alternate hourly Elliott wave count is correct and price is ready to move strongly lower for a few days right here.
There is not yet any short term divergence between price and the AD line. Downwards movement during Friday’s session comes with support from declining market breadth; this is bearish.
Small caps have moved strongly lower this week and mid caps have moved somewhat lower. This market continues to show some short term weakness in support of the new main hourly Elliott wave count.
DOW THEORY
At the end of this week, DJT has still failed to make a new all time high. The S&P500, DJIA and Nasdaq have made new all time highs. DJT has failed so far to confirm an ongoing bull market.
Failure to confirm an ongoing bull market should absolutely not be read as the end of a bull market. For that, Dow Theory would have to confirm new lows.
The following lows need to be exceeded for Dow Theory to confirm the end of the bull market and a change to a bear market:
DJIA: 17,883.56.
DJT: 7,029.41.
S&P500: 2,083.79.
Nasdaq: 5,034.41.
Charts showing each prior major swing low used for Dow Theory are here.
Published @ 01:41 a.m. EST on 11th November, 2017.
And finally, numero tres…!
Nice Fibonacci numbers there. So… this market could be ready for a turn or a big consolidation.
Perhaps intermediate (4) is closer than we think?
Very possibly..! 🙂
Here is number two….
Is that supposed to be an Elliott wave count Verne? Or… something else?
I assume it is supposed to be EW as he is attempting to show fib relationships among wave durations. Quite an itsy bitsy wave one, yes? 🙂
Study of cycles blogger, TaderJoe has put up some fascinating fib stock market numbers.
There are three that caught my attention. Enjoy! 🙂
Hourly chart updated:
Micro C still needs to move at least slightly higher to avoid a truncation. It needs to move above micro A at 2,586.27.
Kudos Rodney! Now ‘fess up…have you been peeking at Lara’s cheat sheet??!
(Just kidding!) 😀
Yes. I have found that if you are really, really nice and don’t call her Grandma Lara, she will let you peak at the cheat sheet.
Lara is a great teacher.
It looks like we may have completed Micro C and Subminuette ii. That means tomorrow should be down and down hard if the count is correct.
As they funny guy (I think it was Martini!) in “One flew over the Cuckoos’s nest” said: “Hit me!” 🙂
ROTFL 🙂 🙂 🙂
Grandma…. LOL
my grandkids call me Crappa,,, Doc
No B.S.?! 😀
Price of VIX only got pummeled to 11.00 even. I think that is the best I am going to get. Loading another 1/4 for 0.95…
VIX will easily recapture 200 DSMA, now a key pivot…that’s the way…! 🙂
I am adding to my AMZN leaps today. Why, you politely ask? I am so glad you ask.
AMZN’s founder and biggest shareholder, yep! Mr ” B” himself, unloaded a ton of shares today, Kinda fitting at a new all time high. I am down about 3% in my leaps and this seems like a good time to lower my cost basis. This ought to be fun!! 🙂
Verne,
Can I ask you for which series leap (PUT I am assuming) you are looking at fro AMZN? Trying to learn from all you experts how to structure the trades. 🙂
Another remarkable example of how schizoid the market has become- we are printing today a bullish engulfing candle as we did last Thursday, in the face of other bearish signals, like OBV…
Schizoid has certainly become the new normal in the last year. It’s driven by the assault underway on the fabic of reality.
Going to be a very slow and stagnant market until the tax bill gets resolved, I suspect.
I know how these guys roll. They are unable to brute force the issue on volatility. I am looking for a quick ambush spike back down to rattle volatility bulls. Opening a contingency order to load ALL remaining calls on any VIX tag of 10.50, market order…if we keep going higher will scale in as planned…
stock traders HUN is in a significant pullback and close to both 61.8% retrace and a very close by symmetric projection of it’s late Sept. downmove. I’ll be on a turn at these levels and buy triggers.
HAL has also pulled back nicely in a strong bull trend and is on a key decision point of 3 overlapped key levels: a 50%, a 61.8%, and a symmetric projection from early Oct. Will be buying there too on triggers.
VIX 200 day MA so far providing support. Looking for move back above 12.00 for reloading another 1/4, or move down to 10.50, whichever comes first…
Reloading VIX 11.00 strike Nov 22 calls. Bull pennant…1.00 per contract 1/4 full batch…
SPX inching lazily higher to the end of subminuette ii as Rodney’s chart shows?? Hope so… I’d like some express elevator down action.
Big gap => loads of resistance just ahead!
Are we seeing some kind of contracting triangle? If so break should be to the downside…
I can structure up a barrier triangle, with the bottom of the gap forming the lateral barrier….in the micro, price came into it from above, but that move was tiny. It “should be” per my thinking a bullish continuation pattern. Which should give you cheer because I’m usually wrong. Price would need to complete a D up, E down and then push up and through the gap for that to play out. Or price pushes into the gap area now and completes the abc up and starts breaking down hard. I’d be surprised by that but will take whatever comes.
D now complete. E in development.
While this SP500 market sorts itself out…I’m loading up on TBT. Anyone else think bonds should be sinking over the next few months? Energy up, inflation up, Fed raising rates…is it the perfect set up for a run up in TBT? I’m long, and I keep adding.
VIX moved back to tag top of 200 day MA. Bearish case should see a bounce off it…
Gap filled with shooting star. Can the bulls hold it…?
If Lara’s main count hourly chart is still in play, the low at the gap down open is the Micro B wave and now we are in Micro C wave to the Subminuette ii completion somewhere above 2586.
Yep! Or nested first and second waves….
Laying out this possibility clearly is helpful Rodney, thank you. Appears there are dangers (opportunities) lurking everywhere today.
VIX facing stiff resistance at 12.00. Either we capture it before the close or we surrender the 200 day SMA. If the later, we go back to re-test 10.50 floor…
Let’s see if gap proves resistance or the B boys flex some more liquidity muscle…they never give up, do they? 🙂
Is today going to be 8/29 groundhog day??? Large down opening, run up from there to the prior close, a short pause, then up and away…for weeks.
Kevin,
If this is large down opening, then we can be sure that there will be no correction. I suspect either the markets sheds some from current levels or the holiday season will feel very bloated…
Stopped out of long VIX short term positions after trailing stop triggered. OK profit but looking to reload…
Nothing would surprise me… 🙂
I will be selling 1/4 of my VIX calls at the open for a quick double, and letting the remaining calls ride with an order to sell triggered by a VIX trailing stop of 0.50….
I saw something on Friday that turned out to be significant. VIX for the first in a long tme reclaimed and held its 200 day SMA. This ended a six week streak of Friday smack downs below ten. I bought a trailer load of VIX calls and saw something I had NEVER seen- the buy side execution actually moved the market with an immediate VIX spike higher afterwards, suggesting EXTREMELY low volume on call buying. Why wasn’t that buy smashed like all the other Fridays?!
The other possibility is that a real WHALE went long VIX on Friday….hmmnnnn…!
Back to a short term bearish posture. Okay…confirming indicator #1 a break of that channel on the hourly alternative, and confirming indicator #2 a break of the invalidation price. It does look like the market might be initiating a more significant rollover. But we’ve been surprised over and over and over in the last 5 months with a sudden powerful upthrust just about at this point of bearish sentiment. Another here wouldn’t suprise me a bit.
IKR! That was exactly my thought when I prepared this analysis.
But then…. I’ve found that if I go with what OBV tells us… I should be right more often than wrong. It does seem to be the one indicator I use which is more reliable ATM
Sorry Doc; Another “busy” week-end…! 😀
TMI, dude!!!
Dude, it’s what wabbits do! Stay busy! 🙂
#1 – Take that you silly rabbit!
Lara’s introduction states:
“The target for a multi day pullback is now about 2,539.”
Friday morning I said I was looking for a pullback / correction to 2525 or possibly 2550 before entering my long positions. Sometimes it is okay to ‘toot your own horn’.
Nice 🙂