Last analysis expected more upwards movement to begin the new trading week, which is what has happened.
The Elliott wave target is just one point off a target using the measured rule and a reliable continuation pattern.
Summary: The Elliott wave target is at 2,616 and a target from a small pennant pattern is 2,617. The upwards trend has support from very bullish On Balance Volume.
Assume the trend remains the same until proven otherwise. The trend is up.
Weakness at the end of this week in market breadth points to the alternate hourly Elliott wave count possibly being correct. If price breaks below the green Elliott channel on the hourly charts, then expect a multi day pullback or consolidation is underway.
Pullbacks and consolidations at their conclusions offer opportunities to join the upwards trend.
Always trade with stops and invest only 1-5% of equity on any one trade.
Last monthly and weekly charts are here. Last historic analysis video is here.
MAIN ELLIOTT WAVE COUNT
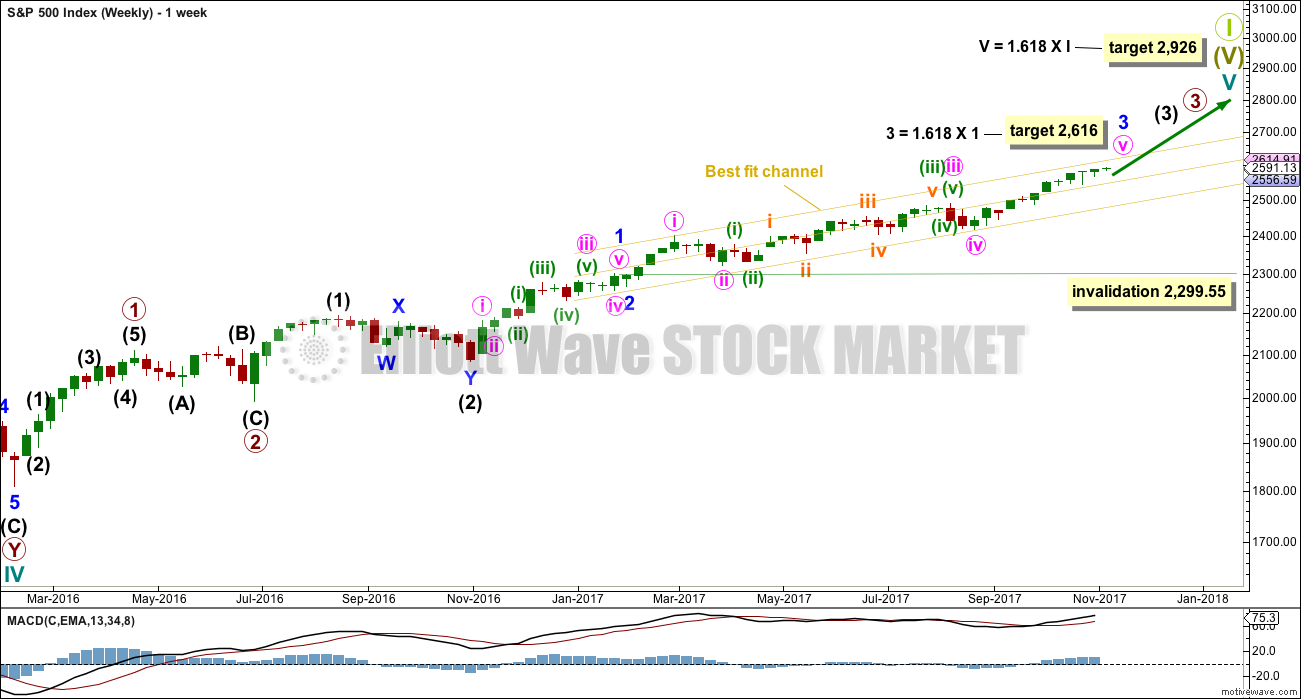
WEEKLY CHART
This wave count has strong support from very bullish On Balance Volume at the weekly chart level. While classic analysis is still very bullish for the short term, there will be corrections along the way up. Indicators are extreme and there is considerable risk to the downside still.
As a Grand Super Cycle wave comes to an end, weakness may develop and persist for very long periods of time (up to three years is warned as possible by Lowry’s for the end of a bull market), so weakness in volume may be viewed in that larger context.
When minor wave 3 is complete, then minor wave 4 should find support about the lower edge of the best fit channel. Minor wave 4 may not move into minor wave 1 price territory below 2,299.55.
The next reasonable correction should be for intermediate wave (4). When it arrives, it should last over two months in duration. The correction may be relatively shallow, a choppy overlapping consolidation, at the weekly chart level.
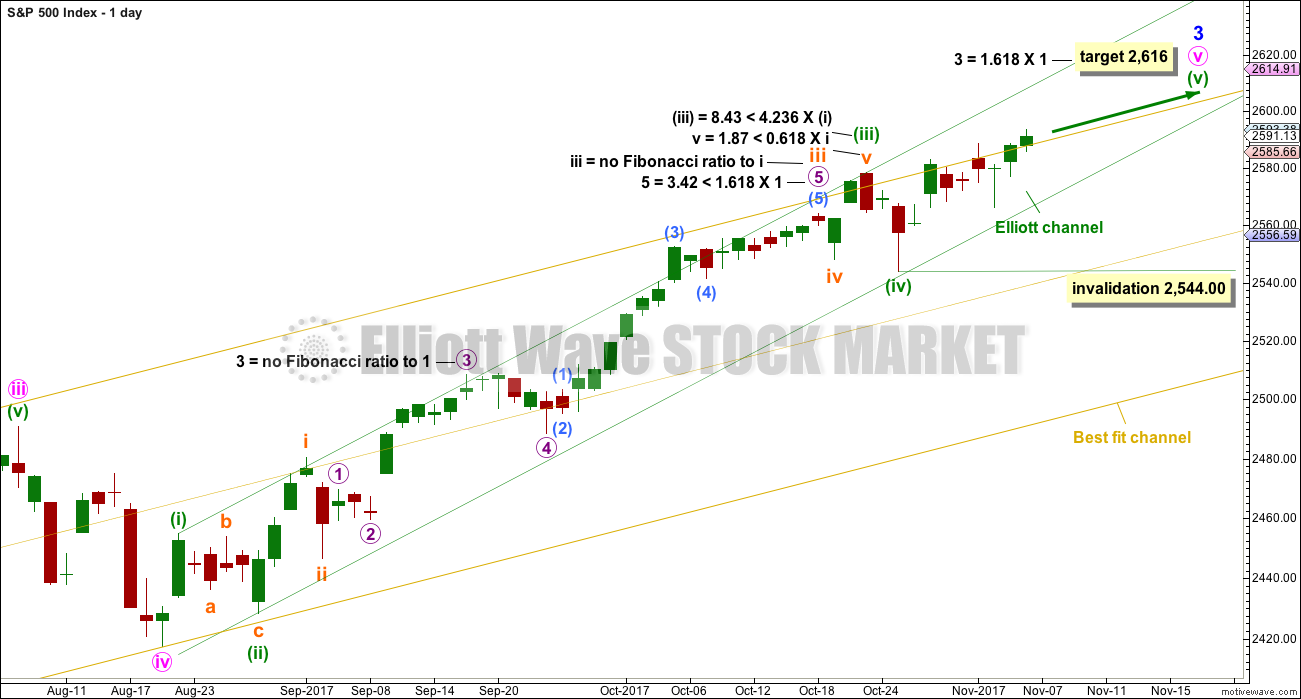
DAILY CHART
Minute wave v is completing as an impulse. The final fifth wave of minuette wave (v) is underway.
The target for minor wave 3 expects to see the most common Fibonacci ratio to minor wave 1.
Within minuette wave (v), no second wave correction may move beyond the start of the first wave below 2,544.00.
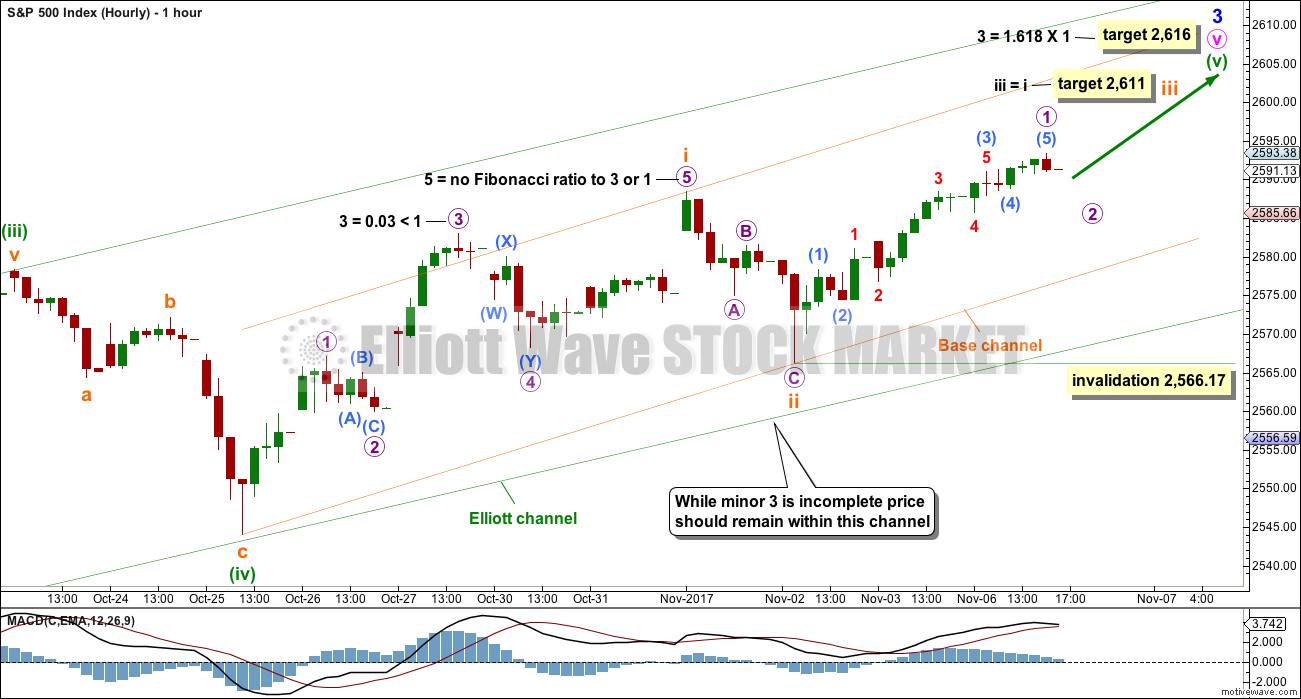
HOURLY CHART
Assume the trend remains the same until proven otherwise. Assume the trend remains up while price remains within the green channel and above 2,566.17.
Minuette wave (v) must subdivide as a five wave structure. It may be an impulse with subminuette waves i and ii complete.
This wave count expects to see a further increase in upwards momentum as a small third wave up unfolds.
From the start of subminuette wave iii, it looks now like another five up may be complete. This cannot be subminuette wave iii in its entirety as it has not yet moved far enough above the end of subminuette wave i to allow for room for a subsequent consolidation for subminuette wave iv to unfold and remain above subminuette wave i price territory.
Within the impulse of subminuette wave iii, only micro wave 1 may now be complete. Micro wave 2 may not move beyond the start of micro wave 1 below 2,566.17.
A breach of the green channel by downwards movement would be the earliest indication that this first wave count may not be correct. If that happens, then seriously consider the alternate hourly wave count below.
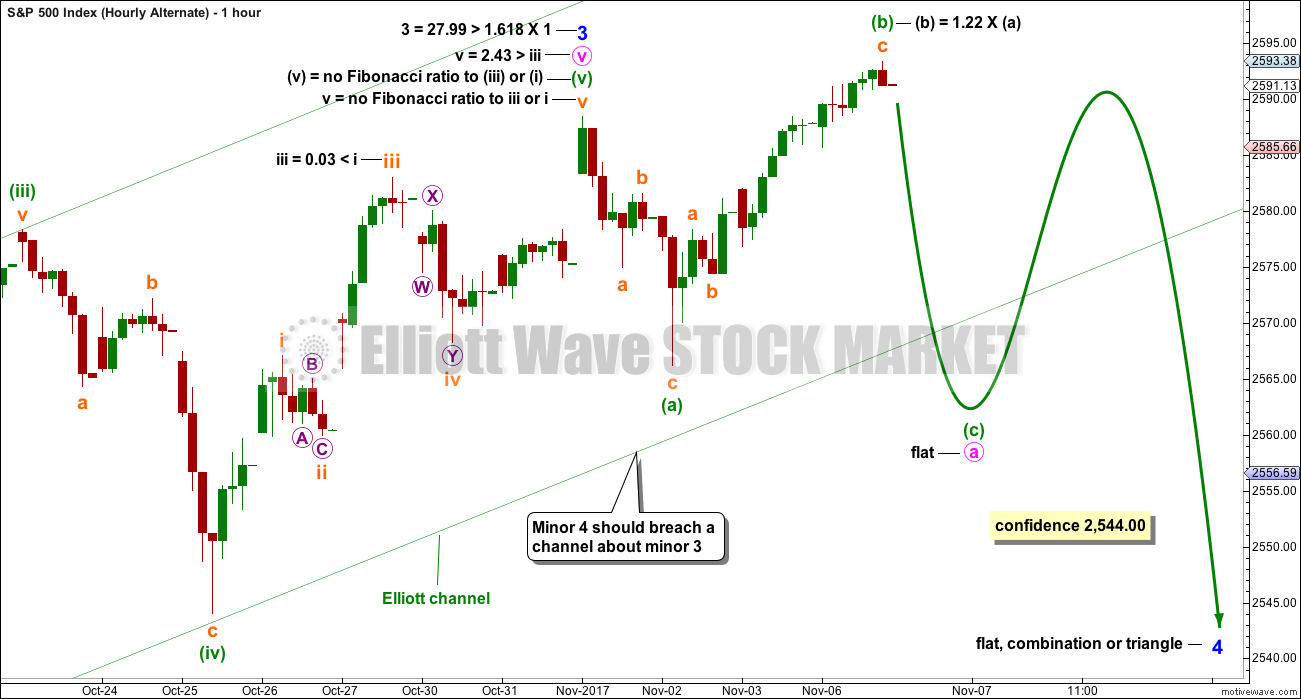
ALTERNATE HOURLY CHART
This alternate simply moves the degree of labelling within the last five up all up one degree. It is possible again that minor wave 3 could be over.
Minor wave 2 was a quick shallow 0.16 zigzag lasting just three days. Minor wave 4 should also show up at the daily chart level. It may be a sideways consolidation, subdividing as a flat, combination or triangle, to exhibit alternation with the zigzag of minor wave 2. These structures are often more time consuming than zigzags. So far minor wave 4 may have lasted six days and the structure would be incomplete. It may end in a total Fibonacci thirteen days.
A new correction at minor degree should begin with a five down at the hourly chart level. This has not happened, a three down only is complete. The probability of this wave count is reduced.
It is possible that minor wave 4 is beginning with a flat correction for minute wave a. Within the flat, minuette wave (b) has passed the minimum 0.9 length of minuette wave (a). The most common length for B waves within flats is from 1 to 1.38 times the length of the A wave. Here, minuette wave (b) is still within this common range.
There is reasonable support from volume for recent upwards movement. This reduces the probability of this wave count substantially; B waves should exhibit weakness and not strength.
This alternate is an unlikely scenario; it is only published to consider all possibilities.
TECHNICAL ANALYSIS
WEEKLY CHART
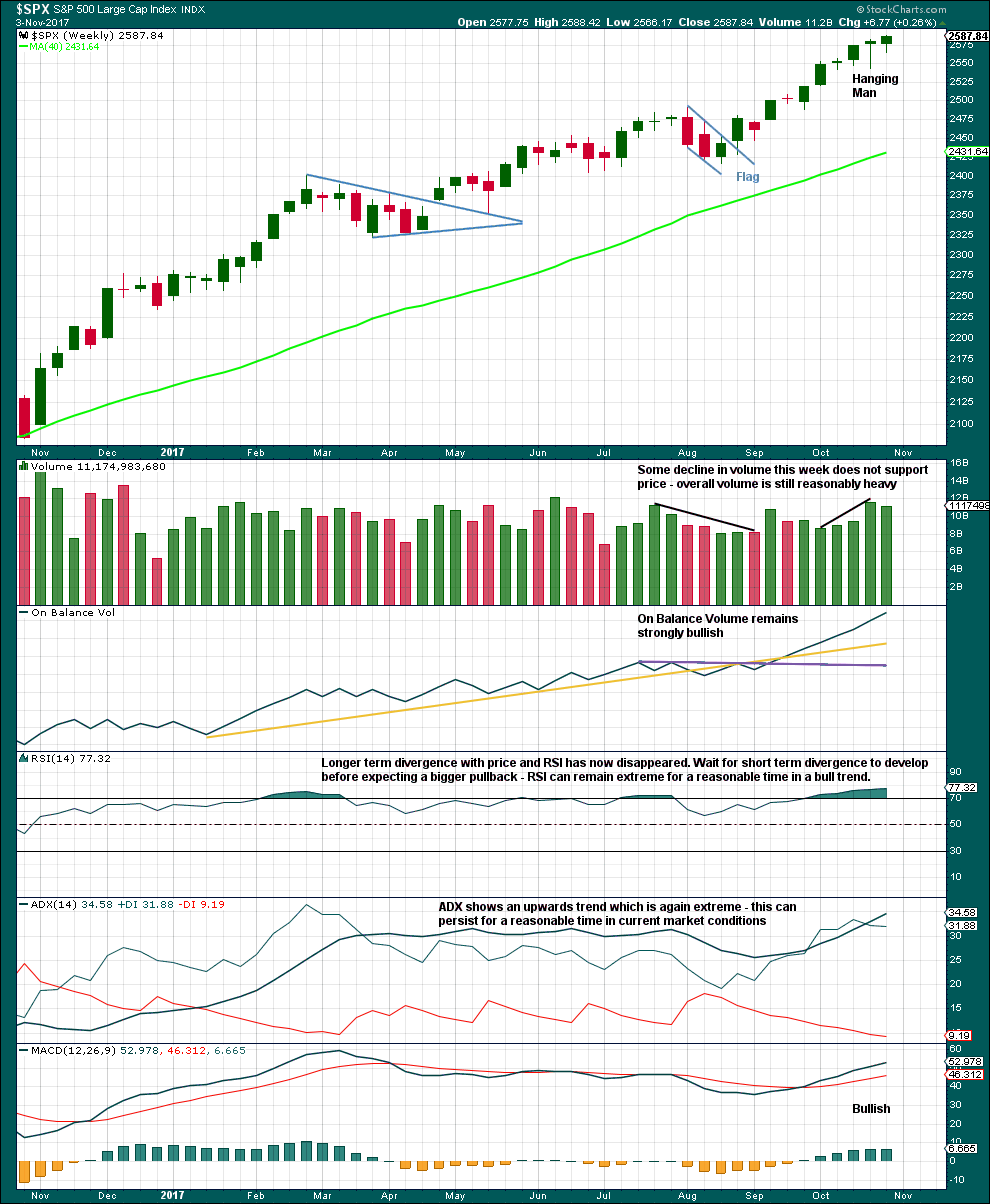
Click chart to enlarge. Chart courtesy of StockCharts.com.
The Hanging Man candlestick requires bearish confirmation because the long lower wick has a strong bullish implication. Last week has not given bearish confirmation, so the Hanging Man candlestick should not be read as a reversal signal.
Indicators are now extreme, but at this stage there is not enough weakness in price to indicate an end to the upward trend here. Extreme conditions for ADX and RSI may persist for several weeks while price continues higher.
DAILY CHART
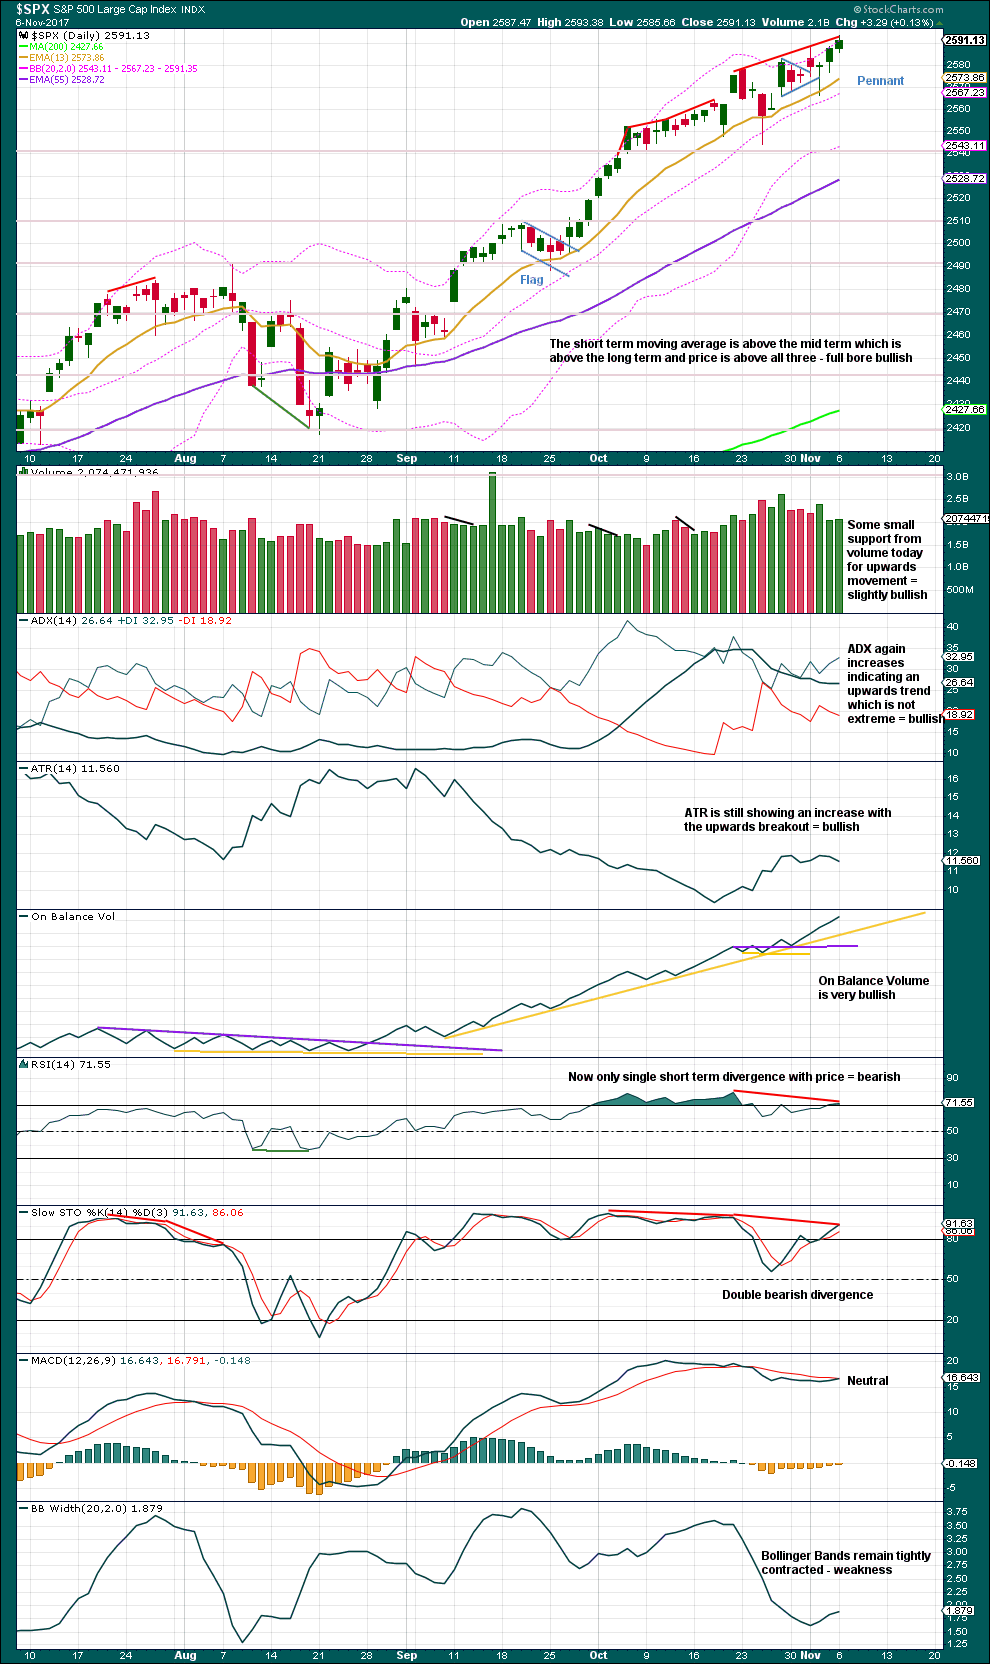
Click chart to enlarge. Chart courtesy of StockCharts.com.
Pennants are one of the most reliable continuation patterns. The measured rule calculates a target about 2,617. Because this is only one point off the Elliott wave target, this area may offer strong resistance.
This chart today is increasingly bullish. The trend is clearly up. Go with the trend. But risk management is essential, as always: with RSI and Stochastics both extreme, there is risk here of a pullback to resolve these conditions.
VOLATILITY – INVERTED VIX CHART
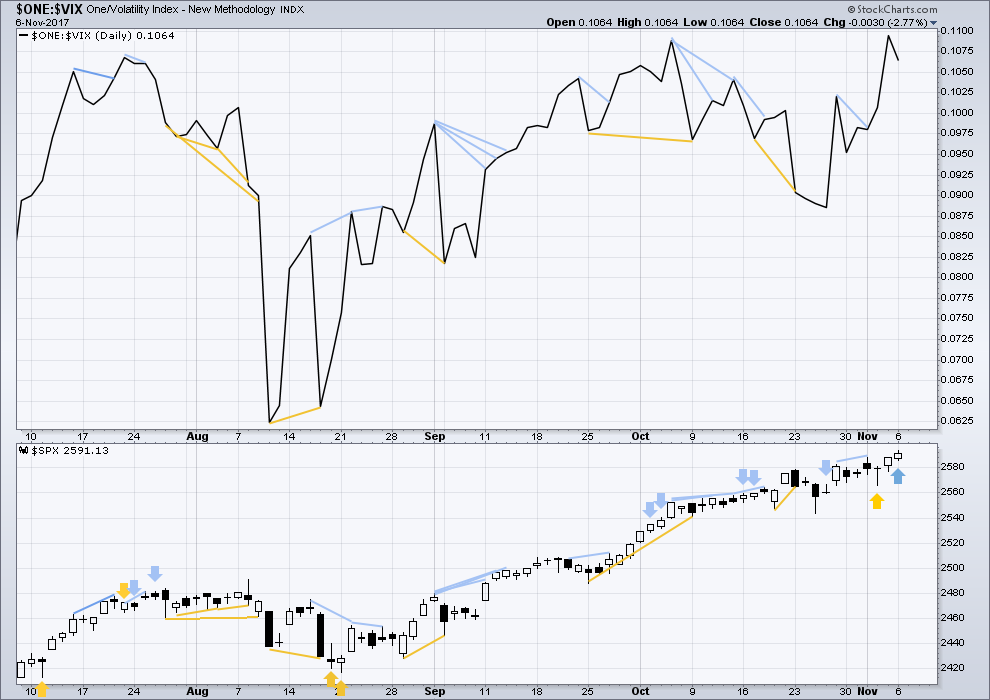
Click chart to enlarge. Chart courtesy of StockCharts.com.
Normally, volatility should decline as price moves higher and increase as price moves lower. This means that normally inverted VIX should move in the same direction as price.
Price moved higher today with a higher high and a higher low, and the candlestick closed green. But inverted VIX has moved lower as volatility increased. This is not normal with rising price. This indicates weakness within price today and interpreted as bearish.
BREADTH – AD LINE
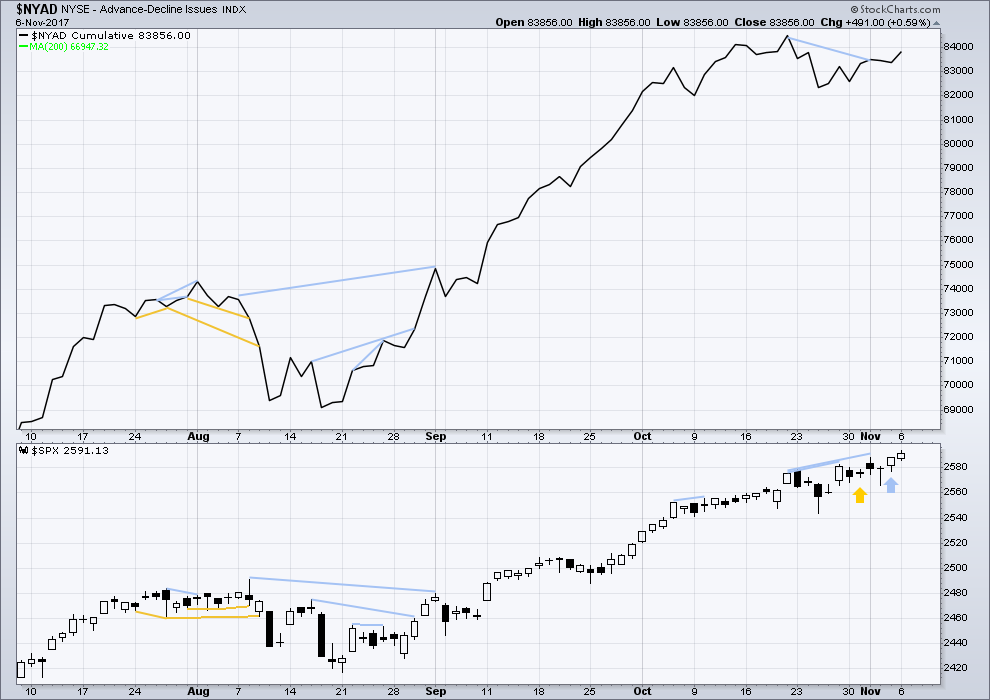
Click chart to enlarge. Chart courtesy of StockCharts.com.
There is normally 4-6 months divergence between price and market breadth prior to a full fledged bear market. This has been so for all major bear markets within the last 90 odd years. With no longer term divergence yet at this point, any decline in price should be expected to be a pullback within an ongoing bull market and not necessarily the start of a bear market.
There is no short term divergence between price and the AD line. Upwards movement during Monday’s session has some support from rising market breadth. There is still some mid term divergence back to the 20th of October. As minor wave 3 comes to an end, this should be expected.
Small caps have moved lower during last week failing to make new all time highs. Mid caps made their last all time high on Wednesday and have failed to make a new all time high for Friday. There is some very short term weakness within this market developing.
DOW THEORY
At the end of last week, only DJT failed to make a new all time high. The S&P500, DJIA and Nasdaq have made new all time highs. DJT has failed so far to confirm an ongoing bull market.
Failure to confirm an ongoing bull market should absolutely not be read as the end of a bull market. For that, Dow Theory would have to confirm new lows.
The following lows need to be exceeded for Dow Theory to confirm the end of the bull market and a change to a bear market:
DJIA: 17,883.56.
DJT: 7,029.41.
S&P500: 2,083.79.
Nasdaq: 5,034.41.
Charts showing each prior major swing low used for Dow Theory are here.
Published @ 06:20 p.m. EST.

Reloaded VIX 10.00 strike calls at 1.00 even…
bullish engulfing candle…
Hourly chart updated:
Another second wave unfolding offering potentially another opportunity to join the upwards trend. It should find strong support at the orange base channel, if this wave count is correct and minor 3 is incomplete. TA supports this view.
Kevin: I can see the possible A-B-C to todays low as a 5-3-5 on the 5 minute chart as you suggest.
BUT
I can also see it is 1-2-3-4-5 for A only, and now B upwards unfolding.
My labelling of my hourly chart above is based mostly on the look at the hourly time frame. Because micro wave 1 shows its subdivisions so clearly at this time frame, I’d expect micro wave 2 to do the same. That would give the wave count the right look at the hourly chart level.
Thanks for your detailed reasoning!! I’ll look forward to if/how this changes assuming C doesn’t make it below A (right now, appears not to be). Let the bull roar some more, please…suffice to say, I’m long!!
FYI, selling VIX 10.00 strike calls for 1.15 (cost basis 0.90).
Will re-buy below 10.00 (but you knew that!) 🙂
A key decision point for a turn here is 2482.86 or fairly close. I’ve got 3 symmetric projections to that area, and there’s the high from Oct 27 there, and it’s just above the 50%. I’ll be looking for buy triggers after a turn in that area.
I take an almost sick glee in seeing the market behave “properly” per EW and fractal geometry. The more you track it and anticipate it, the more confident you can trade it. The pullback today: perfect ABC, with A=C in length, and both A and C showing perfect 5 wave impulse structure. Sweet. I bought a unit of UPRO on the 2nd bounce off the A=C price point. Now, in theory, a 3 up is starting, implying these lows must hold. I may buy a 2nd unit after the 2 just starting turns back up. We’ll see!
The generic challenge I find in EW based trading is the risk that an ABC followed by an initial “1” in the opposite direction is in fact just a 4 of an impulse, and the ABC was really a 1-2-3. So for example if price here in SPX slams down to new lows, suddenly this “perfect” ABC is a perfect impulse down instead. This is where directional bias is dangerous; I tend to read these and trade these based on my directional bias. However, getting in on lows of 2’s is, in my book, the “best” EW trade by a significant margin. So the generic risk of ABC->12345 is just part of the game.
Yep Kevin, that’s the rub when trading according to EW. We can’t know when a structure (especially a corrective structure) is complete — until it is most certainly complete. And by then the next structure is already well underway.
My observation after many years as a student of EW is that only once in a great while does it show you with any certainty what *MUST* happen next. That doesn’t mean it isn’t helpful the rest of the time. It is.
But as can we see from Lara’s frequent re-labeling and use of alternate counts (which the prudent EW analyst must always do), moments of near perfect certainty are rare indeed.
An edge is all we can try to squeak out of it. My current concern is this ABC -> impulse up becomes instead a W-X-Y, with the X close to completion. I.e, the 2 down isn’t over. Vigilence….
This intraday bounce has exceeded 2588.95, so we know it is not a 4th wave in a downward impulse. There’s our edge. And it kinda, sorta, maybe looks corrective. So it might be a B or X, just like you’re thinking.
Or not…
Leading diagonal 1, and now a 2…? I’m watching for new long triggers on a turn above the ABC invalidation low.
My current roadmap. How low the micro 2 goes is the immediate question. Right now it’s holding at the 23.6%. Oops…no it’s not…
TICK
Wow, that’s a big change in the hourly count. I see why. What interests me is the “opportunity” it presents to the market for a sharp and relatively immediate break to the downside (tomorrow, or shortly). The invalidation point is now pretty far down! I knew there was a good reason lurking for being so aggressive with my stops today. We’ll see what tomorrow and Wednesday bring, but I’m quite suspicious we’ll get a deep 2 here, to the 61.8% (2576.6) or 78.6% (2572.1) most likely. I look at it as an opportunity to get much more long for what should be a great ride up here, overall.
Kevin,
Some other analysis I saw yesterday calls for market to rap higher (NDX from its current level to 6700) SPX projected at 2700+ before the year end. If the markets do go down it might be triggered by the TAX reform or some such news. I am now assessing the best way to position myself while protecting from any event related panic.
To get some “protection” against panic I’ve settled for the moment on some VIX April call options in the “money” (strike of 9). I figure VIX can go lower…but at a very, very slow (asymmtotic?) rate, even as SPX goes “straight up”. So as I see it, the time premium decay is by far the biggest risk there, vs. intrinsic value loss. It’s a gamble but all insurance is. I didn’t buy much; it’s an experiment for me more than anything.
Ripping higher indeed!!! So much for my notions of a sharp 2 down…but I’ll take a straight up market after a tiny 2 down, sure!! (Or does that little blip even qualify as a 2?)
Kevin,
As I understand the current action with Momentum buyers all over the FAANG and other hot stocks, it will take a surprise event to trigger some selling. Interesting enough the smart money is not making any effort to force a selloff.:)
Well, just a final head fake on the overall up move. Micro 2 time now for sure. How low it’ll go remains to be seen, but if Nov 1-2 is any indication, it’s not close to done yet. However, that was a subminuette 2, and this is only a micro 2, so maybe it’s even done now. TBD!!
Early bird today…
wow,, one minute,, thats an early bird for sure
Dodo Bird! 😀
I resemble that!!!
Awww! Quit yer quacking! 🙂
Besides, aren’t you extinct?!