
Upwards movement continues exactly as the main Elliott wave count and classic technical analysis expected.
On Balance Volume continues to be very bullish. The targets remain the same.
Summary: The Elliott wave target is at 2,616 and a target from a small pennant pattern is 2,617. The upwards trend has support from very bullish On Balance Volume.
However, assume the trend remains the same until proven otherwise. The trend is up.
Weakness at the end of this week in market breadth points to the alternate hourly Elliott wave count possibly being correct. If price breaks below the green Elliott channel on the hourly charts, then expect a multi day pullback or consolidation is underway.
Pullbacks and consolidations at their conclusions offer opportunities to join the upwards trend.
Always trade with stops and invest only 1-5% of equity on any one trade.
Last monthly and weekly charts are here. Last historic analysis video is here.
MAIN ELLIOTT WAVE COUNT
WEEKLY CHART
Click chart to enlarge.
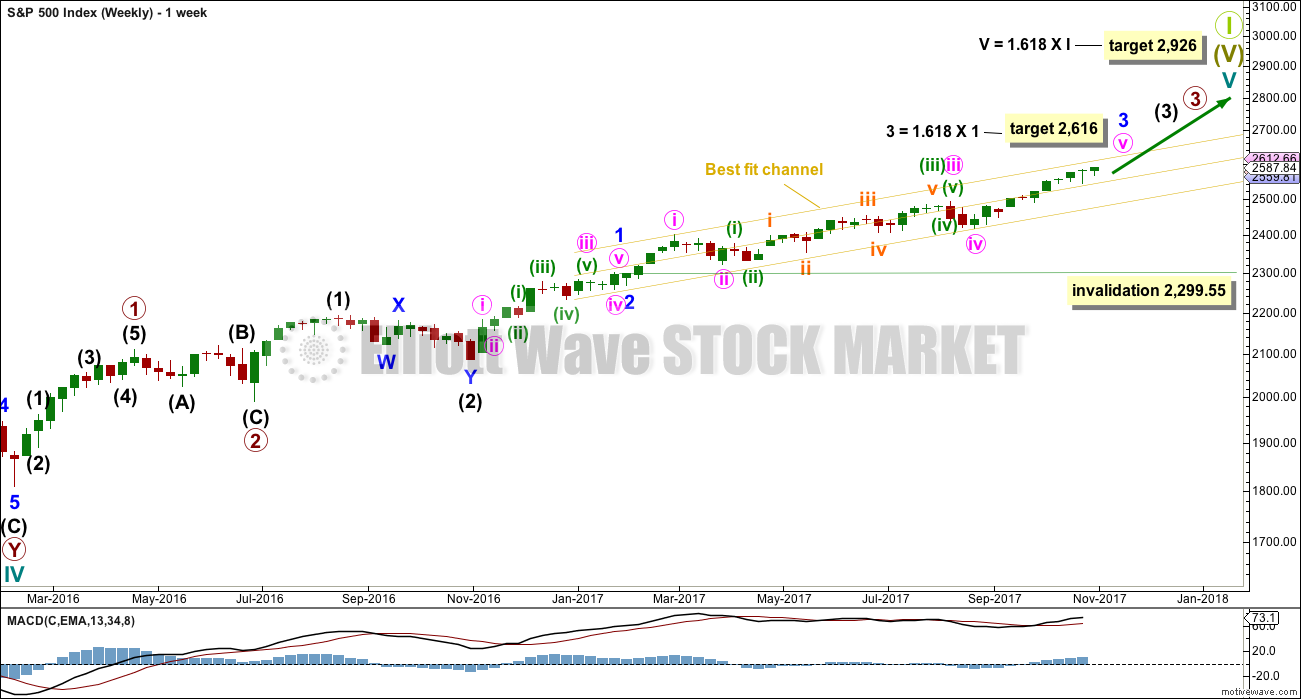
This wave count has strong support from another bullish signal from On Balance Volume at the weekly chart level. While classic analysis is still very bullish for the short term, there will be corrections along the way up. Indicators are extreme and there is considerable risk to the downside still.
As a Grand Super Cycle wave comes to an end, weakness may develop and persist for very long periods of time (up to three years is warned as possible by Lowry’s for the end of a bull market), so weakness in volume may be viewed in that larger context.
When minor wave 3 is complete, then minor wave 4 should find support about the lower edge of the best fit channel. Minor wave 4 may not move into minor wave 1 price territory below 2,299.55.
The next reasonable correction should be for intermediate wave (4). When it arrives, it should last over two months in duration. The correction may be relatively shallow, a choppy overlapping consolidation, at the weekly chart level.
DAILY CHART
Click chart to enlarge.
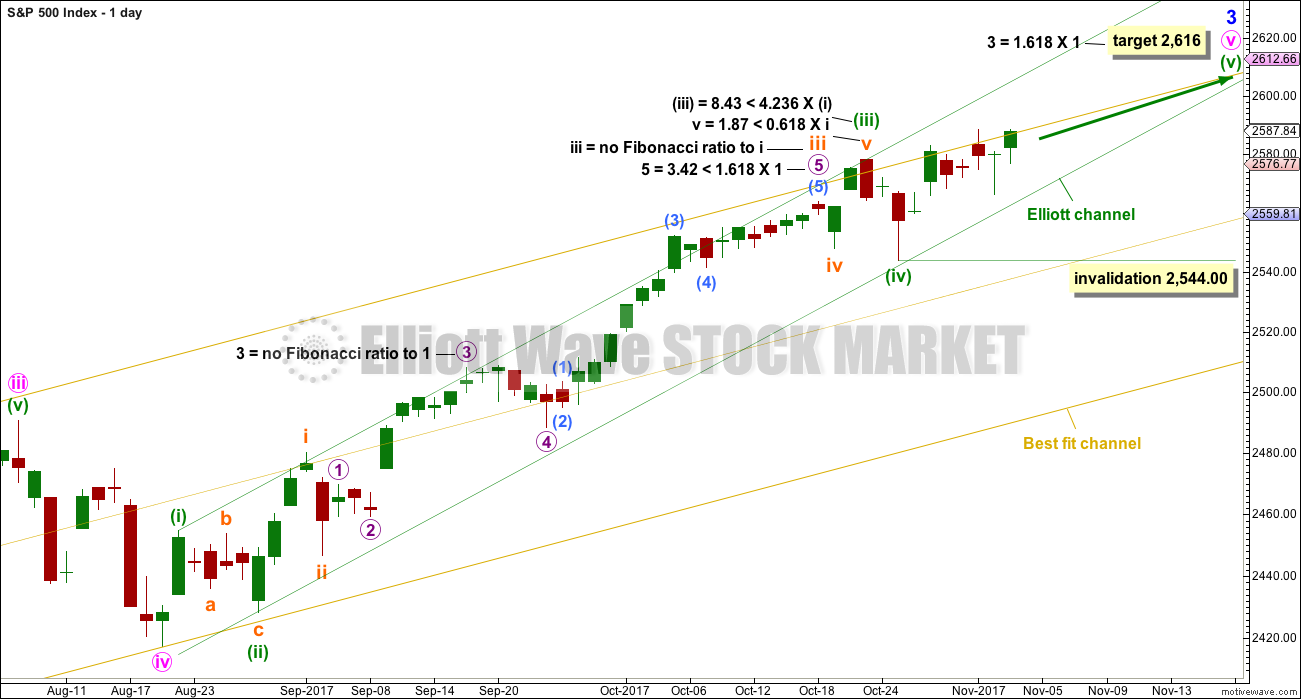
Minute wave v is completing as an impulse. The final fifth wave of minuette wave (v) is underway.
The target for minor wave 3 expects to see the most common Fibonacci ratio to minor wave 1.
Within minuette wave (v), no second wave correction may move beyond the start of the first wave below 2,544.00.
HOURLY CHART
Click chart to enlarge.
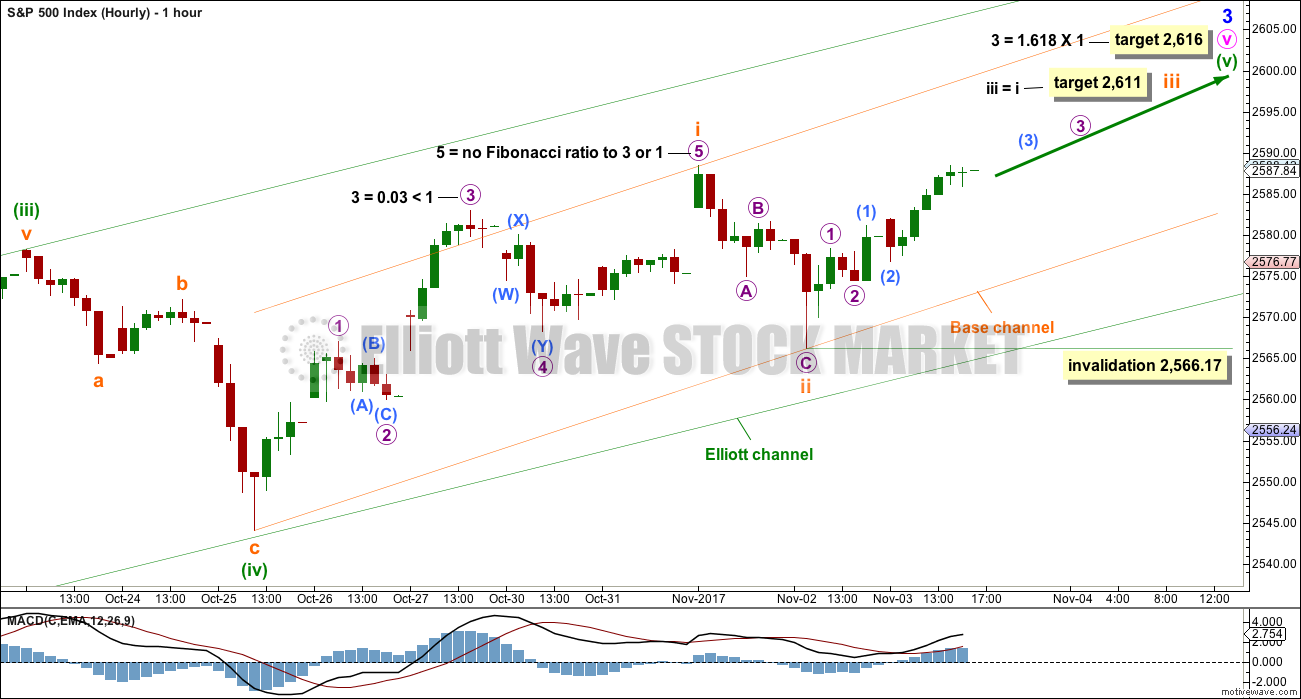
Assume the trend remains the same until proven otherwise. Assume the trend remains up while price remains within the green channel and above 2,544.
Minuette wave (v) must subdivide as a five wave structure. It may be an impulse with subminuette waves i and ii complete. Subminuette wave ii now looks like a completed three wave zigzag.
This wave count expects to see a further increase in upwards momentum as a small third wave up unfolds.
Within subminuette wave iii, no second wave correction may move beyond its start below 2,566.17.
A breach of the green channel by downwards movement would be the earliest indication that this first wave count may not be correct. If that happens, then seriously consider the alternate hourly wave count below.
ALTERNATE HOURLY CHART
Click chart to enlarge.
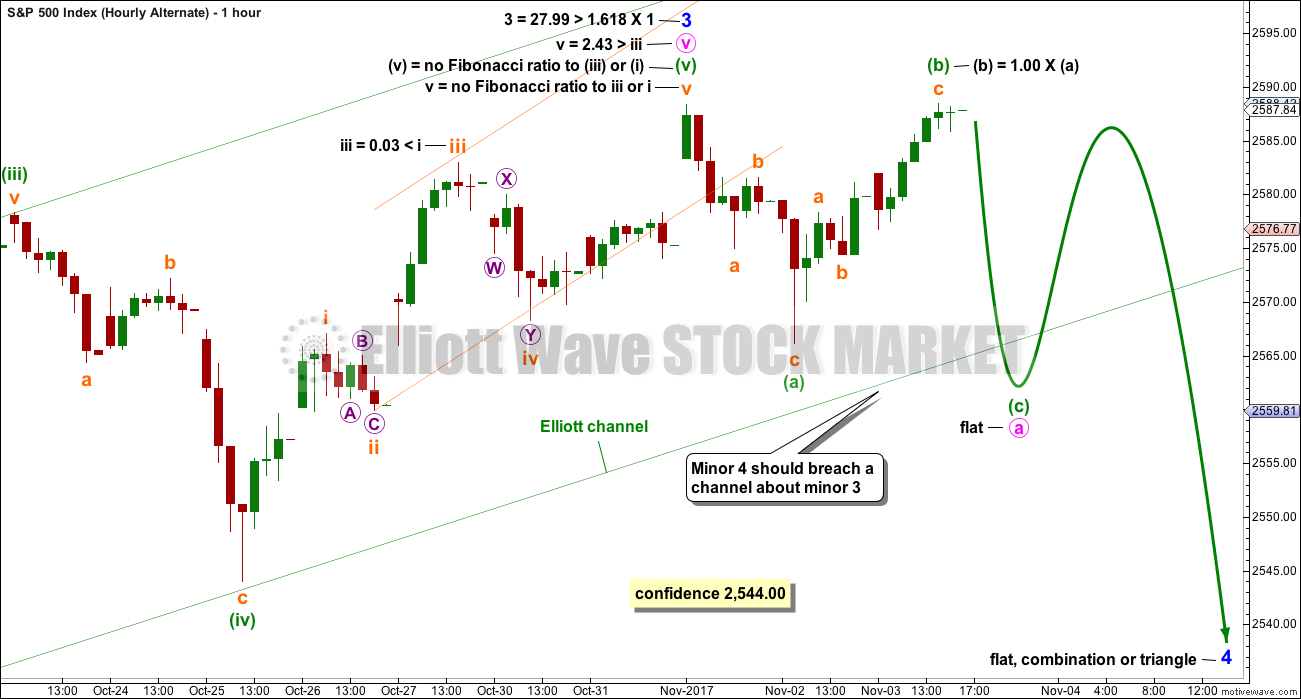
This alternate simply moves the degree of labelling within the last five up all up one degree. It is possible again that minor wave 3 could be over.
Minor wave 2 was a quick shallow 0.16 zigzag lasting just three days. Minor wave 4 should also show up at the daily chart level. It may be a sideways consolidation, subdividing as a flat, combination or triangle, to exhibit alternation with the zigzag of minor wave 2. These structures are often more time consuming than zigzags. So far minor wave 4 may have lasted five days and the structure would be incomplete. It may end in a total Fibonacci eight or possibly even thirteen days.
A new correction at minor degree should begin with a five down at the hourly chart level. This has not happened, a three down only is complete. The probability of this wave count is reduced.
It is possible that minor wave 4 is beginning with a flat correction for minute wave a. Within the flat, minuette wave (b) has passed the minimum 0.9 length of minuette wave (a). Minuette wave (b) may continue higher above the start of minuette wave (a) at 2,588.40 as in an expanded flat.
Upwards movement during Thursday’s session has some reasonable support from volume. This reduces the probability of this alternate wave count; B waves should exhibit weakness, not strength.
TECHNICAL ANALYSIS
WEEKLY CHART
Click chart to enlarge. Chart courtesy of StockCharts.com.
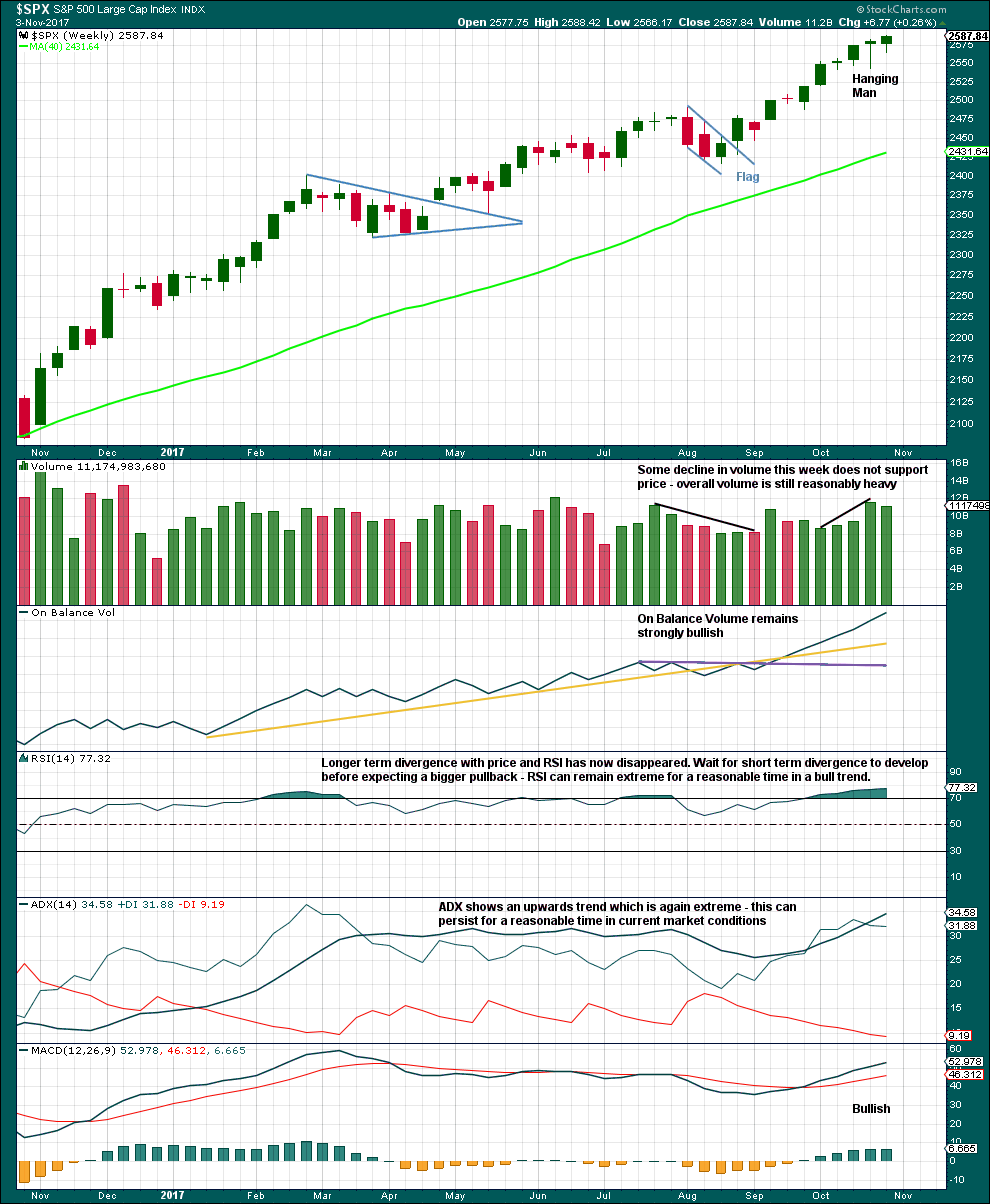
The Hanging Man candlestick requires bearish confirmation because the long lower wick has a strong bullish implication. This week has not given bearish confirmation, so the Hanging Man candlestick should not be read as a reversal signal.
Indicators are now extreme, but at this stage there is not enough weakness in price to indicate an end to the upward trend here. Extreme conditions for ADX and RSI may persist for several weeks while price continues higher.
DAILY CHART
Click chart to enlarge. Chart courtesy of StockCharts.com.
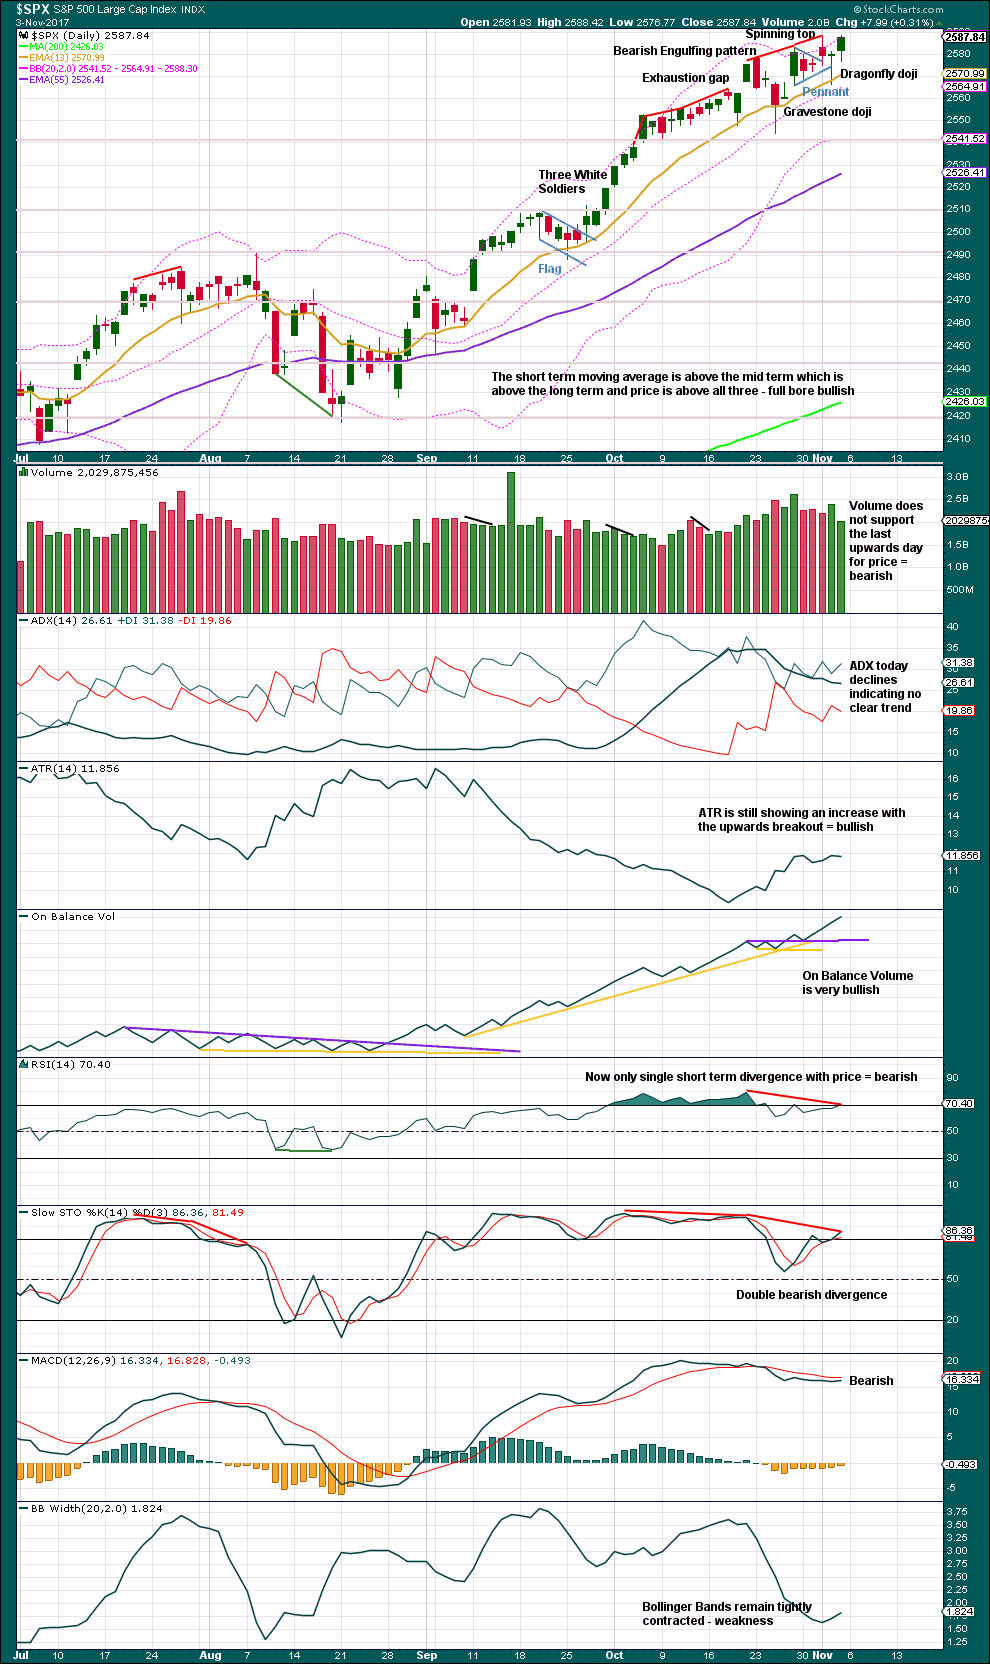
Pennants are one of the most reliable continuation patterns. The measured rule calculates a target about 2,617. Because this is only one point off the Elliott wave target, this area may offer strong resistance.
On Balance Volume remains very bullish. Volume today shows some decline, but this can persist for reasonable periods of time in current market conditions while price may continue to rise. On its own, this decline in volume signals a warning of weakness, but it will not be useful in timing an end to this upwards movement.
There is less weakness evident today as double divergence between price and RSI now becomes only single divergence. This divergence indicates some weakness here in price, but again it will not be useful as a timing tool to show when price has found a high.
On Balance Volume will be given the most weight in this analysis because it remains one of the most reliable indicators in current market conditions.
VOLATILITY – INVERTED VIX CHART
Click chart to enlarge. Chart courtesy of StockCharts.com.
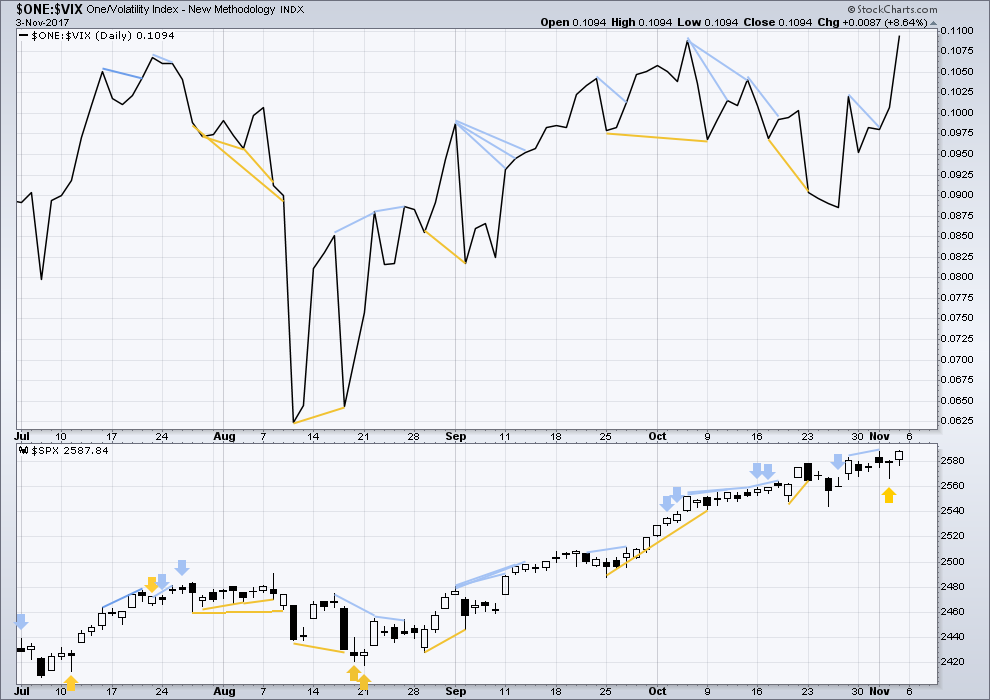
Normally, volatility should decline as price moves higher and increase as price moves lower. This means that normally inverted VIX should move in the same direction as price.
Bullish divergence noted in last analysis has now been followed by an upwards day to a new all time high for price. This divergence may now be resolved or it may need one more upwards day to resolve it.
There is no new divergence today. Both price and inverted VIX have made new all time highs. The rise in price today has come with a normal corresponding decline in volatility. This is bullish.
BREADTH – AD LINE
Click chart to enlarge. Chart courtesy of StockCharts.com.
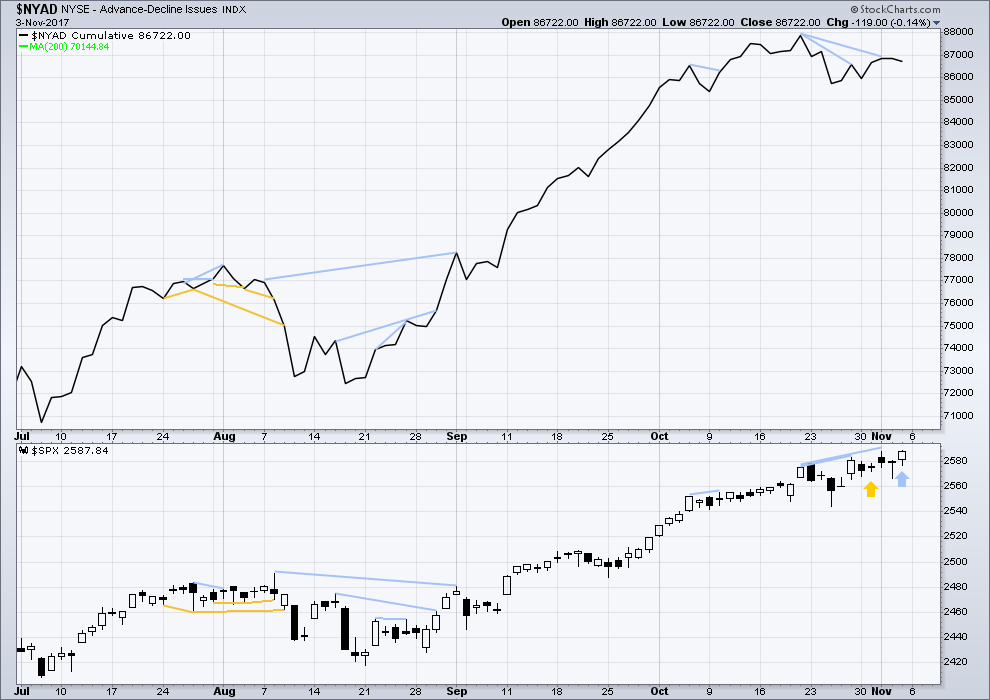
There is normally 4-6 months divergence between price and market breadth prior to a full fledged bear market. This has been so for all major bear markets within the last 90 odd years. With no longer term divergence yet at this point, any decline in price should be expected to be a pullback within an ongoing bull market and not necessarily the start of a bear market.
There is new bearish divergence today between price and the AD line: price has moved higher to make a new all time high, but the AD line has moved lower for the session. The rise in price did not have support from rising market breadth, so this divergence is bearish and points to a red daily candlestick for Monday and / or Tuesday.
Small caps have moved lower during this week failing to make new all time highs. Mid caps made their last all time high on Wednesday and have failed to make a new all time high for Friday. There is some very short term weakness within this market developing.
DOW THEORY
At the end of this week, only DJT has failed to make a new all time high. The S&P500, DJIA and Nasdaq have made new all time highs. DJT has failed so far to confirm an ongoing bull market.
Failure to confirm an ongoing bull market should absolutely not be read as the end of a bull market. For that, Dow Theory would have to confirm new lows.
The following lows need to be exceeded for Dow Theory to confirm the end of the bull market and a change to a bear market:
DJIA: 17,883.56.
DJT: 7,029.41.
S&P500: 2,083.79.
Nasdaq: 5,034.41.
Charts showing each prior major swing low used for Dow Theory are here.
Published @ 06:12 p.m. EST.
[Note: Analysis is public today for promotional purposes. Member comments and discussion will remain private.]
I often mention market cap to revenue and how extremely overvalued this market is.
Here is a Chart of it:
http://www.zerohedge.com/sites/default/files/images/user3303/imageroot/2017/11/04/20171106_huss1.jpg
Another extremely BORING Day!
Sold IYT December 172 strike puts for 2.20 (bought last week @ 0.90…premiums are popping!)
That’s an awfully strong breakout on an already very bullish couple of weeks, on the weekly chart of ERX. I like the intermediate term (3-10 week) opportunity in energy. Working it intraday and scored nicely today, but I think there’s an opportunity to play it for the intermediate term here too.
Hackers? Stockcharts.com and also Schwab market data intermittent.
Or maybe something on my end? Not sure.
Schwab just took me off line too….think I’ll just stay that way for awhile
Oops… put the updated hourly chart on the wrong analysis. Here it is in the right place folks.
Main hourly chart updated.
Now, I could also move the degree of labelling within subminuette iii down one degree. It may be a longer extension and only micro 1 may be completing. Just so everybody knows it’s not possible at this time for me to be sure of the degree of labelling within this move.
It makes no difference at this time to the targets. Only invalidation points. But I want to pull up the invalidation point so it’s actually useful in trading.
Micro 4 may not move into micro 1 price territory.
I’m off to get a quick wobbly wave in the watery thing…. back just after NY close. Have fun people!
Life is rough…and then you go surfing!! Shred it…
Based on this count we’d expect a top of this wave 3 up fairly soon, as we’re now in the final up to complete it. I have a 1.27% extension of the last downmove and a symmetric projection of a recent upmove coming in between 2994 and 2995.5. I’ll be watching for a possible start of a larger iv there. However, if it does start there…the high of the corresponding i is quite close at 2588. Which does give me pause re: whether the two little 4’s in the count above are satisfactory. Or, the target for this 5 is much higher than my two projections. We’ll see how it plays out.
Monday reading from Northy:
“The message: Somebody is selling this market. Every day.
And it’s very cleverly done as to not disturb the seeming tranquility in markets.”
https://northmantrader.com/2017/11/05/the-deflating-rally/
Microcharts
https://northmantrader.com/2017/11/06/november-macro-charts/
Here’s a question for you financial experts. Let’s say that you (1) cannot buy/sell options (I’m trading an IRA -> no margin, no options). Let’s say you (2) believe there is a significant risk (25-50% over the next year) of war on the Korean peninsula, likely to go nuclear when it happens. Lastly, let’s assume that said war breaks out “instantly”, giving no time in advance to adjust market positions. Question: what’s the “best” way to hedge against this, with minimal cost?? My take (could be way wrong which is why I’m asking!!): buy and hold gold (GLD works). Why? Downside overall is rather limited, even in this strong bull market, but when the s-hits-the-f…GLD should skyrocket, while the market tanks. Thanks for your insights. (No, I ‘m not interested in debating my assessment of the situation, I only care to learn how to manage what I believe is likely to maximize my aggregate return if/when this come to pass).
If there is a war there… it will not go nuclear!
They said that through the 1980’s… going nuclear could happen with one miscalculation then. Not in this current situation.
That nut in NK… will be wiped out rather quickly and so will be his nuclear capability. If you allow this guy to actually obtain the capability that others have… only then you have a nuclear situation.
It’s impossible to hedge or plan for these geopolitical risks. They don’t have long-lasting effects on the market anyway… so it’s best to ignore them.
We had a great Bull market in the 1980’s, despite geopolitical risks and had fantastic GDP growth despite a market crash of 25% in two days in the middleish of the Bull initial waves.
Okay.
If you wanted to hedge long positions against some/any kind of sharp market reversal, what might you use? That’s the question. Maybe there is no “good” instrument? What about gold in this regard?
Gold proved in 2008 that it would not offset when all goes to hell. Everything went down!
Put on a 3 Times short ETF on whatever it is that you are long or options on that ETF. But 2 to 3 months is about the max time frame to hold it or you get material erosion in price vs the underlying index. Your timing has to be good when you put it on. Can Buy in IRA’s.
I would like to hear other thoughts on the topic.
Kevin,
IMO….a leveraged volatility ETF or ETN would be effective….UVXY or TVIX….and both are very liquid.
If your charting software allows put up $SPX as the primary ticker, then layer the TVIX or UVXY ticker in behind in a different color….you’ll see how inverse they are. If you need to see a chart let me know and I’ll post it here.
Mike
Thanks. I’m quite aware of the relationship of volatility to SPX. If I could outright buy the VIX, that would be perfect, as it continues to fall assymptotially, while the SPX goes “straight up” if you will. However, the futures based ETFs/ETNs have horrendous price degradation due to futures contango, and are only usable as extremely short term instruments IMO. I suppose buying very long term (1 year + ??) calls on the VIX outright (if available) is a strategy, as I believe I can buy calls. However, I was hoping to do “better”, i.e., an instrument that is more neutrally correllated to rising SPX, but will respond strongly positively on a significant SPX correction. Dreaming, I suspect!!
Kindly let us know when you find it!
Lol!!!!! You can count on it. For the moment, I’ll just hold on to my gold position as the best (but far from perfect) solution.
Not “found it”, but longer term (April expiration) VIX calls at a strike of 9 seems like a not-unreasonable solution.
A 3 Times Short ETF on the S&P 500 or DJIA or NDX or RUT all are available. A 2 Times short would also work. 1 to 1 also available.
Pro Shares have these… so do other ETF Groups. All very liquid.
Kevin, I can’t contribute to your bigger question but, as an aside, I am able to trade options in my IRA. I can’t sell options (no margin) but do buy calls and puts. I use TradeStation, but my friend trades options with TD Ameritrade in his IRA account.
Thanks Ron. Yes, I believe I can buy and sell calls and puts. Only. That said, I’m just not interested at this time in the additive complexities of such financial instruments. I don’t need the leverage. I hate the time decay (I view time as a critical asset, for the simple reason that “I’m not in a rush” to garner profits!). Etc. So I’m looking for a straightforward way to hedge with minimal cost, yet with significant effectiveness. No one has said anything about the pro’s/con’s of gold in this regard, which is my core question (along with what other/better alternatives might be out there).
Here’s one very strong “no” I found in a financial media article:
“Over the past 20 years, FactSet data show 23 weeks in which the S&P fell 5 percent or more; gold’s average move over those weeks was a 0.16 percent rise.
Gold, then, may serve an important function as a “portfolio paperweight,” refusing to bow to the moves of the equity market. But using the past few weeks as proof that buying gold is the same thing as buying portfolio protection would be a terrible mistake caused by short-sightedness.”
Hmmm.
I love it when EW works like clockwork, and it’s working now. Finished the first of what should be 2 small “4’s” before hitting the target up in the 26-teens. Another small 4 upcoming, a final push up…then it’s minor 4 time, but until then, the bull is roaring as predicted by Lara’s analysis.
Futures down a bit but nothing to get too excited about…so far.
The interesting thing is that the new 52 week low in VIX I was hoping to see, certainly what would be a back -up- the- truck moment, may not materialize. I really don’t care much what unfolds. Either we get another nice pop in VIX at the open with a 15-20 % on the ten strike calls, or the erstwhile banksters predictably dump cash into the futures market and bid them into the green prior to the open. If the latter happens, as well it might, then in that case we certainly see a new 52 week low print for VIX. A few people opined that this event would be of no significance, same as the last time, YADA YADA YADA….
Let’s see, we have BOTH the most massive short vol trade active in the history of markets, and VIX at almost if not THE CHEAPEST it has ever been in market history, and that is of no significance?!
I think it is time for me to take a little break….see everyone next week and have a great time trading the new month everyone! 🙂
There is sn old adage about traders keeping their mouth shut about what trsdes are working for them since as soon as you start talking about them and everyone starts doing the same thing, it no longer works. I know Chris is aware of this and hope he does not mind my explicitly pointing it out and since I won’t be posting as much this week, I am going to give this hint. Go back and look at the closing levels for VIX each of the last seven Fridays. I know some of you will, but most won’t. The theme will be obvious. Spotting these patterns is one way to give yourself a slight edge as a trader….
Well my critique was just that I fail to see why a new 52-week intraday low would be of utmost importance. Price and volatility can and do diverge for years. I also maintain the belief that a closing VIX low is more useful than an intraday VIX low, and we set a new closing VIX low on Friday.
If you look at VIX price action, what you see is a falling wedge. We have had one false break above the wedge’s upper boundary with price now back below it, an early warning. When that happens, price generally establihes a double bottom, and at the intra-day low of 8.99 on Friday, we are quite close. Of course, if you think that with all the other signals the market is throwing off that price volatility divergence will continue “years an years….”….well, what do I know? 🙂
Well, back to my break….be careful out there.
It got below 23400 only to be saved again…..it’s really pathetic
Have a great week Verne.
Better than an ABSURD bird!
Oh my, that makes me the Turd bird!
ROTFL!!!! 🙂
BIG BIRD! 🙂
Early bird!