
A very small range inside day changes the very short term picture only slightly. The Elliott wave targets remain the same and can today be supplemented by a classic analysis target using a reliable short term pattern.
Summary: The Elliott wave target is at 2,616 and a new target from a small pennant pattern is 2,617. Volume and On Balance Volume support this view, and the AD line today also supports this view.
Pullbacks should be used as opportunities to join the upwards trend.
If price makes a new low below 2,544, then a pullback should be expected to be underway. The target is at 2,533 to 2,527. This view has very little support today.
Last monthly and weekly charts are here. Last historic analysis video is here.
MAIN ELLIOTT WAVE COUNT
WEEKLY CHART
Click chart to enlarge.
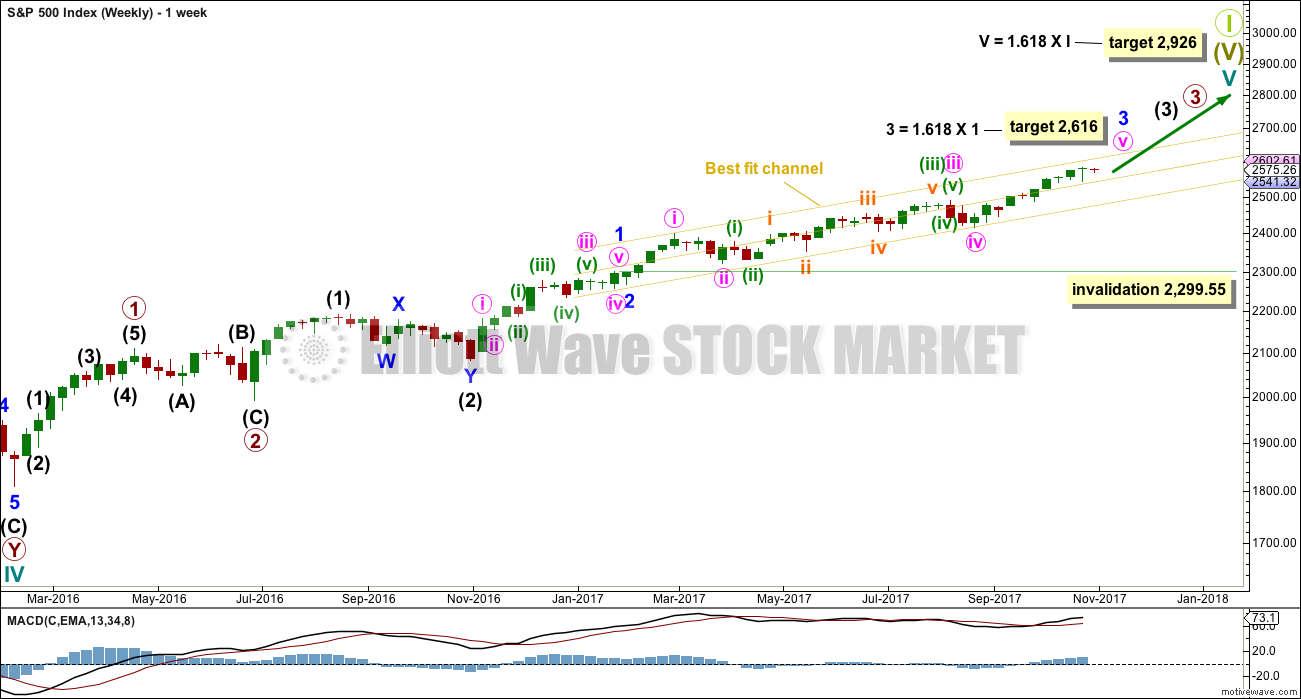
This wave count has strong support from another bullish signal from On Balance Volume at the weekly chart level. While classic analysis is still very bullish for the short term, there will be corrections along the way up. Indicators are extreme and there is considerable risk to the downside still.
As a Grand Super Cycle wave comes to an end, weakness may develop and persist for very long periods of time (up to three years is warned as possible by Lowry’s for the end of a bull market), so weakness in volume may be viewed in that larger context.
Within minute wave v, no second wave correction may move beyond the start of its first wave below 2,417.35.
The next reasonable correction should be for intermediate wave (4). When it arrives, it should last over two months in duration, and it may find support about the lower edge of this best fit channel. The correction may be relatively shallow, a choppy overlapping consolidation, at the weekly chart level.
DAILY CHART
Click chart to enlarge.
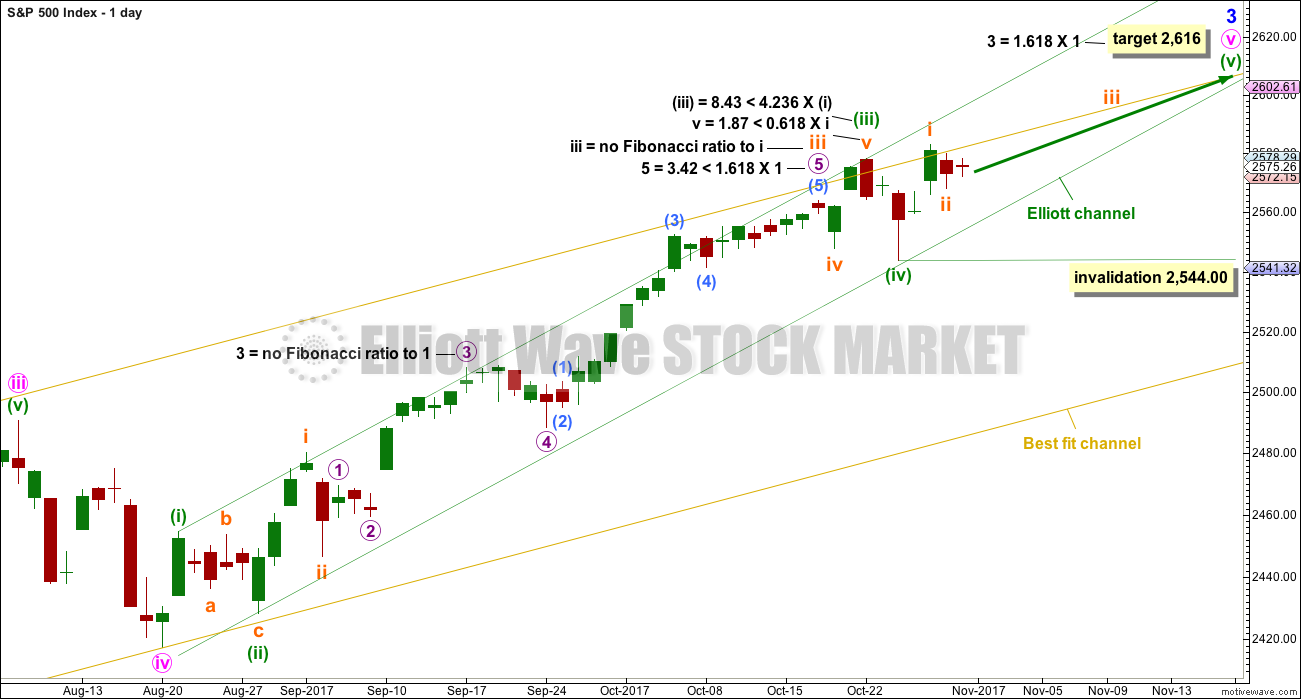
Friday looks like a classic upwards breakout from a small consolidation. A breakout is a bullish signal.
The target for minor wave 3 expects to see the most common Fibonacci ratio to minor wave 1.
Within minuette wave (v), no second wave correction may move beyond the start of the first wave below 2,544.00.
Fibonacci ratios for this main wave count are better than for the alternate. This increases the probability of this main wave count slightly.
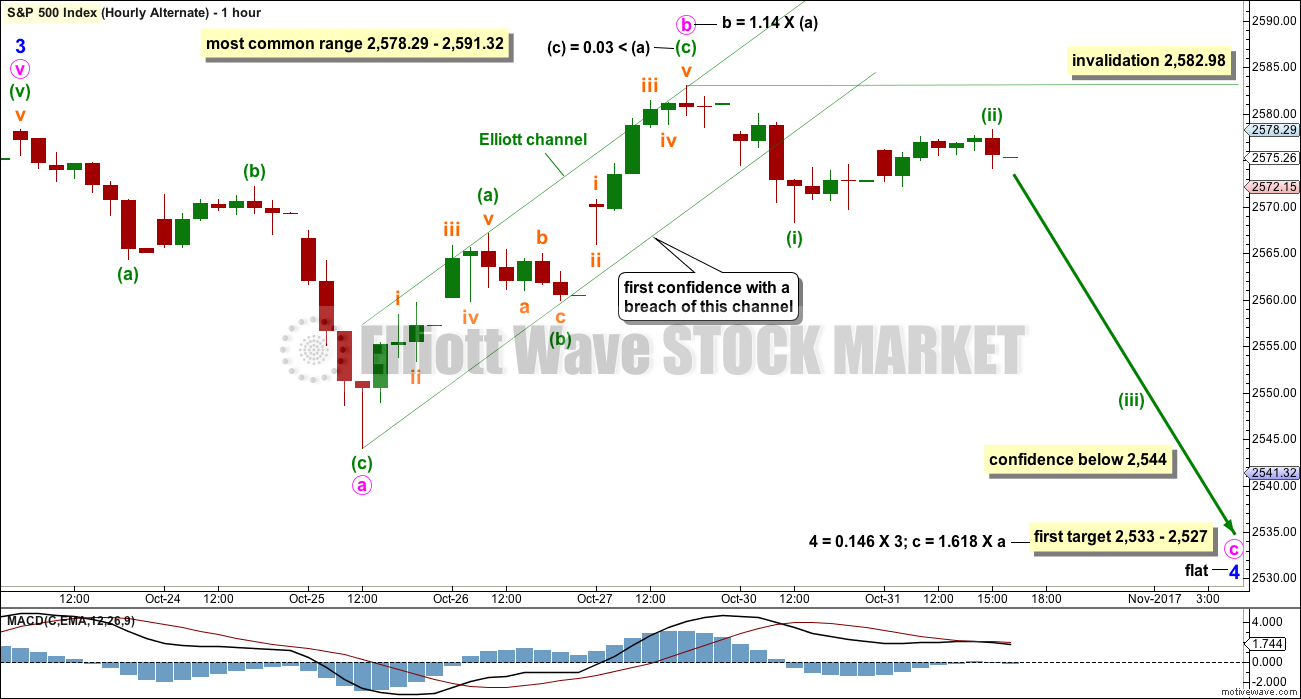
HOURLY CHART
Click chart to enlarge.
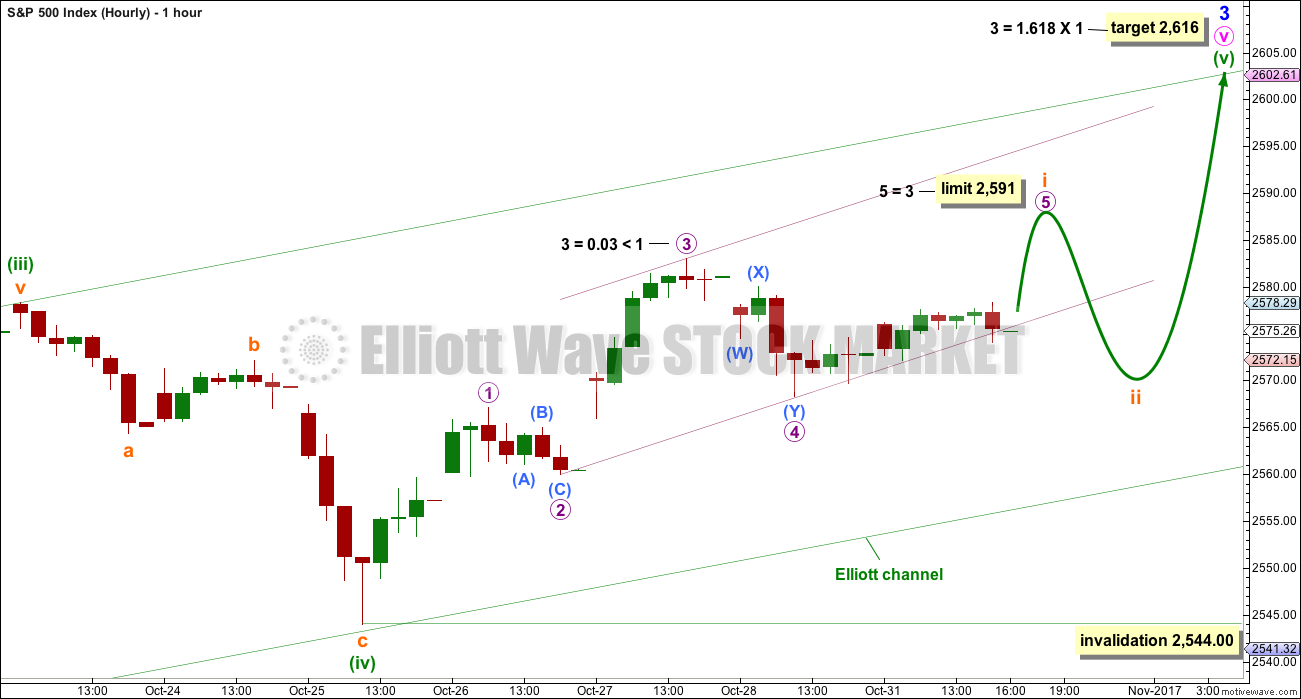
The short term analysis is again changed today after more sideways movement. It looks like a small five up may be completing.
Because micro wave 3 is very slightly shorter than micro wave 1, micro wave 5 is limited to no longer than equality in length with micro wave 3, so that micro wave 3 is not the shortest actionary wave within the impulse of subminuette wave i and the core Elliott wave rule is met.
The small violet channel is drawn about subminuette wave i using Elliott’s second technique.
When subminuette wave i is complete, then subminuette wave ii may find support about the lower edge of the green Elliott channel if it gets that low.
If this short term analysis is correct, then subminuette wave ii may present another opportunity to join the upwards trend.
ALTERNATE WAVE COUNT
DAILY CHART
Click chart to enlarge.
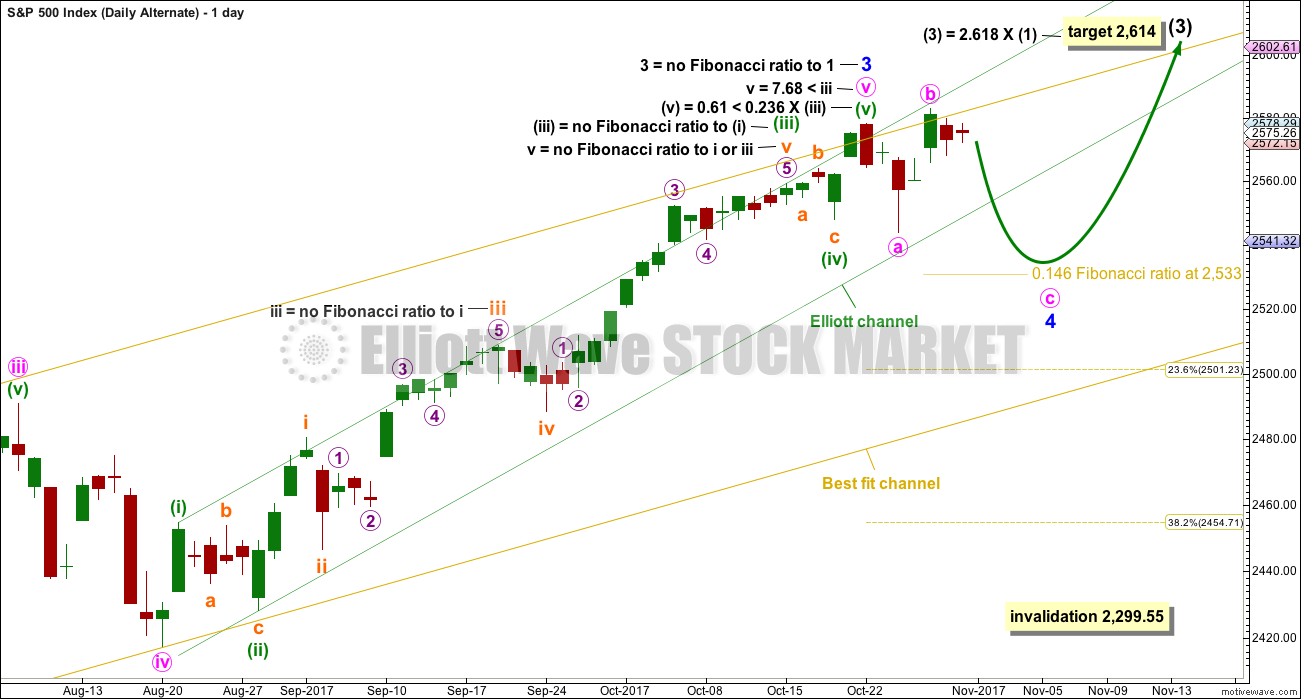
This alternate wave count will consider the possibility that minor wave 3 is complete and minor wave 4 is continuing as an expanded flat correction. The degree of labelling within minor wave 4 has been moved up one degree. If minute wave c continues over a few days, then minor wave 4 would have lasted about the right duration for a correction at minor degree, and would not be too disproportionate to minor wave 2 which lasted only three days.
A breach of the lower edge of the green Elliott channel about minute wave v would be expected when minute wave v is complete. If this happens, it would add substantial confidence that minute wave v is over and so minor wave 3 should be over.
Minor wave 4 may not move into minor wave 1 price territory below 2,299.55.
HOURLY CHART
Click chart to enlarge.
Minute wave b is still within the most common range for a B wave within a flat correction. Because minute wave b is longer than 1.05 times the length of minute wave a, this may be an expanded flat correction, which is the most common type.
The appropriate Fibonacci ratio to apply to the target for minute wave c is 1.618. This gives a target close to the 0.146 Fibonacci ratio of minor wave 3.
So far minor wave 4 has lasted six days. If it continues for another two, it may end in a total Fibonacci eight sessions.
This wave count now requires a new low below 2,544.00 for reasonable confidence. The fact that upwards movement labelled minute wave b has good support from volume does not support this wave count; B waves should exhibit weakness, not strength.
For the very short term, the subdivisions at the five minute chart level do not support this wave count very well. The wave down here labelled minuette wave (i) looks like a double zigzag and not a five wave structure.
TECHNICAL ANALYSIS
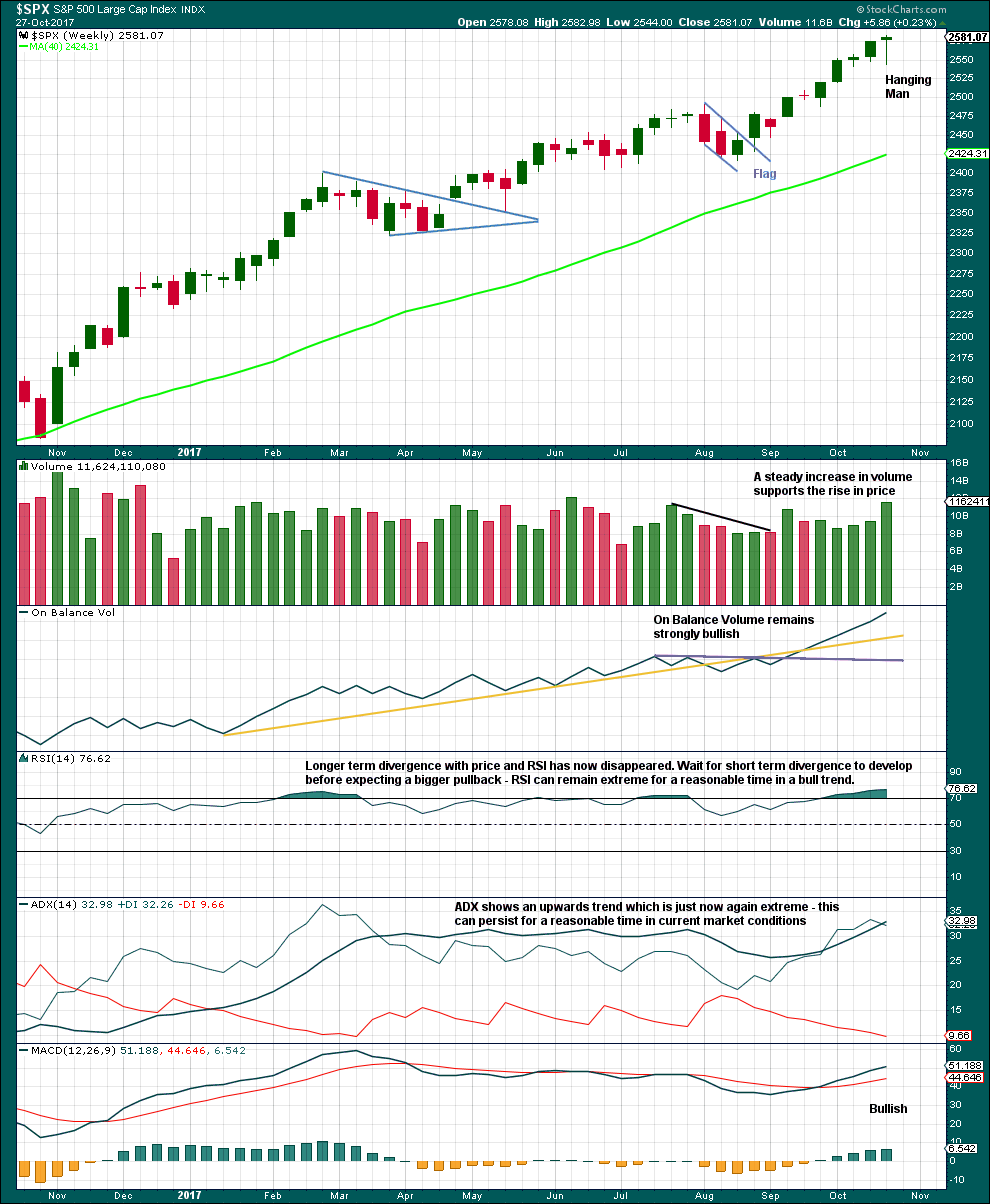
WEEKLY CHART
Click chart to enlarge. Chart courtesy of StockCharts.com.
The Hanging Man candlestick requires bearish confirmation because the long lower wick has a strong bullish implication. Without that bearish confirmation, it should not yet be read as a reversal signal and only as a possibly developing reversal signal.
Overall, this chart is fairly bullish. Only extreme ADX sounds a warning, but most recently this has reached extreme at the weekly chart level and remained so for several weeks while price continued to rise. It may do so again.
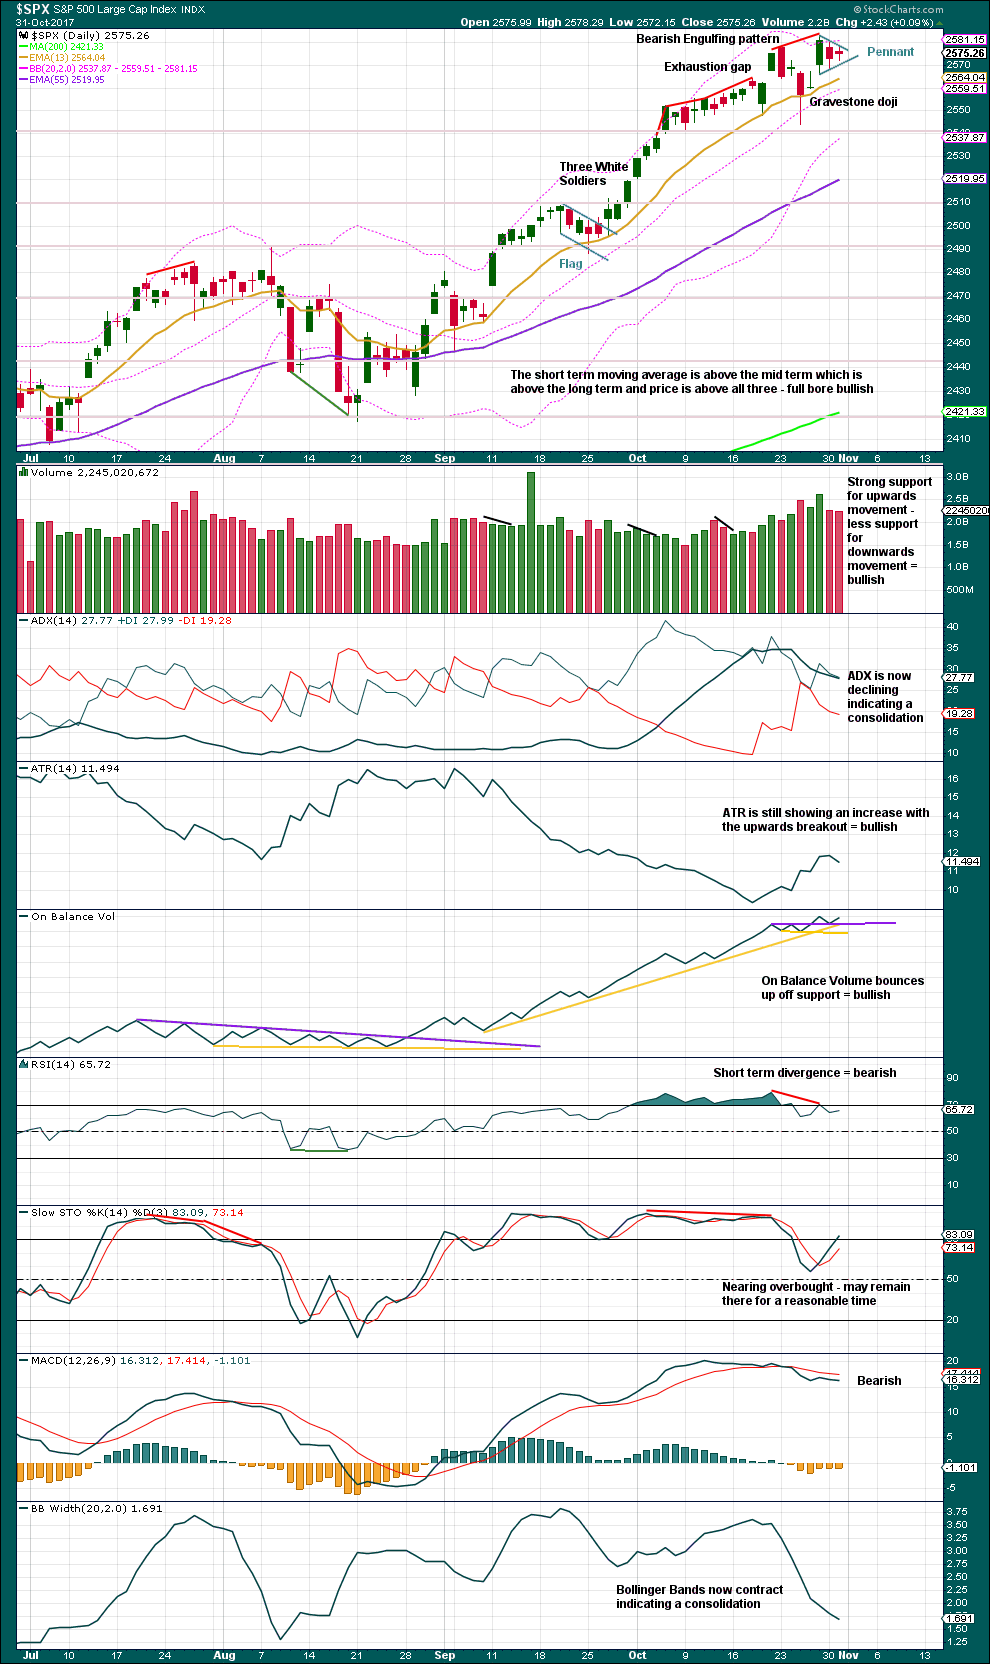
DAILY CHART
Click chart to enlarge. Chart courtesy of StockCharts.com.
The Harami may be indicating only a small consolidation, which now looks like a pennant pattern.
Pennants are one of the most reliable continuation patterns. The measured rule calculates a target about 2,617. Because this is only one point off the Elliott wave target, this area may offer strong resistance.
Volume and On Balance Volume still today strongly support the main Elliott wave count.
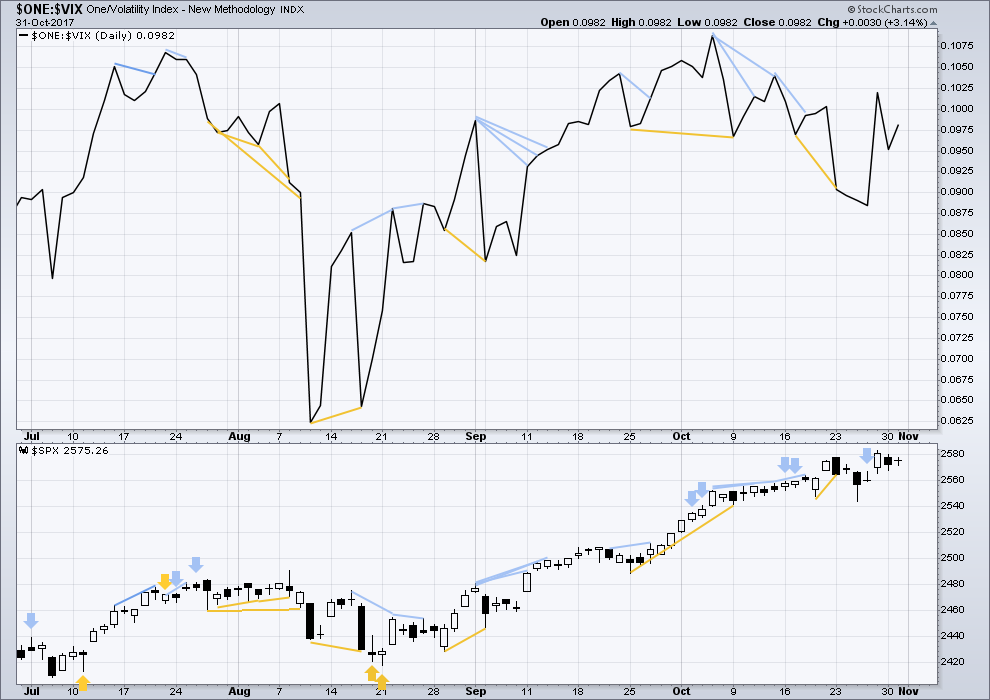
VOLATILITY – INVERTED VIX CHART
Click chart to enlarge. Chart courtesy of StockCharts.com.
Normally, volatility should decline as price moves higher and increase as price moves lower. This means that normally inverted VIX should move in the same direction as price.
There is no short term divergence between price and inverted VIX. Mid term divergence is more often unreliable and will not be noted here nor given any weight.
BREADTH – AD LINE
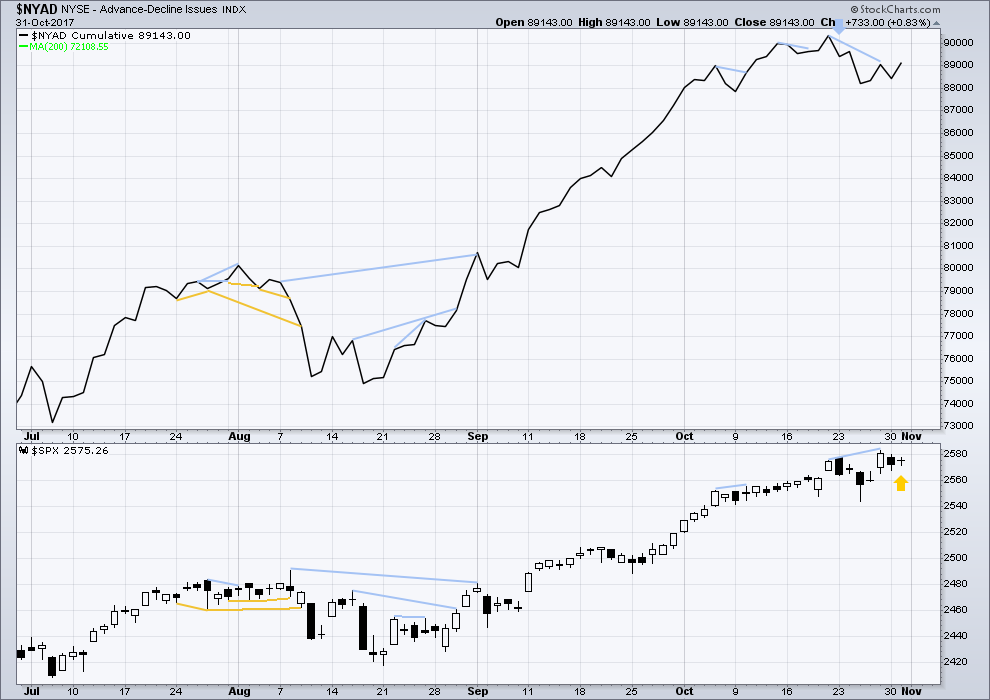
Click chart to enlarge. Chart courtesy of StockCharts.com.
There is normally 4-6 months divergence between price and market breadth prior to a full fledged bear market. This has been so for all major bear markets within the last 90 odd years. With no longer term divergence yet at this point, any decline in price should be expected to be a pullback within an ongoing bull market and not necessarily the start of a bear market.
Short term bearish divergence noted on Friday between price and breadth has now been followed by two red daily candlesticks. This divergence may now be resolved.
There is new short term bullish divergence today. The AD line has made a new high above the high of the 27th of October, but price has not. With the AD line a leading indicator, this divergence is interpreted as bullish.
DOW THEORY
At the end of last week, DJIA and DJT have failed to make new all time highs. The S&P500 and Nasdaq have made new all time highs. DJIA and DJT have failed so far to confirm an ongoing bull market.
Failure to confirm an ongoing bull market should absolutely not be read as the end of a bull market. For that, Dow Theory would have to confirm new lows.
The following lows need to be exceeded for Dow Theory to confirm the end of the bull market and a change to a bear market:
DJIA: 17,883.56.
DJT: 7,029.41.
S&P500: 2,083.79.
Nasdaq: 5,034.41.
Charts showing each prior major swing low used for Dow Theory are here.
Published @ 06:53 p.m. EST.
Okay guys, so I promised I’d show you a surfing video from my trip to Tonga.
The waves were coming in fairly straight onto the reef, so the rides were short.
Here’s one with my camera facing forward. You can see how shallow it is, only about 1ft of water below my board! Beautiful coral reef.
And here’s one facing back to show you how it looks to catch one of these little waves. A bit small, but still fun.
Awesome!!! Man that looks like a blast. I gotta get me a surfboard!! 🙂
Dude! Only a surfer knows the feeling!!!
Indeed! The smile on my face at the end of that second wave… totally stoked.
Thank you Lara. It’s good to see you navigating waves of a different kind!
Updated hourly chart:
The alternate is invalidated. Long live the main count 🙂
The trend is still very clearly up.
Next target…. 2,616 – 2,617 for a short term consolidation which may last only a few days.
And as for those little subdivisions within micro wave 5… I can force it to fit as an impulse. Doesn’t look too good, but no rule violations. But it can’t fit as an ending diagonal, the wave lengths don’t meet rules.
The 2 pullback could be quite deep; the invalidation point is way, way down there. A sharp sell-off to the 62% or even 74% wouldn’t surprise me tomorrow. Market is overdue for a touch of volatility and a shakeout of weaker hands.
Or… it could be shallow. Again.
I agree… the short term catalysts have played out neutral to down so far. RUT has been posting some weak candles and is seeing an increase in volatility. We don’t quite have the steam we had in early October anymore.
Anyone have insights into currencies? I see uup has finally broken bearish symmetry and established an upward trend. At the same time, FXE has done the same in the other direction. I’m looking to take FXE long, on a turn off fibo and symmetric support, which price is getting close to. I’d like to see a confirming down turn in UUP. I think the FXE trade may fire in the next week or two. Anyone else stalking this setup?
NZDUSD is on it’s way down.
The only other two I follow on a semi regular basis is EURUSD and GBPUSD. Cesar likes the Loony.
Reloading Triple Q put but going on one week to expiration. Buying 151 strike puts for bid of 0.80 per contract. Current bid is 0.90….
You cannot get much more extreme than a bearish engulfing candle above the upper B band…
Sold T Q puts for 0.90.
Looking to reload after bounce….
Here is something REALLY curious. Go take a look at all the DOW component stocks.
So far NOT A SINGLE NEW HIGH! Not so cash index and futures. Smoke and mirrors! 🙂
(Oh yeah; I know all about the ETF passive investing Yada, Yada, Yada).
It’s been so gamed for so long, i’m without words. They’ve been in there all day; conveniently after 5 down and gap fill…..same sh different day.
I am kinda rooting them on. I don’t know just when it is going to go “Ka-Put!”, but the longer this continues, the more spectacular the bang…truly amazing…! 🙂
There was a time when an intra-day gap closure would without question signal an exhaustion gap. What we are seeing with such a plethora of bearish signals yet relentless upwards price movement is true mania behaviour. My own thesis as everyone knows, is the market cannot be permitted to correct due to what could be at stake. I seriously doubt what comes next is just a correction, and yes we could indeed continue the ramp higher…. 🙂
Looks like VIX headed back below 10.00 and another opportunity to snag some 10.00 strike calls……..
Prechter on Fox Business right now… Being interviewed… Back on after commericial break
What he saying about his latest faux pax in EWI calling a top last week? 🙂
Turn on… going to explain after break to pay bills
Did he call top… I don’t subscribe anymore.
“Unheard of complacency”! “By Stock and Bond People”
“All Time Low in VIX” “Record Bet by pros that VIX will go Lower”
“A Peak that will make it’s mark on Charts” “Move into cash to stay safe” Note: he won’t make a specific stock price prediction… “I rather not say” he says. ( I guess need to buy subscription)
Man alive! That stuff is all old news. I guess Bob must think that the whole world is fast asleep. The record VIX low for example was months ago! 🙂
I guess Bob must think that the whole world is fast asleep.
When it comes to risk… I think that is what he is saying. Everyone is blind to the rick or zero concern of or appreciation for it. “Record Bet by pros that VIX will go Lower” Lower than todays low.
He may be right.
What really amuses me is how many people seem to think that what is going on is normal. You are really wasting your time these days talking to people about risk so I will leave it to Prechter! 🙂
According to an old friend of mine (who I remembered use to subscribe) the recent RP T big picture call is for DJIA …
“Wave forms down to the daily chart appear to indicate completion of…
wave 5 of (5) of 5 circle of V of (V) of III circle dating from year 1784”
Plus two other reasons combined with charts… didn’t give me details on this.
B band expansion to contain price action as we are now seeing in IYT is what you want to see ahead of a sustained price move….the markets are all likely to move together so paying attention to what other indices are doing is important…
I am not sure why TZA has become so popular all of a sudden. That is one massive bullish engulfing candlestick. Either some serious short covering has begun or somebody is accumulating a lot of shares….
Looks like micro wave 5 completed as expanding ending diagonal with closure of opening gap up.
I count micro wave 5 as a 5 wave impulse move up. Micro-A of the ABC minute 2 down looks like a just about complete 5 wave impulse down. I’d expect a B up now, and a C down tomorrow.
Agree.
This…
4 overlaps 1, so that doesn’t work.
I think 1 must have ended earlier….
Terminal triangle thrust will be confirmed by a move below 2572.15 and it should come before the close. Any hesitation about a decisive close of that gap will be a certain sign of more upward movement to come…
Moved stop up on T Q calls to 0.90 to lock in small profit.
Whipsaws are far too common these days…
Taking profits on half VIX calls snaggged at this morning’s lows for easy 20% pop. Will reload on any sub ten move…
VIX sold at 10.00 pivot…interesting battle underway. We could finally go on to print a new 52 week low, it would STILL be quite bullish for VIX. This is NUTS!!!!
If you buy gold, you should be aware of the shocking news that a bank in Canada was caught red-handed peddling supposed gold wafers, comlete with official mint stamp and hermetic seal, that turned out to to be FAKE. You heard me. A mint associated bank was caught selling FAKE Gold. Worse, they initially refused to refund the jeweller’s money until he went public. We now possibly have mints issuing phony precious metals people. I doubt this is the exception. Caveat Emptor….!
Very amusing indeed! As soon as triple Q fills that gap we see a massive cash dump and monster green candle to try and reverse the gap fill….I guess they have not yet run out of cash, or at least the ability to appear as if they have not…. 🙂
The fact that these reversals are taking place with price action above B bands makes it more likely we have a higher than minute degree correction ahead imho…
O.K. We have a green VIX print but a couple gaps still open. This is worth noteworthy imho…
It appears the minute 1 up is over with today’s high, and the minute 2 has kicked off, with what appears to be a 5 wave impulse down in progress (middle of wave 3 now?). Generally I expect this move to be an A of an ABC minute 2, taking price down to a 61.8% retrace of the overall minute 1, at 2561.0. A deeper correction to 76.4% would be to 2554.5. On the shallow end, 38.2% is 2671.4. So somewhere in there should be a fresh bottom, then price should start a minute 3 and bullish joy will reign again for a while.
Speculative trade on Triple Qs expiring Friday. 100 152 strike puts at 0.82 per contract…
STC order opened at 1.50 per contract…
Trigger for trade was fill of this morning’s gap up open.
This is not a foregone conclusion folks. The banksters CANNOT allow the market to go down and will continue to try and arrest impulsive declines so that could happen once again…
Adding to January TZA calls. IWM showing similar extreme B band compression which often portends a very big move. Market declines are being ferociously resisted so it might be smart to take profits on the first big pop then re-load. IWM looks to be printing a bearish engulfing candle. I know it is easy to conclude that these bearish reversal signs no longer mean anything or that just because they are negated in the short term they have no predictive value whatsoever. I think they are pointing to the need for caution.
I’ve taken most of my profits on HAL and OIH, but there is a very real possibility that these are just entering multi-month upside moves. I’ll be aggressively reentering to the long side of pullbacks as long as the basic set up holds. Here’s a HAL multi-time frame chart to show what I mean. Upper left is weekly, then daily, hourly, and 5 minute clockwise. (The colors are driven by ADX and CCI measurements, along with a few heuristics, and are pretty self explanatory re: trend and thrusts.)
OK people pay attention. If this reversal is what I think it is the first thing to happen will be a decisive fill of this morning’s gap.
Next will be a VIX green print while the ticker is still green….
VIX once again on sale. Multiple divergences with all the new all time highs recently.
This is probably the best opportunity to go long volatility I have seen all year.
I would not be surprised by a fat green candle today or tomorrow to kick off the march North.
I am back to my purchase price on the bid for my IYT November 175 strike puts, I could have sold for a reasonable profit the last two days but I broke a long-standing rule and decided to hold.
I am adding to my position today….
I’ll be looking at a possible VXX buy when price hits the wave 5 target here around 2591.7 or so, turns, and triggers to the downside. I do believe a minute 2 wave here in SPX should spike the VIX sufficiently, for me. The far better short play though is still weeks away, when the minor 4 finally arrives. Nyet, per Lara’s count.
This morning’s high of 5288.4 is close enough to that 2591.7 target that I believe this has to be the 4. The margin of error on this is wayyy larger than 3 measly points. I will be adding to my long positions when we close this morning’s gap.
Be careful, I really don’t think this down move is it for the pullback. I think it’s just A of an ABC down. Could be wrong but as for myself I’m trying hard to wait to establish fresh longs. Ready…aim…aim…aim…
I’ve got a max of this subminuettte 5 up to 2591.7 or so, if the i-ii-iii-iv structure from the Oct 25 low is to stay in play. And THEN…I do believe it’s minor 4 time???? I think so. I.e., a “real” pullback may be very close to revving up.
The hourly main and the daily main are in a bit of disagreement. I believe the hourly is “off a degree”. On the daily, price is in a minuette 5 to finish a minute 5 to finish a minor 3. Inside the hourly, that minuette 5 is shown with a 5 wave structure in progress, current push up being subminuette 5. Except I believe the hourly degree shown is one less. Instead of purple circles showing 1, 2, 3 and 4, I think those should be orange i ii iii iv. The change is LARGE because again, I do believe price is just about to reach the starting point of a minor 4 here if I’m correct. Somebody please check me on this.
I think you are right. I am seeing three wave moves the last several sessions and this looks to me like a classic thrust from a triangle with a throw-over. This move up is probably terminal. We will know very shortly if that is correct as the reversal will be quite sharp.
I don’t know about triangles or terminal thrusts. What I do know is that the upcoming minute 2 could take price as far back down as 2445, without any EW violation. I also note that with this Oct 26 low to now impulse being a minute 1…there’s a heck of a lot of upside to come before a minor 3 starts. Something to consider for those focused on shorting this bull market.
Hmmm, okay they aren’t in agreement and it’s probably the hourly that is CORRECT, as otherwise the proportionality is all messed up. The daily is misleading by including an orange (minute) 1 and 2 on it is what is throwing me for a loop. So price is about to complete a MINUTE 1 here around 2491.7…then a minute 2 coming, etc etc. Keeping high levels of nested wave counts straight isn’t always easy.
Closing on business transaction soon (hopefully) that will give me more funds for more short plays or vol spike up plays.
Excellent set-ups just ahead. Either a nice sharp C wave down (my personal fave) to complete minor 4, or an initial pop higher higher to conplete sub-min 2 before a shallower pullback. Either way, a high probabilty trade to the upside should present the next day or two. Futures should tell us which. 🙂
Great analysis Lara, and welcome back!
Thanks Verne 🙂
Lara,
Can you please send me Verne’s email address (Verne please confirm if it is OK)?
Yes that’s OK Lara. I forgot to send an email.
Going in with both hands now Verne!!
Yes indeed. Looks like we are just about done…wow!
I did look like some kind of triangle to me yesterday and now we have a tell tale thrust- a terminal move…
Eeeh…!