
Bearish divergence noted in the past few sessions between price and market breadth has correctly signalled a fall in price.
Summary: A new low below 2,457.92 gives some reasonable confidence that a fourth wave correction has arrived. The fourth wave may be relatively brief and shallow as minor wave 4, or it may be a much deeper multi week pullback or consolidation as intermediate wave (4). At this stage, it is still impossible to tell which scenario may play out.
Last monthly and weekly charts are here. Last historic analysis video is here.
MAIN ELLIOTT WAVE COUNT
WEEKLY CHART
Click chart to enlarge.
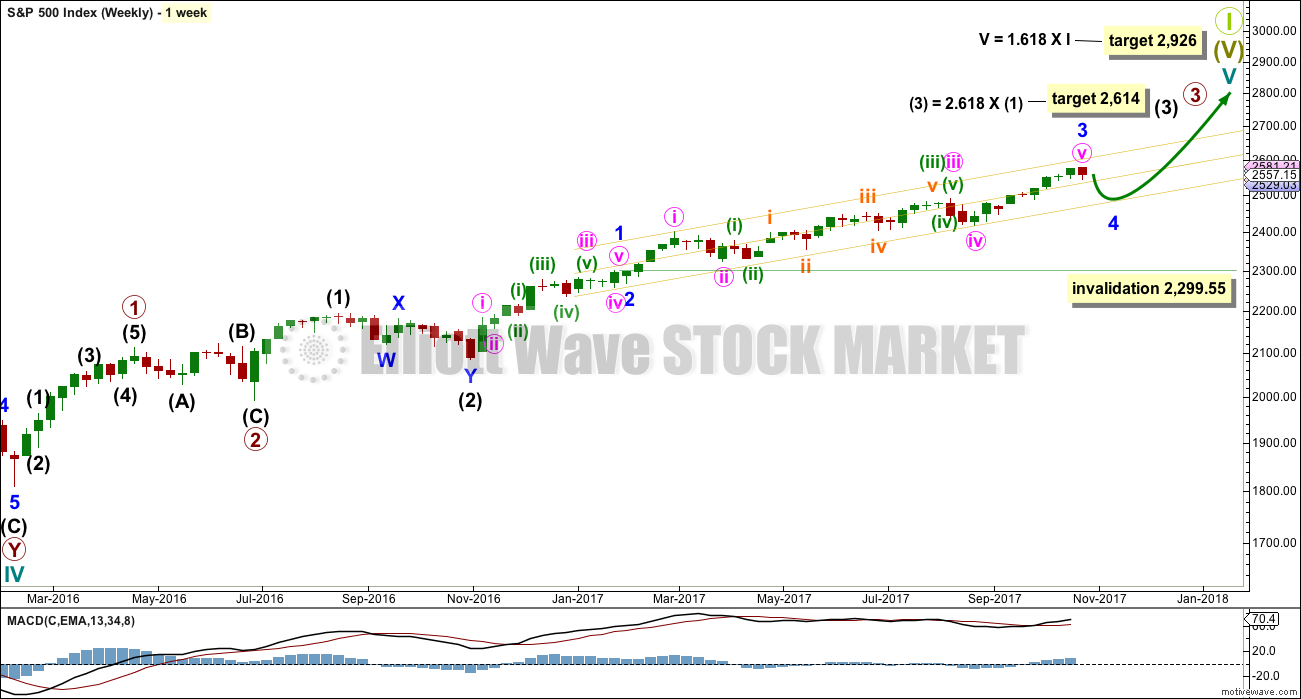
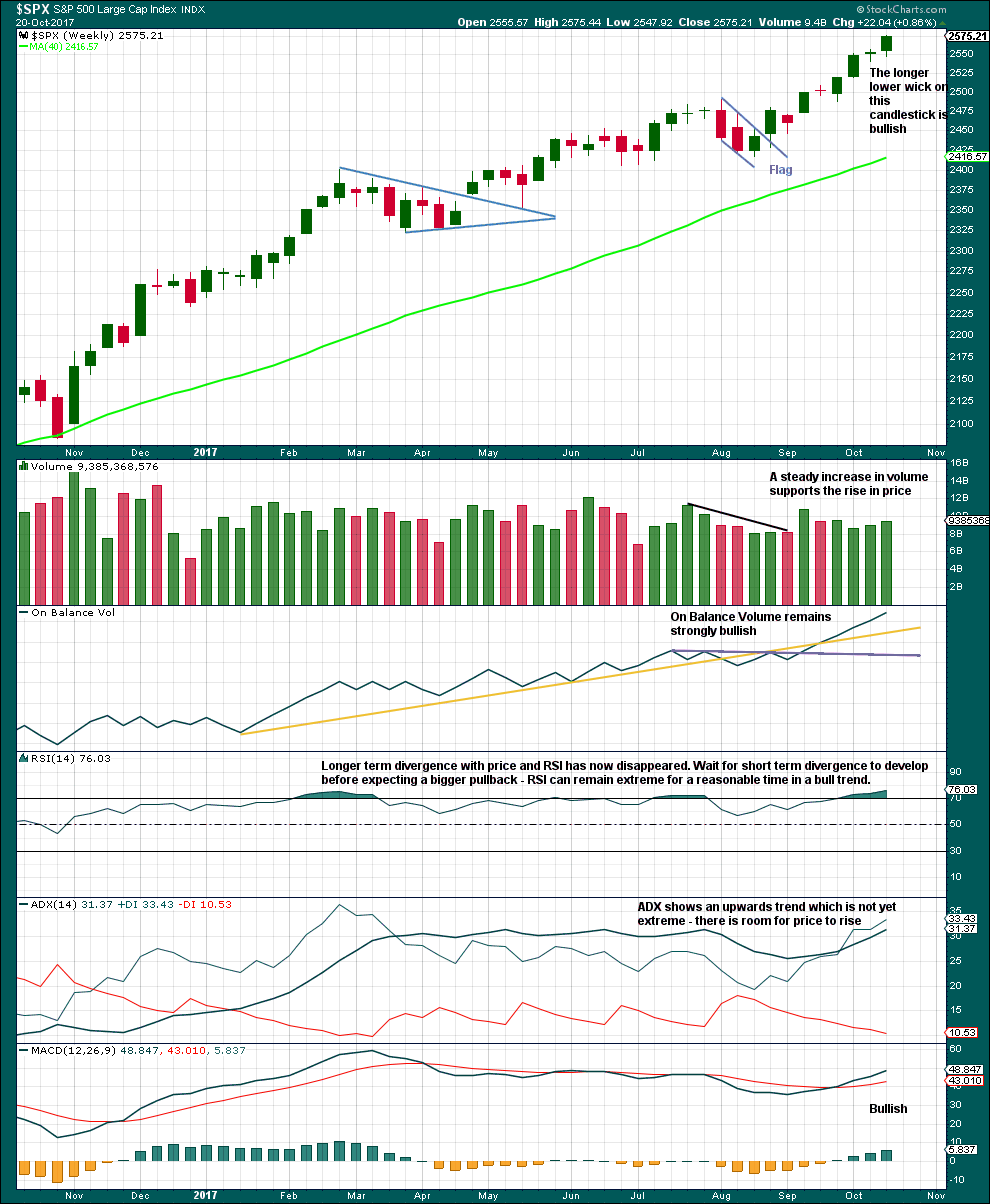
This wave count has strong support from another bullish signal from On Balance Volume at the weekly chart level. While classic analysis is still very bullish for the short term, there will be corrections along the way up. Indicators are extreme and there is considerable risk to the downside still.
As a Grand Super Cycle wave comes to an end, weakness may develop and persist for very long periods of time (up to three years is warned as possible by Lowry’s for the end of a bull market), so weakness in volume may be viewed in that larger context.
Within minute wave v, no second wave correction may move beyond the start of its first wave below 2,417.35.
The next reasonable correction should be for intermediate wave (4). When it arrives, it should last over two months in duration, and it may find support about the lower edge of this best fit channel. The correction may be relatively shallow, a choppy overlapping consolidation, at the weekly chart level.
DAILY CHART
Click chart to enlarge.
To see details of the whole of primary wave 3 so far see the analysis here.
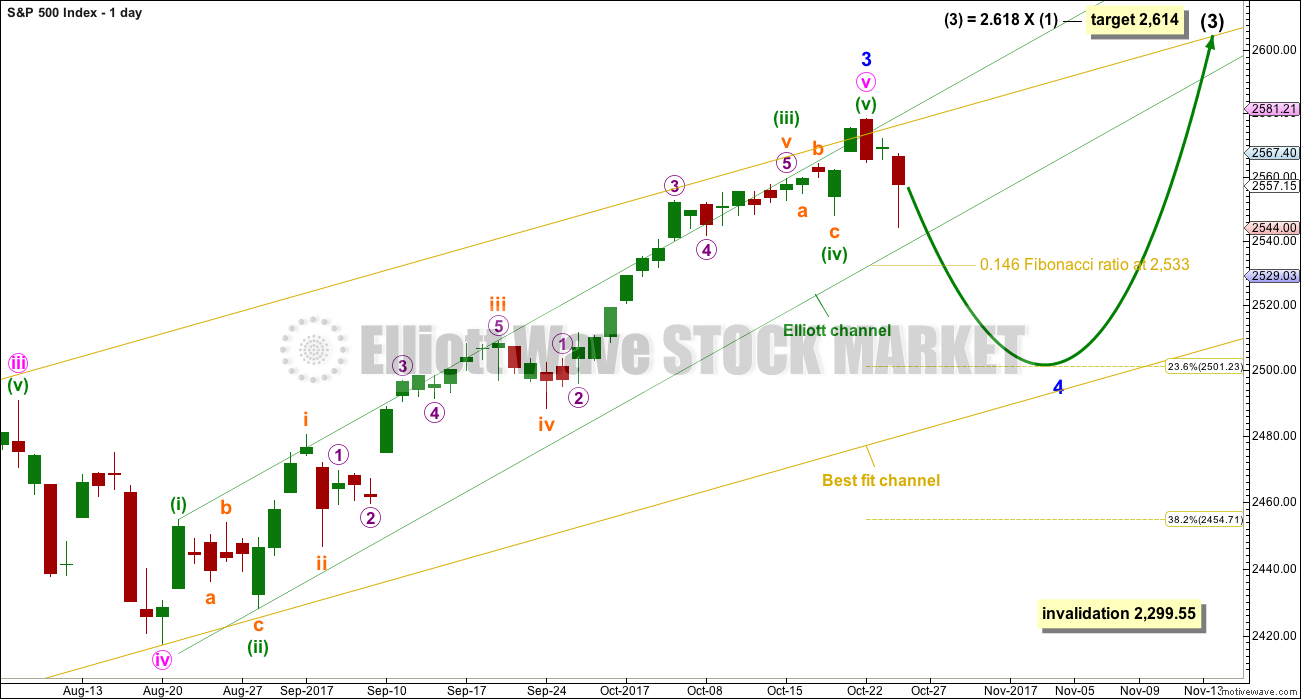
Minor wave 3 may be complete and may not exhibit a Fibonacci ratio to minor wave 1.
Minor wave 2 was very brief at only three days. It is possible for good proportion that minor wave 4 could be as brief.
The 0.146 and 0.236 Fibonacci ratios should be first and second targets for minor wave 4 to end.
Minor wave 4 should break down below the green channel containing minuette wave (v). A breach of this channel would add substantial confidence in this wave count. Note that the green channels are drawn differently on the daily charts. While price is breaking below the channel on the alternate chart, it has not yet done so here on this main daily chart.
If minor wave 4 were to end within the price territory of the fourth wave of one lesser degree, then a target range would be from 2,490.87 to 2,417.35. The 0.382 Fibonacci ratio of minor wave 3 is within this range at 2,455.
HOURLY CHART
Click chart to enlarge.
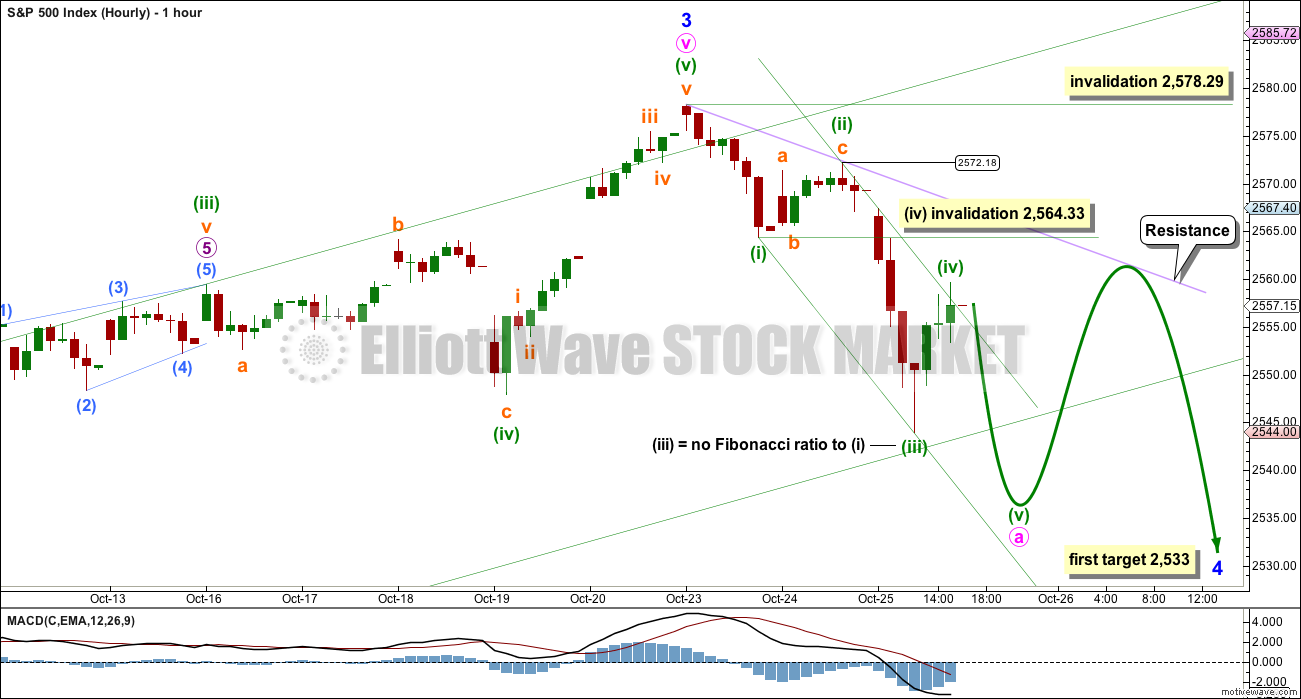
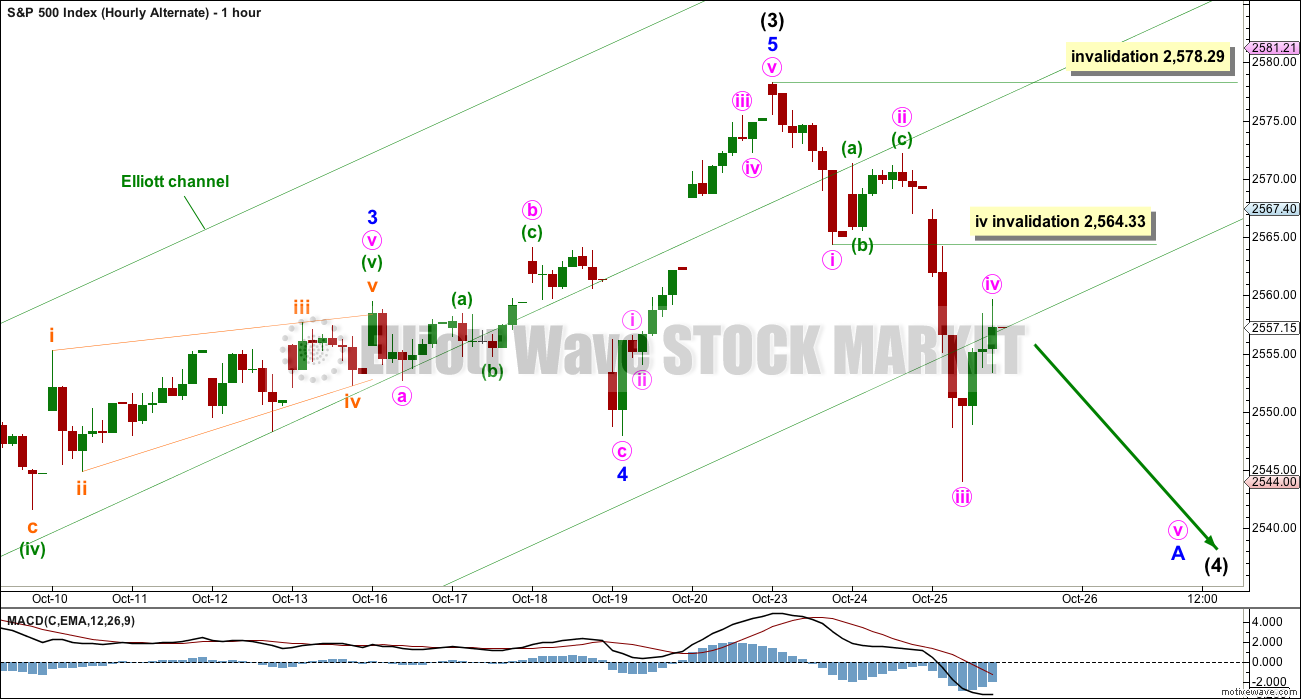
Minor wave 2 was a quick zigzag, so minor wave 4 may exhibit alternation as a shallow and sideways flat, combination or triangle.
First, a five down should complete even for a correction at minor degree. That would be incomplete. While it is incomplete, no second wave correction may move beyond the start of this movement above 2,578.29.
So far an impulse may be completing to the downside. Only a fifth wave down is now needed. Minuette wave (iv) may not move into minuette wave (i) price territory above 2,564.33.
If price does move above 2,564.33 early tomorrow, then the short term invalidation point must move up to 2,572.18. Today’s downwards wave would then be labelled as another first wave down, and another second wave correction would then be expected.
So far minuette wave (iv) has slightly overshot the small Elliott channel. If it continues to overshoot this channel, then the channel would need to be redrawn using Elliott’s second technique. Any deep bounces should find strong resistance at the lilac trend line.
ALTERNATE WAVE COUNT
DAILY CHART
Click chart to enlarge.
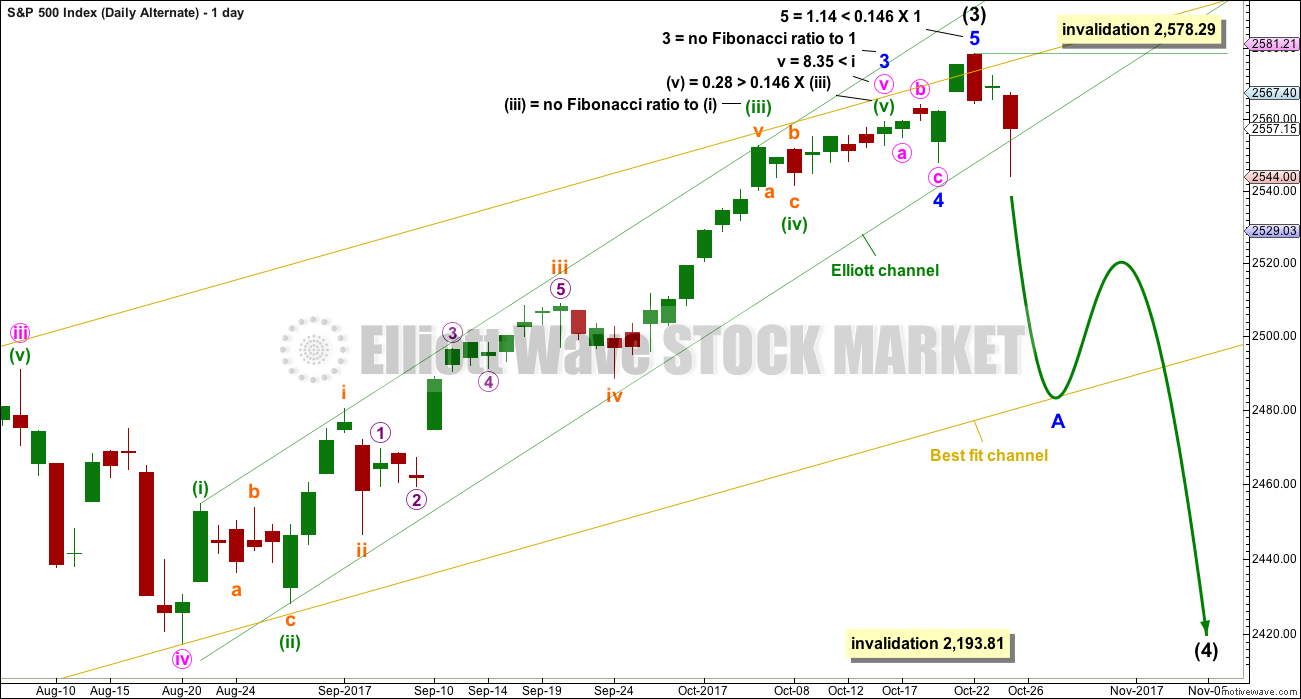
It is also possible that both minor waves 3 and 4 could be over.
My initial judgement was to label this as an alternate because of the brevity and shallowness of minor wave 4. This does not look right. However, there is still good alternation and good proportion with minor wave 2, which lasted only three days and was a zigzag. Here, minor wave 4 may have also lasted only three days and may have been a flat correction.
Intermediate wave (3) could be over. A deep multi week correction for intermediate wave (4) may have arrived.
Intermediate wave (2) lasted eleven weeks and was a relatively deep 0.54 double zigzag. Intermediate wave (4) may be a shallow flat, triangle or combination to exhibit alternation. To exhibit good proportion, it may last about eleven weeks or possibly a Fibonacci eight or thirteen.
A new low below 2,547.92 could not be a second wave correction within minor wave 5, so at that stage minor wave 5 must be over. This would add reasonable confidence that a correction has arrived.
HOURLY CHART
Click chart to enlarge.
A correction at intermediate degree should begin with a five down on the hourly chart. That would be incomplete. While it is underway, no second wave correction may move beyond the start of its first wave above 2,578.29.
The analysis for both wave counts will be essentially the same at the hourly chart level while the first five down unfolds. Here, everything is moved up one degree.
TECHNICAL ANALYSIS
WEEKLY CHART
Click chart to enlarge. Chart courtesy of StockCharts.com.
At the weekly chart level, the technicals last week look even more bullish than the week prior.
Longer term divergence with price and RSI does not appear to be very reliable; it has again disappeared. Like divergence with VIX and the AD line, divergence with price and RSI appears to be more reliable for the short term when it is clear and strong.
This chart is fully bullish. There is nothing bearish yet here.
DAILY CHART
Click chart to enlarge. Chart courtesy of StockCharts.com.
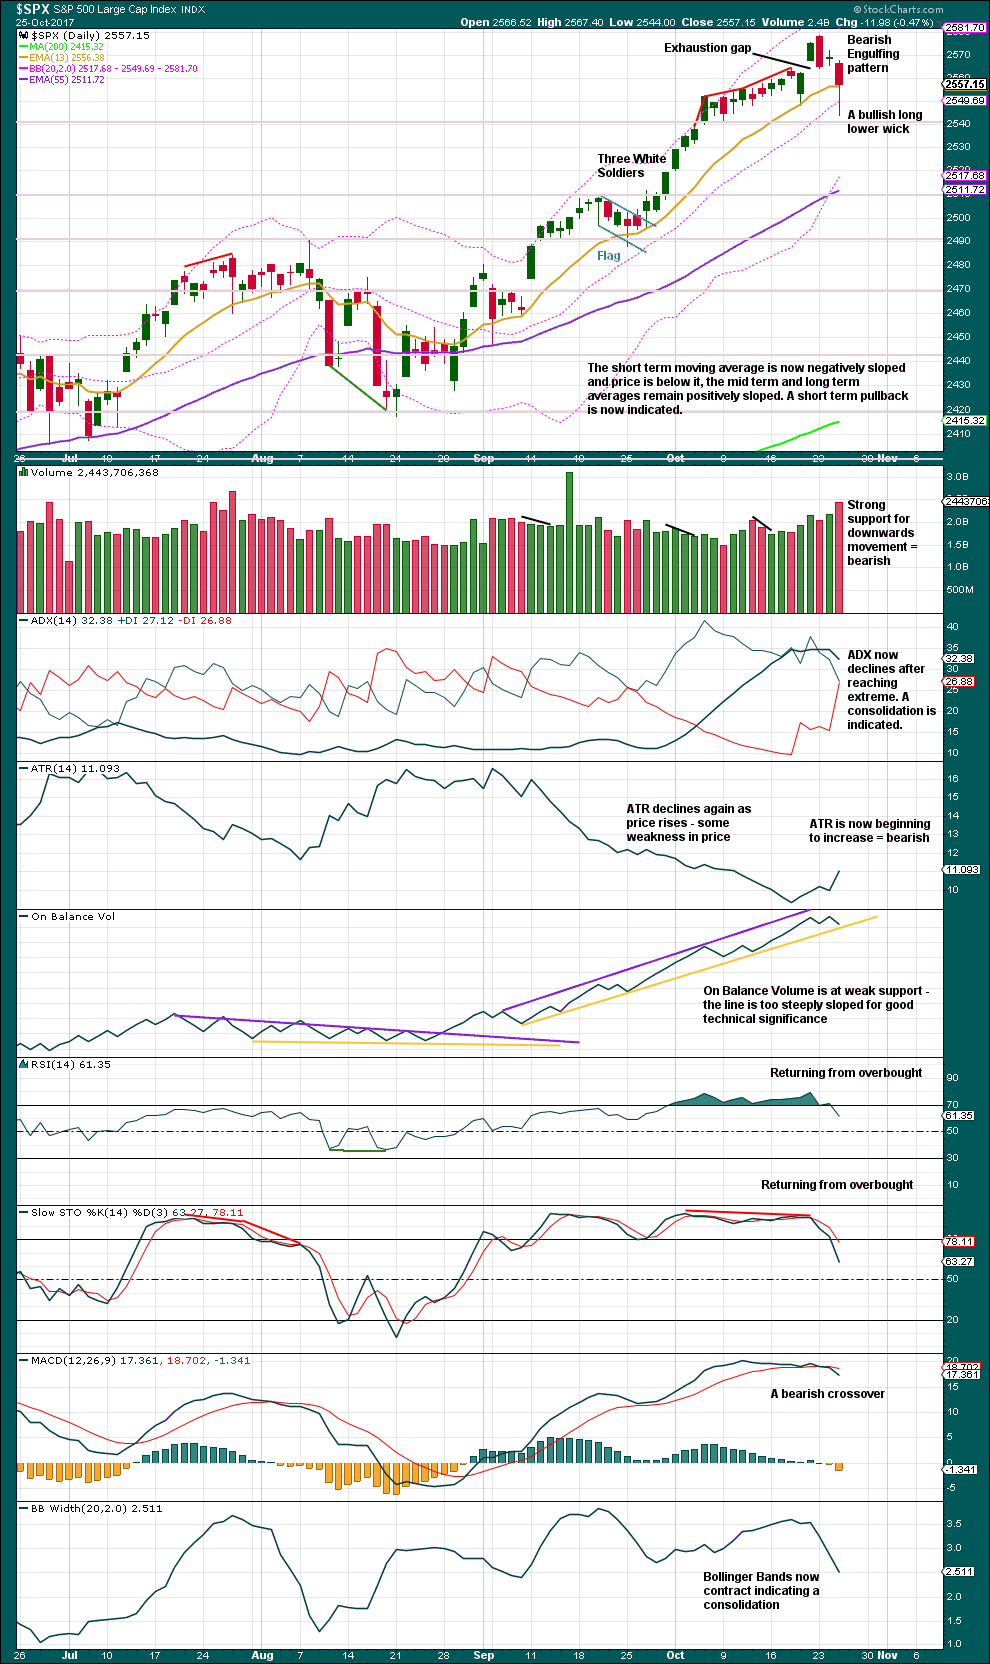
More commentary is on the chart today.
This chart is now slowly switching from full bore bullish to more bearish. A short to mid term consolidation is now indicated.
Next support about 2,540. The long lower wick today suggests a bounce tomorrow.
VOLATILITY – INVERTED VIX CHART
Click chart to enlarge. Chart courtesy of StockCharts.com.
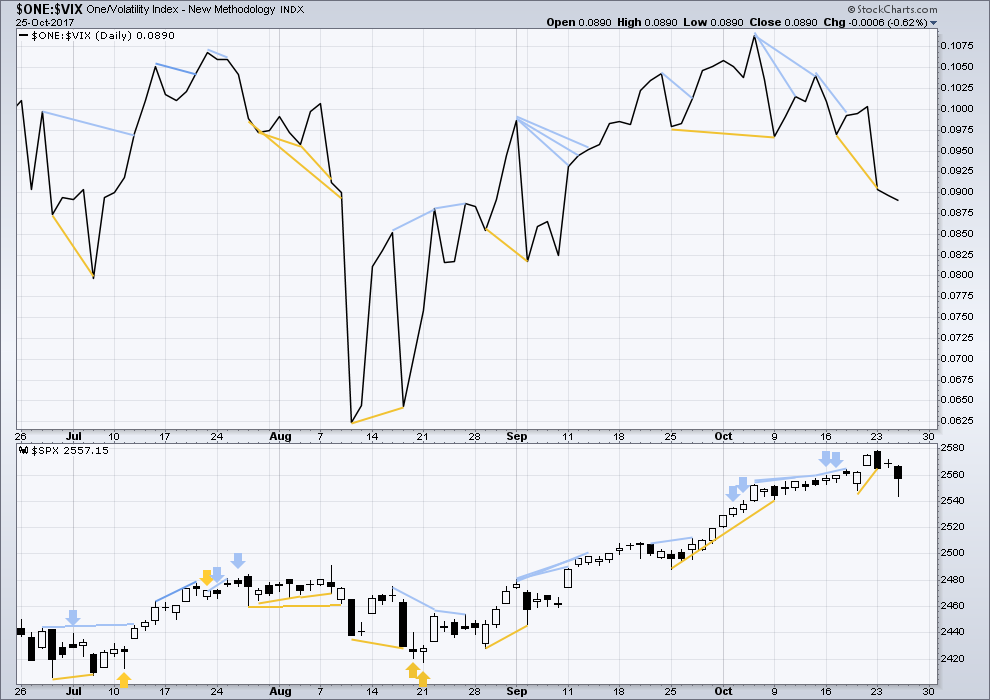
Normally, volatility should decline as price moves higher and increase as price moves lower. This means that normally inverted VIX should move in the same direction as price.
The fall in price today has a normal corresponding increase in market volatility.
BREADTH – AD LINE
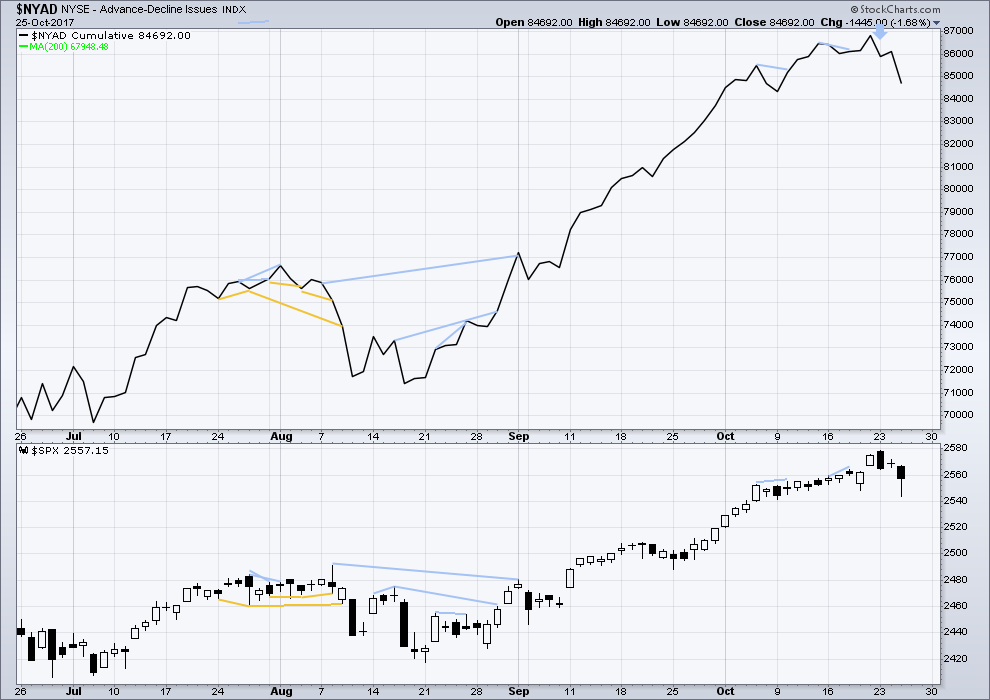
Click chart to enlarge. Chart courtesy of StockCharts.com.
With the last all time high for price, the AD line also made a new all time high. Up to the last high for price there was support from rising market breadth.
There is normally 4-6 months divergence between price and market breadth prior to a full fledged bear market. This has been so for all major bear markets within the last 90 odd years. With no divergence yet at this point, any decline in price should be expected to be a pullback within an ongoing bull market and not necessarily the start of a bear market.
Bearish divergence has accurately predicted a fall in price. Price today has made a new small swing low and the AD line has too. The fall in price has support from declining market breadth.
DOW THEORY
At the end of last week, only the Dow Jones Transportation Average has not made new all time highs. The continuation of the bull market has not this week been confirmed. However, the Dow Jones Transportation Average is not far off its last all time high. If it does make a new all time high, then this analysis will be totally and fully bullish.
Failure to confirm an ongoing bull market should absolutely not be read as the end of a bull market. For that, Dow Theory would have to confirm new lows.
The following lows need to be exceeded for Dow Theory to confirm the end of the bull market and a change to a bear market:
DJIA: 17,883.56.
DJT: 7,029.41.
S&P500: 2,083.79.
Nasdaq: 5,034.41.
Charts showing each prior major swing low used for Dow Theory are here.
Published @ 05:37 p.m. EST.
This is way too freaky people. I sold my last five UVXY 16.50 strike calls just before the close for 1.75!!!!!
Ask is 2.00 This is NUTS!!!! 🙂
Another scenario, the second in my list below. A leading expanding diagonal subdividing for wave A.
Before I get to the rather interesting discussion below…. here’s an updated hourly chart for you.
So this is how I want to approach this possible fourth wave and how it’s beginning.
Let us start with the highest probability scenario, a simple five down. That’s invalidated today as the fourth wave overlapped what would be first wave price territory.
Now onto the next most likely scenario. Overlapping first and second waves. Actually very common to see when a third wave extension begins, and third waves are the most commonly extended of all actionary waves.
But we have been here before haven’t we. So let us consider the next likely scenario.
Leading diagonals. Now either 1-2-3-4 complete and only 5 down to go, or a big zigzag for 1 is complete.
Next thing to consider is a zigzag down is complete for an A wave. That a flat, or double zigzag, or combination is unfolding for an A wave. I’ll be charting that next. And although this is the last in my list, I do think it should be second. It is very likely now if minor 4 is underway that a zigzag down is now complete, but only for wave A.
Yikes! My UVXY 16.50 puts just sold for 1.00!
The bid is only 0.94 (ask is 1.05)
What should I do with the remaining five??!!
Should I roll, or should I take the money and run like a bat out of…well, you know! 🙂
VIX possibly breaking from a bullish triangle…
Is that a possible cup and handle pattern developing in UVXY?
OK. Next post. In this picture you have to guess who represents VIX, and who represents the VIX shorts…. 😀
I was wondering how long it would take somebody to quip:
“Talk about a VIX short squeeze!” 🙂 🙂 🙂
Come on people, laugh a little will ya?!
OK. To help alleviate the boredom I am going to post two charts. The first one is of the VIX the last few days, and which I think is currently the most important chart one can assess.
While you are looking at the chart, I would like your opinion on whether I could be mistaken about a possible trend in place…. 🙂 🙂 🙂
Now think about the word PYTHON. The next post will tell you why…..
Reloading IYT November 175 strike puts. Spread now is even wider than my first trade at 1.25/1.55
I am bidding at 1.30 and probably will not get filled but I can wait…. 🙂
I settled for 1.45 on those IYT 175 strike puts. Market makers weren’t budging much. Not too bad considering the ask was 1.55….
UVXY calls now bid at 0.83.
If they break 1.00 I will roll half to 17.50 strikes….
I have a really queasy feeling about this market. Not really a superstitious kind of guy but…looking at the way VIX is trading pinned to its upper B band but neither spiking nor collapsing suggests an epic battle underway. Frankly, it could go either way, but the indecision probably won’t go for long….
This is a SPECULATIVE trade on UVXY 16.50 calls expiring tomorrow. Bought a small contingent (10 contracts) for 0.75 apiece. Hard stop at a bid of 0.50 🙂
A great success will be a vote for a “budget resolution” on the tax bill today. With a workable solution consider the bull run still continues from here. Expectations that it will pass is keeping the market up but the conclusion is still to come. There were some encountered resistance this week but these are just early results for what is to come after the vote. One small risk of this strategy is that if the markets go down it will tank. The gnawing feeling is beginning to take affect and while investors are leaning toward a majority vote there’s a possibility that a point is shy away.
Budget Bill Passed and now on to Tax Reform!
Tax Reform is already priced into the market since the election day for President Trump!
The Trump agenda is to drive economic growth in the USA with the goal of that growth to over 4%+. But for the scoring of the Bills 3%+.
The clean up and elimination of all the unnecessary regulations is what will make over 4% happen. A good portion of the regulation part have already been done. Much more to go.
By the way… NOT one Democratic Vote in Congress or in the Senate for this Budget Bill!
It will be the same for the Tax Reform Bill. So what party is really is looking to improve working lives and raise the income through improved opportunities in the USA of the working man & woman in this country? NOT the D’s!
ROTFL’ing here!!! There are only TWO CONSTITUENTS for the Republican party: THE EXTREMELY WEALTHY (>0.5% of the nation), and the LARGE HIGHLY PROFITABLE CORPORATIONS. That’s it. The policies being enacted are HUGELY BENEFICIAL financially to these two constituent groups. Every one else…not in the least. It’s an oligarchy, and the oligarchy is all about looking after itself. All the crap about increasing salaries and jobs…that’s not how corporates maximize profits.
Keep ROTFL’ing all you want.
You shall all see how sound policy works. After Tax reform, comes a creative infrastructure plan. Once all basics in place… Then the next phase will be a complete private sector style restricting for optimal efficiency of the entire US Government!
Seems to be all this is merely re-arranging the deck chairs on the Titanic guys…. 🙂
Corporations either invest in Revenue Growth or Die!
In the last 10 to 17 years, almost nothing was invested on revenue growth… all went to buy back stock!
With Tax reform all that will flip around to investing in Plant, Equipment, Other and Labor here in the USA.
That is a Fact of how it will all play out with the Goals of this Tax Reform Bill + the rest of the agenda. To say otherwise lacks a fundamental understanding of it all.
Have you ever been an executive in a corporation? I had that “honor” for about 15 years. A sudden windfall due to TAX CUTS will never be spent to “expand business”. Expanding business will generate revenues to expand business…only. Using a windfall to expand business means spending when there’s no reason to. Growth drives larger investment…not rebates!!! Lol!!! And as for paying people more…hell, the #1 goal of every large corporation is CUTTING COSTS!! Less labor. Cheaper labor. Using a tax windfall to INCREASE COSTS? Absurdity. Back to the market….
Well I disagree! When it’s going to all at the same time and you need to compete to survive, Corps will invest. The 25% pass through Cap on S C’s, LLC’s, partnerships & sole p’s will be the Corporations future competitors. The price of entry will be reduced. Invest in production (revenue growth) or Die!
The competition for available Quality Workers will increase income levels for everyone.
I am afraid Kevin may be right. State Farm, one of the largest insurers in the state of Illinois just announced a 700 head cut. It has a huge presence in Normal Illinois. One of its founders, a man with strong commitment to families and communities just retired and new management are now in charge and this is one of the first things they did. A huge number will also have to move to Texas or loose their jobs. It is not surprising that businesses are reducing their foot-print in a state as corrupt and mis-managed as Illinois but what they are doing at State Farm represent the mindset of corporations everywhere. Their only commitment is to the bottom line. They will pocket any tax gains and the average joe won’t see or benefit from a dime.
Unfortunately, they are moving because it’s the State of IL and all of the issues of operating a business in that State. IL is a State controlled for 150+ years of Democratic rule and their policies.
Joseph, what makes you think companies will use the tax windfall to invest in revenue growth?
We are in the 9th year of one of the longest economic expansions ever. The companies in high growth industries have invested in growth over the last decade and done very well. Other, more lackluster sectors have used the era of 0% rates to borrow money and spend it on buybacks to raise their stock price.
The idea that companies are going to start investing in plant, equipment, and labor in the U.S. is laughable. Spending in those areas went overseas long ago, never to return. Tax cuts don’t change the fact that it is much, much cheaper to outsource. Companies spend money to raise profit margins, not to give Americans jobs. Consistently low wage growth makes it clear workers in this country have not had the upper hand for an extremely long time.
If you believe companies are going to divert the tax windfall to growth in an era of rising interest rates, in the 9th year of an economic expansion, when they are already making record profits, I have a bridge to sell you…
100% expensing of Plant, Equipment and Other is part of Tax reform. That will be allowed for 5 Years only.
You would be negligent in your duties if that wasn’t taken advantage of.
Plus profits sitting oversees will be taxed at a 10% Rate and the system changed going forward that double taxed those profits if brought back into the USA.
Buying Back of Stock is a waste of capital. It only benefits the executive’s compensation.
Free capital and funds should be reinvested into productive assets… not wasted in Paper Assets!
Profits that are also free cash flow will earn a higher rate of return over the long-term if invested bask into real assets to grow future revenue for that company.
In any favorable case the elected leaders has a common root and thats to protect their own state in which they ran for. Their contributions will fall richly in favor of the tax reform only if they believe their citizens will benefit. The agenda forward plans for tough negotiation with every action strongly a move towards their own requirement. Strategically every one wants to accomplish something.
You are confused about who elects leaders in the US. Leaders are elected by MONEY. The biggest money by FAR is from THE VERY RICH, and the VERY PROFITABLE LARGE CORPS. Since “money is speech” per our enlightened corporate shills called the Supreme Court (5 of them anyway), and since these two groups have far more money for spending on politics than any other, THEY RULE THE US. It’s an oligarchy. The ruling party’s contituency is NOT the citizenry (who they manipulated into voting for them with MONEY and the propoganda it generates), it’s the two groups who SUPPLY THE MONEY. So no, helping the citizens broadly isn’t on the agena of the Republican party, nor on Trump’s agenda. Enriching the already filthy rich is the #1, 2, and 3 goal. And there are no other goals. Oh, Trump has goal #0: stay in power. He’ll need a war for that, at least. He’s working on it.
When I gave my vote in an election it was surly underweight but I later realized everything aren’t want it seems in politics. The aftermath was putting the public at risk by changing healthcare that only profited the corporations in America. A leader has to be part of the organization but also feels like part of it exist for the public. My view is that any accomplishment by the federal government regardless of right or wrong deals with a gain in power or money.
Yes… with the exception of Donald J Trump!
He was elected with the least amount of money raised and spent on a Presidential campaign. The working regular people of this country elected this President!
“Completed Right the 1st time, ahead of schedule and under budget!”
The establishment, money and the old guard are going insane trying to smear President Trump!
Joseph, no one is smearing Donald J. Trump.
He smears himself very, very successfully, almost every day!
He’s violating the constitution’s emoluments clause. He violated his oath of office by pushing for the elimination of a free press and free speech. He violating the good faith and name of the US by casually pushing for treaty and agreement exits. He lies continuously, about everything!! He is a SICK, SICK MAN.
I guess we shouldn’t forget about his habitual groping of women. Nor his Russian money laundering. Nor his acceptance of Russian bribes. Nor his coordinating with a foreign power to influence a US election. Nor his obstruction of justice. Just to get started on his list of High Crimes… Yes, Clinton was worse, she used a private email server. Lock her up!!!
Wow… You bought the smear, hook, line and sinker.
I have nothing else to say!
Joseph,
You are bang on with this as career politicians are worried as the gravy train might be ending if a outsider can come and take the top job in the country others more than likely will follow at various levels of government.
That’s why you see these Senators deciding not to run for another term. They are the Senators who were bought and paid for by special interests.
Generally true, but not always. There were a number of successful candidates in recent election cycles who won despite being ridiculously out-spent by the opposition. Check it out….
Kevin, I was curious about where you got that information about President Trump’s groping women. So far as I am aware there has not been a single credible allegation by anyone of that charge. I think it is stunning that a charge like that can be flippantly thrown out without some solid basis for it. Just one man’s opinion.
The Democrats don’t have time to vote. Too many of them are scrambling trying to figure out how they are going to stay out of jail because of all the proliferating scandals surrounding the DNC. I don’t understand why grand juries have not already issued dozens of indictments considering what is in the public domain. I am wondering what they have on sleepy Jeff Sessions.
It is all very strange indeed.
They can throw me in jail first Verne. I dissent. In every way! #resist and all that. There’s a lunatic in charge. Any and every shrink will tell you there’s clear and compelling evidence he’s a demented man. Anywho…it’ll all end in tears. I’m just trying to make some $ off the debacle as the country crumbles due to an utter lack of any American values still remaining in play (except for those exiting the political scene, isn’t that interesting? Fear keeps those trying to maintain their power quiet. That’s call tyranny, I believe.)
My reference to jail time applied only to those people in the DNC establishment who have broken the law, NOT to democrat voters.
You’re exactly correct Joseph!
US Republicans: a massive extortion racket feigned as freedom. US Democrats: a massive extortion racket feigned as fairness.
All lies, no different than corrupt power politics anywhere else in the world.
The fights they put on daily are mere intra-squad skirmishes — shirts and skins — phonied up entirely for show. Any of us peasants who are tempted to get all worked up by this bunch of frauds needs bigger problems and bigger dreams.
Couldn’t have said it better myself Curtis, Bravo!! Clowns to left of me, jokers to the right….. and SNOWFLAKES all around 🙂
presumably as we have invalidated both hourly counts the initial wave down may be counted as a 3. We have not gone high enough for a flat so goodness knows what wave we are in now.
the main hourly is only invalidated with price above 2572 (price can’t go above the high of the first 2). That’s still a ways above the current action. The penetration so far means this is a 1-2-i-ii type of action, rather than 1-2-3-4 action. The implication is for a larger/deeper correction overall. If it all holds up. A key thing to watch is the upper downsloping trend line connecting the ATH and the high from 2 days ago. If that goes…certainly the 2572 is at risk, but still, I will be darn shocked if that goes!
My current model…
So far that upper downtrend line has held in SPX…but barely. Similarly, the downtrend line above price in NDX is holding as well…barely. I suspect there might be a late afternoon sell-off, or it might not come until tomorrow morning. Renewed pushing up of price, instead, would be “fascinating”, to quote Mr. Spock. I’d say shocking but we’ve all been more than shocked before over the last few months. I will act fast if that happens.
I mostly agree Kevin. I think we have completed initial impulse down for a small first wave and are now in a corrective second wave, at least for DJI. I have not looked too closely at SPX…
SPX up to the 76.4% retrace of the wave iii down, and 61.8% retrace of the overall 1-3 downin 2565-66 zone. Time to turn? “Should be.” Invalidation is only a bit higher at 2572. I’ll be watching closely right here for sell triggers to add to shorts, and perhaps jump on a volatility trade too.
A symmetric projection of the last significant 4 wave (The August pullback) size points to a bottom of this 4 wave at 2502. The 4 wave prior to that (mid-late June) projects down to about 2528. The wave 4 prior to that (mid May) projects to about 2524. Then there are interesting fibos, with the most significant at 61.8 and a 1.618 projection both around 2522. Overall, my best estimate right now is that the most likely ultimate low will be in that 2522-2528 range, as that’s the most dense area of symmetric projections and significant retracement/extension levels.
Kevin,
Thank You for sharing all your technical information during each session…it really helps keep me pointed in the right directions!
Hey you are welcome Mike, I’m glad someone finds it occasionally valuable. I really have to stop getting distracted by the politics and economics and stay focused on the action and analysis, because good set ups wait for no one!
Still climbing, trend is still up.
We need this correction to materialise soon if it is going to happen
Still holding long term longs but cashed short terms 2 days ago, hate the waiting game but sometimes doing nothing is the best trade.
Good luck everyone and Lara thanks for the great analysis
The correction is in progress. Strong reactionary thrusts up have to be expected. Look at late July/early Aug daily chart for a similar “topping” period. As well as mid-June. If a full minor 3 (or intermediate 3) develops here as expected, there will be some “roll over” and larger price movement down over the course of the next week or so. But it might take that long to really get going. Meanwhile…some “churning at the top”. Of course it could all dud out and the market explodes back to the upside, not impossible and me, I’m staying alert and responsive should the market misbehave so much!
I am not so sure Paresh. I am seeing spastic, low volume, almost knee jerk reactions against what I suspect is now a down-trend. VIX suggesting this might indeed be the case….
My the little bullocks are frisky this morning!
Steak anyone? 😀
Even a minor degree fourth wave should see some sort of VIX capitulation spike close to its conclusion. The mindset of matket participants who are short volatility is now such that many of them may roll the dice and sit tight, aiming to ride it out to the next ATH. If that hapoens, I would be looking for a higher low. Then again, VIX may cross 15 and force the issue…
Liquidity Math to Date: i.e. the loss of Liquidity to the Equity markets… equity market was the largest benefactor.
ECU: to remove 30 Billion Euros per month of Liquidity for 9 months starting January 1… then remove the remaining 30 Billion, which ends their QE.
Fed: A Balance Sheet reduction (runoff) of $10 Billion per month increasing $10 Billion per quarter to a max of $50 Billion per month.
Total Worldwide Reduction of Liquidity scheduled as of Today:
Oct: $10 Billion
Nov: $10 Billion
Dec: $10 Billion
Jan 2018: $50 Billion
Feb 2018: $50 Billion
Mar 2018: $50 Billion
Apr 2018: $60 Billion
May 2018: $60 Billion
Jun 2018: $60 Billion
Jul 2018: $70 Billion
Aug 2018: $70 Billion
Sept 2018: $70 Billion
Oct 2018: $100 Billion
Nov 2018: $100 Billion
Dec 2018: $100 Billion
Jan 2019: $110 Billion, etc, etc.
The above is actually more in Dollar terms but I did not want to do the currency adjustment. But all is about 18% higher as of today.
But this does not tell the whole liquidity story… Stock Buybacks will end January 2018 due to Tax Reform. Instead of Stock Buybacks Corporations will take that money and invest in productive assets here in the USA… to take advantage of Full Expensing for tax purposes of Plant, Equipment and other for the next 5 Years. ONLY investment in this will create Real Revenue Growth and in effect additional GDP growth in the USA to 3% – 4% maybe + range.
To Sum Up: Money Flow into Paper Assets will END (Equity Prices) and Money Flow into Real Assets will expand greatly! What happens over the next 18 to 24 months while this occurs… a major adjustment to Paper Asset Prices to the Downside.
A Cleansing… Then once completed the foundation for the next Real Bull market based on Real Productive Growth!
Amen!
Althogh it is not for every one, mid-week trend changes can offer fantastic short term trading opportunities as strong moves often occur on Friday. If we are in some kind of second wave bounce as I suspect, options expiring this week have the potential for explosive gains if a third wave down unfolds. One does not see this situation very often, but a small well-placed option trade can let you do some early Xmas shopping! 😉
invalidated – could be a 3,3,5 expanded flat correction in which case it looks like minor degree.
nearing invalidation point!
The Truth is all about to be revealed!
Deep Corruption, Cover up and Treason… Lock them all Up!
Many in government will go to Jail… Finally! Including the Clinton’s and all around them.
Truth always rises to the surface! It doesn’t pay to Lie!
I don’t know about that (“it doesn’t pay to lie”). 69% of what emanates from Trump’s mouth is a falsehood (very well measured!). He seems to be doing quite alright. But the story is still being written there. Let’s see if the chickens ever come home to roost for him. I’ll be fascinated when he ends up under oath, testifying in his own defense. His inability to speak honestly might at that point create some problems. Judges and courts don’t take to lying under oath too well.
Measured by the Lying media!
You need to change where your getting your information.
On Policy… everything President Trump said he would do in his Live events (which I listened to almost all without edit or commentary)… he is trying to accomplish in Office!
No politician has done that in the past! Most in the past say one thing to get elected and the completely change in office.
Not President Trump… He is trying to accomplish all that he said prior to be elected.
He is there to solve problems and to get results as fast as possible. NOT there to talk and talk and talk and talk and talk and talk and talk and talk and talk and talk and talk….
and get absolutely nothing that really matters done!
Your True Belief pretty much says it all as to what’s damaged in this country.
Your true belief damaged this country among other Progressive & socialist beliefs.
Bigger dreams, maybe, guys?
Careful out there Doc! 🙂
dont worry,, they will be fine,, cartoons always survive,, how many times did Wiley Coyote survive ? meep meep
Wow! Surf is up today!!!
The forecast is better than the reality. Still, it was overhead on the sets and clean this morning here in Tonga. Got a few nice waves. Getting over my fear of the coral reef. Got totally worked a couple of times.. and survived 🙂
Great to hear Lara!! Keep Charging!