
The short term Elliott wave count is changed but the target remains the same. A new alternate Elliott wave count with a new short term target fits continuing bearishness with indicators, notably market breadth, VIX and RSI.
Summary: The structure is now incomplete and at least one more high, if not a few more days of upwards movement, should be expected now before a pullback.
The more bearish Elliott wave count has a target at 2,579; thereafter, it expects a strong pullback. The main Elliott wave count still has the same target at 2,602 to 2,614.
Always trade with stops and invest only 1-5% of equity on any one trade. If trading a correction against the larger trend, then reduce risk to 1-3% of equity.
Last monthly and weekly charts are here. Last historic analysis video is here.
MAIN ELLIOTT WAVE COUNT
WEEKLY CHART
Click chart to enlarge.
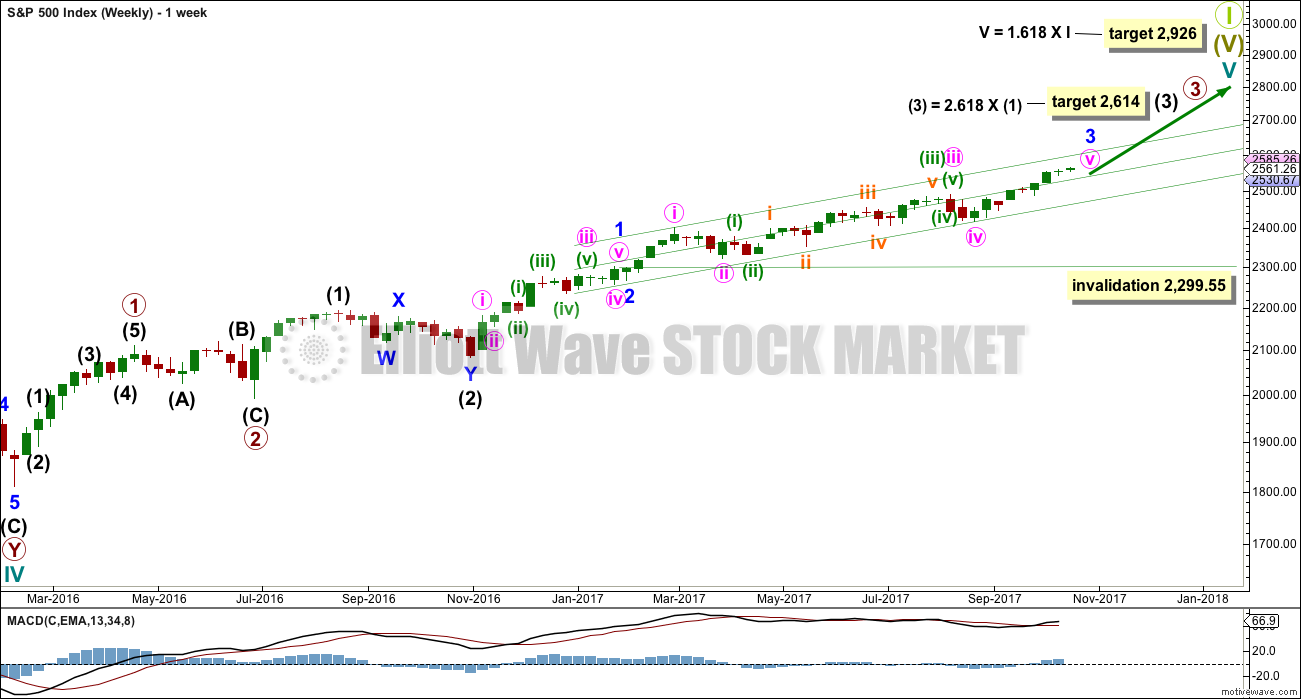
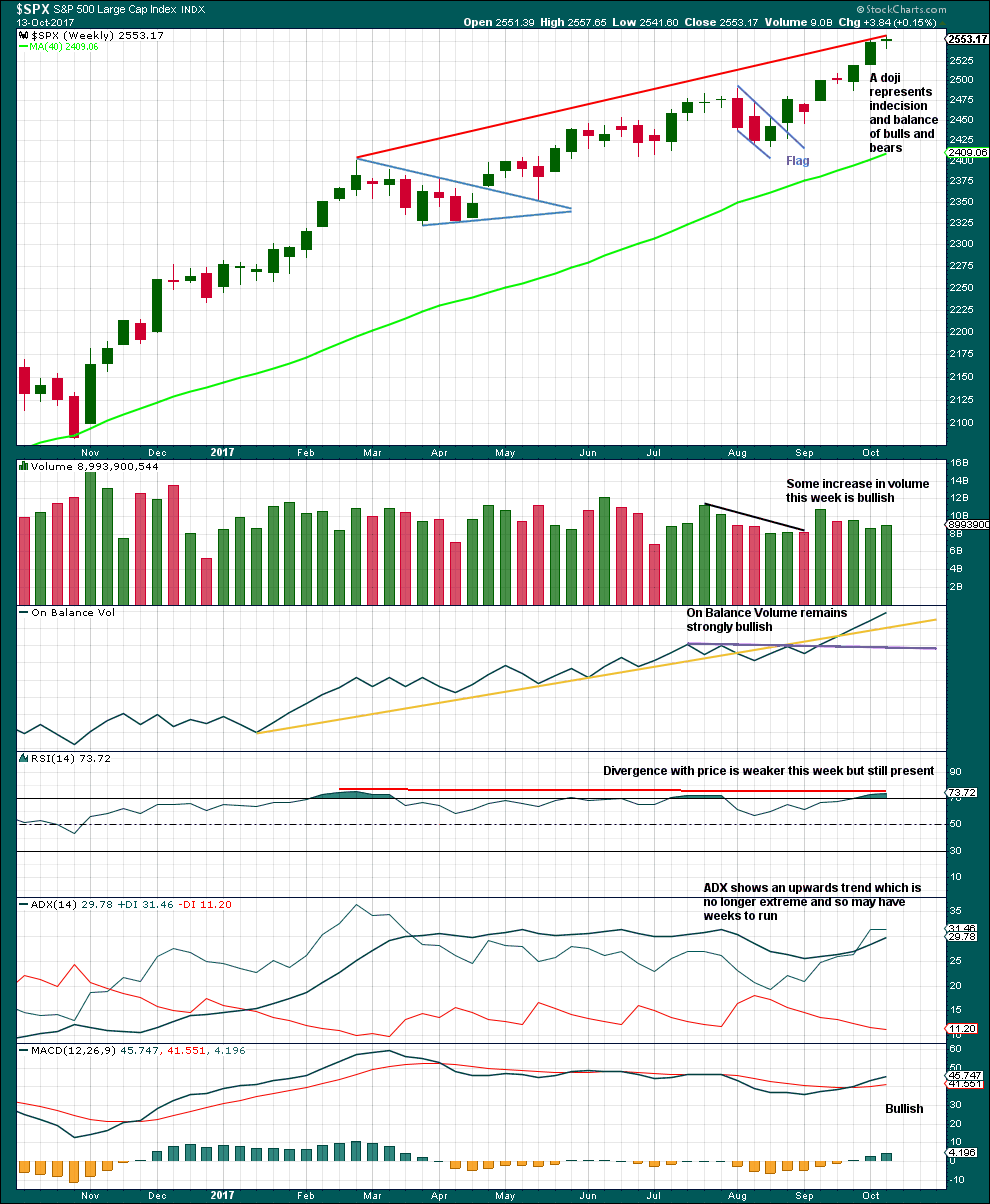
This wave count has strong support from another bullish signal from On Balance Volume at the weekly chart level. While classic analysis is still very bullish for the short term, there will be corrections along the way up. Indicators are extreme and there is considerable risk to the downside still.
As a Grand Super Cycle wave comes to an end, weakness may develop and persist for very long periods of time (up to three years is warned as possible by Lowry’s for the end of a bull market), so weakness in volume may be viewed in that larger context.
Within minute wave v, no second wave correction may move beyond the start of its first wave below 2,417.35.
The next reasonable correction should be for intermediate wave (4). When it arrives, it should last over two months in duration, and it may find support about the lower edge of this best fit channel. The correction may be relatively shallow, a choppy overlapping consolidation, at the weekly chart level.
DAILY CHART
Click chart to enlarge.
To see details of the whole of primary wave 3 so far see the analysis here.
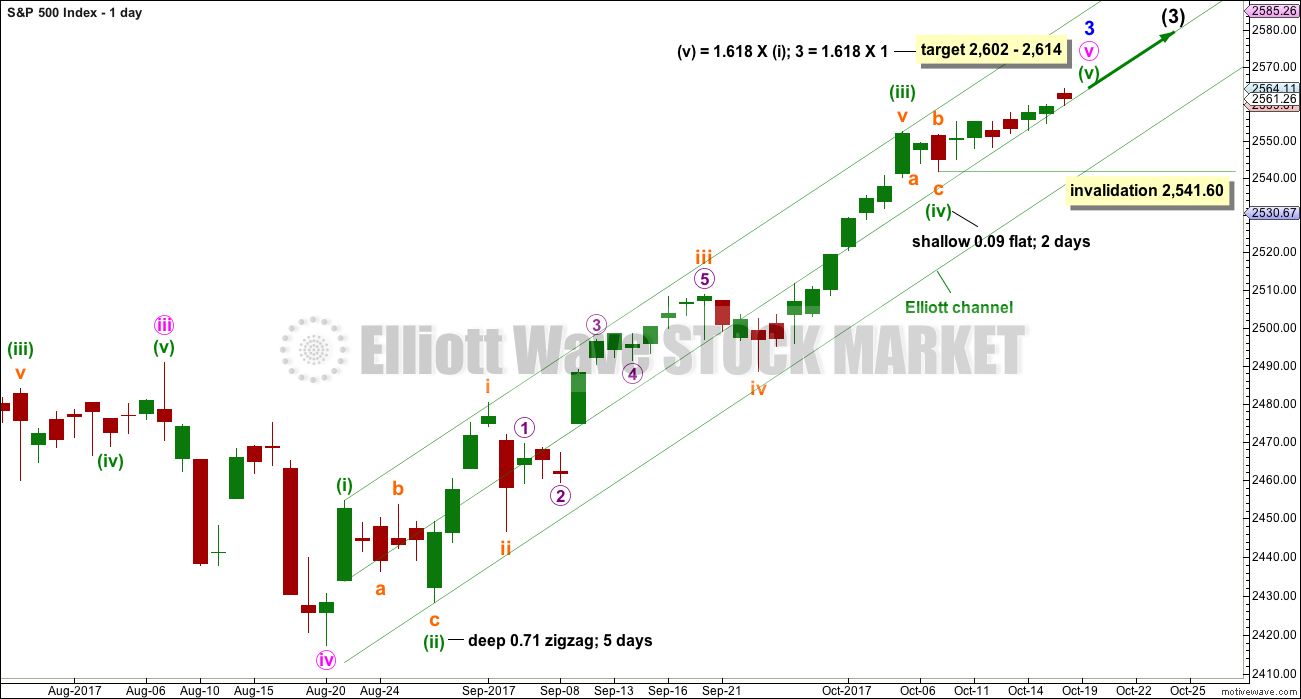
Minute wave v to complete minor wave 3 must subdivide as a five wave structure. It now looks like it could be complete at this time frame, but the subdivisions at the hourly time frame do not look complete. Minute wave v could be over very soon.
Upwards movement from the low labelled minuette wave (iv) has now moved further then twice the length of subminuette wave a; upwards movement should no longer be considered to be a possible continuation of minuette wave (iv) as now subminuette wave b within it would be longer than twice the length of subminuette wave a. This alternate idea, which was published as an hourly chart up to yesterday, is now discarded.
This adds confidence that minuette wave (iv) must be over, even though it was surprisingly brief.
MAIN HOURLY CHART
Click chart to enlarge.
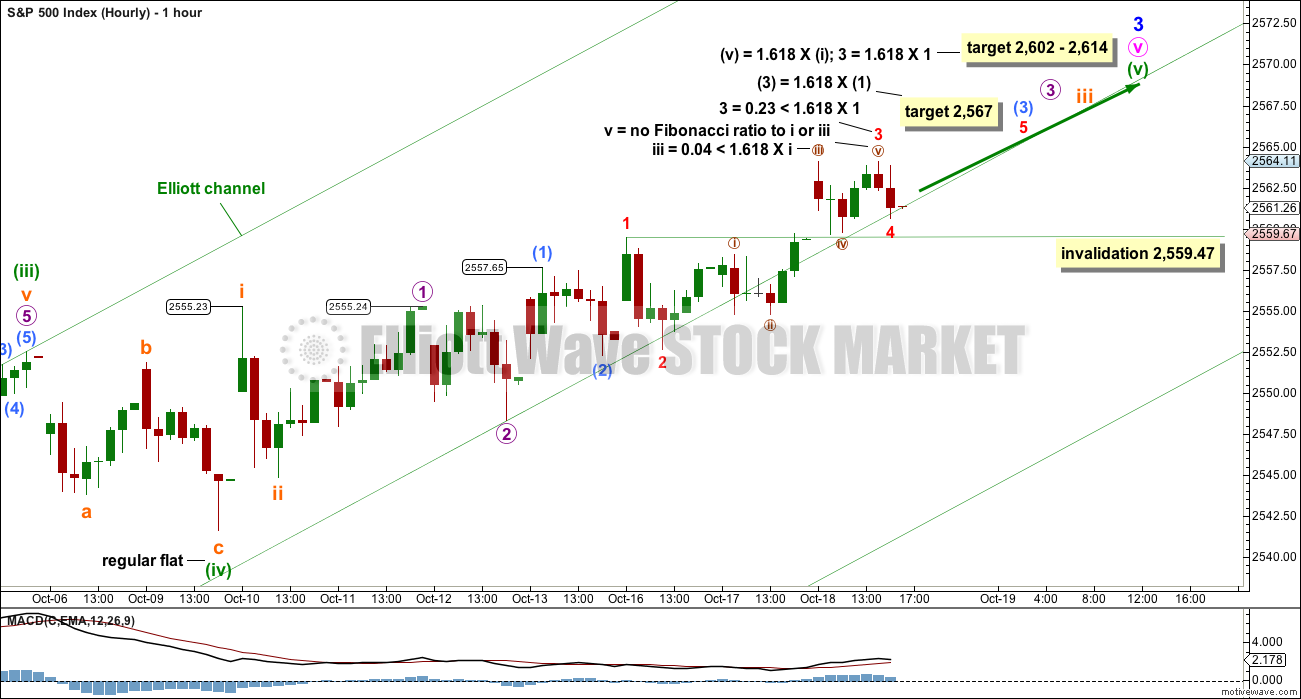
With continued bullishness in price and a correction today that does not overlap the last small swing high, it is possible that minute wave v is continuing further as an impulse and has just passed the middle of its third wave today.
Minuscule wave 4 may not move into minuscule wave 1 price territory below 2,559.47. While price remains above this point (prior to a new all time high), then assume the upwards trend remains intact.
If price makes a new high, then the invalidation point must immediately move lower to 2,557.65. A new all time high could be the end of sub-micro wave (3). The following correction for sub-micro wave (4) may not move into sub-micro wave (1) price territory below 2,557.65.
ALTERNATE HOURLY CHART
Click chart to enlarge.
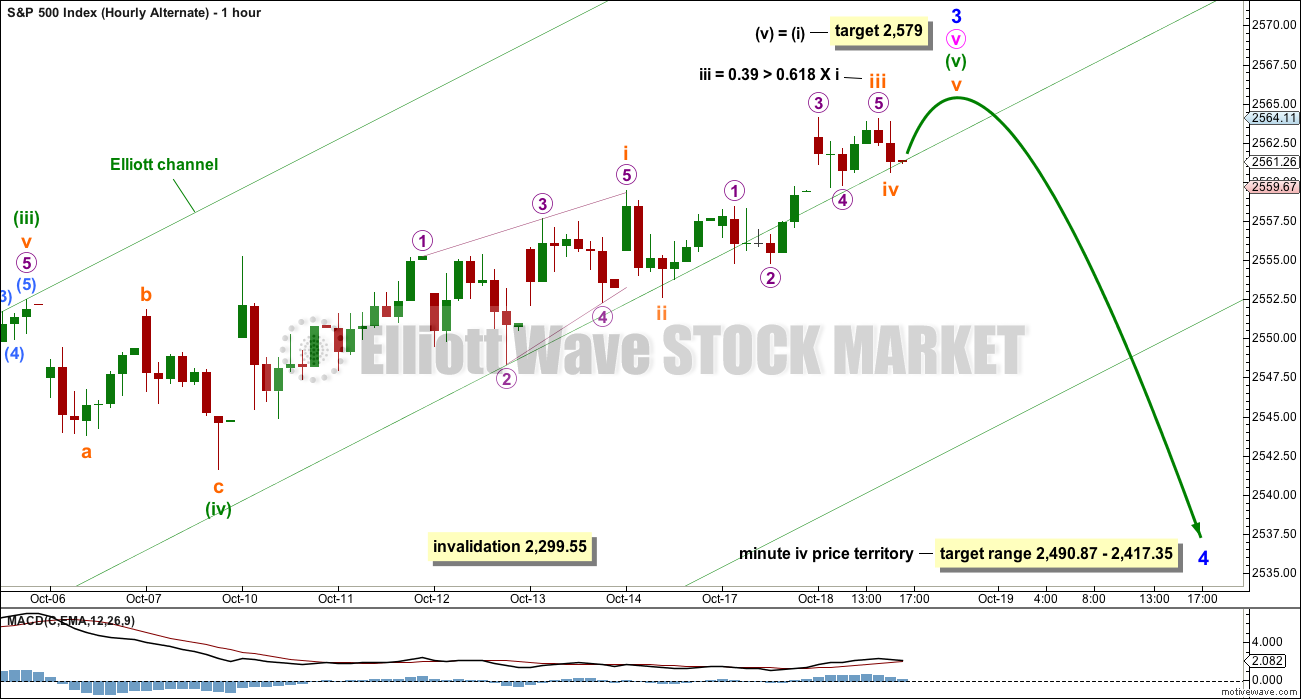
It is possible that minute wave v is closer to an end than the main hourly wave count expects.
I have tried to see if the structure of minute wave v could be labelled as complete and meet all Elliott wave rules. So far I have not been able to find a solution; there is too much overlapping.
This wave count expects that subminuette wave i was a leading contracting diagonal. This structure looks typical, but the only thing that is atypical is the shallow correction of subminuette wave ii following the leading diagonal. Second wave corrections following first wave leading diagonals are more commonly very deep.
Subminuette wave iii will subdivide very neatly so far as an impulse. The final fifth wave of micro wave 5 is very slightly truncated. In this context of weakness there may now be enough of a developing pull to the downside to force a small truncation.
This wave count requires only one more high for the structure to be complete. The target assumes the most common Fibonacci ratio for minuette wave (v).
Thereafter, minor wave 4 may begin. It may last a few days and may end somewhere within the price territory of the fourth wave of one lesser degree.
TECHNICAL ANALYSIS
WEEKLY CHART
Click chart to enlarge. Chart courtesy of StockCharts.com.
Again, this week this chart remains very bullish. A doji on its own is not a reversal signal, and doji may appear as small pauses within upwards trends.
RSI is overbought and exhibits longer term divergence with price, but not short term. If short term divergence develops, then a pullback would be more likely. RSI may move higher to further overbought and may remain there for a reasonable period of time during a strong bull trend in the S&P500. On its own, it does not mean a pullback must happen here and now; it is just a warning at this stage for traders to be cautious and manage risk. Overbought conditions mean the risk of a pullback is increasing.
DAILY CHART
Click chart to enlarge. Chart courtesy of StockCharts.com.
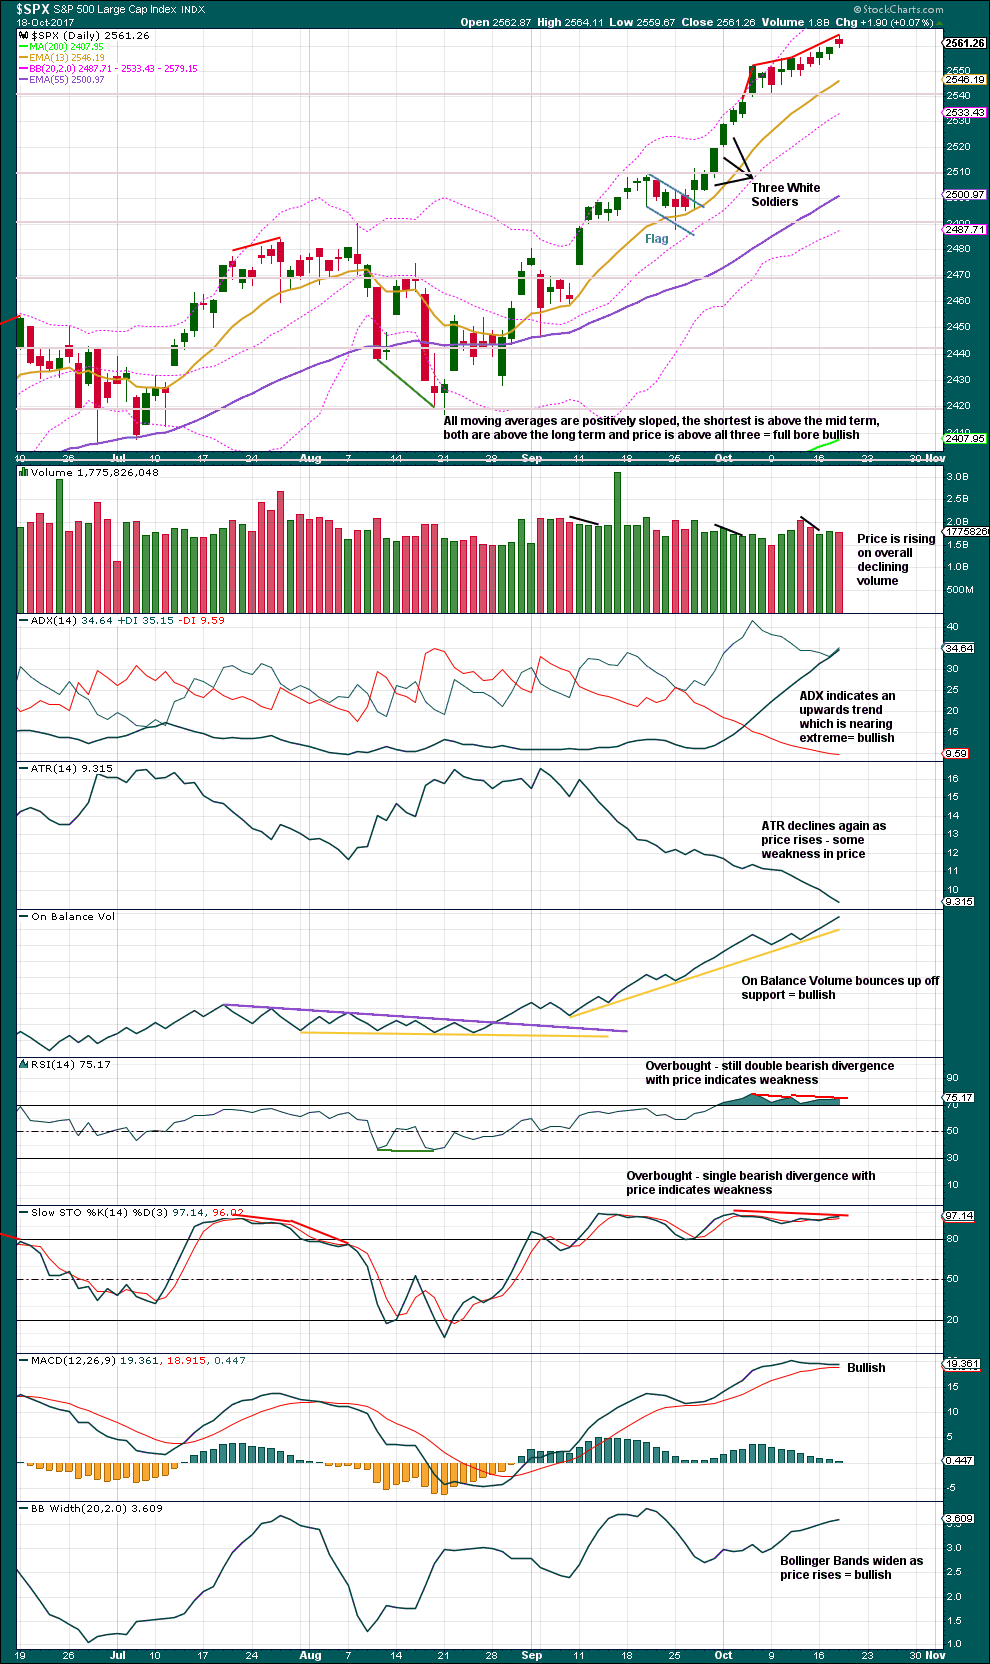
Price continues to rise despite overbought conditions and persistent bearish divergence. Volume overall continues to decline, yet price rises.
This upwards movement is weak and a pullback or consolidation will come, but it has not arrived yet. Assume the trend remains the same until proven otherwise. Proven otherwise would be a candlestick reversal pattern on the daily chart.
VOLATILITY – INVERTED VIX CHART
Click chart to enlarge. Chart courtesy of StockCharts.com.
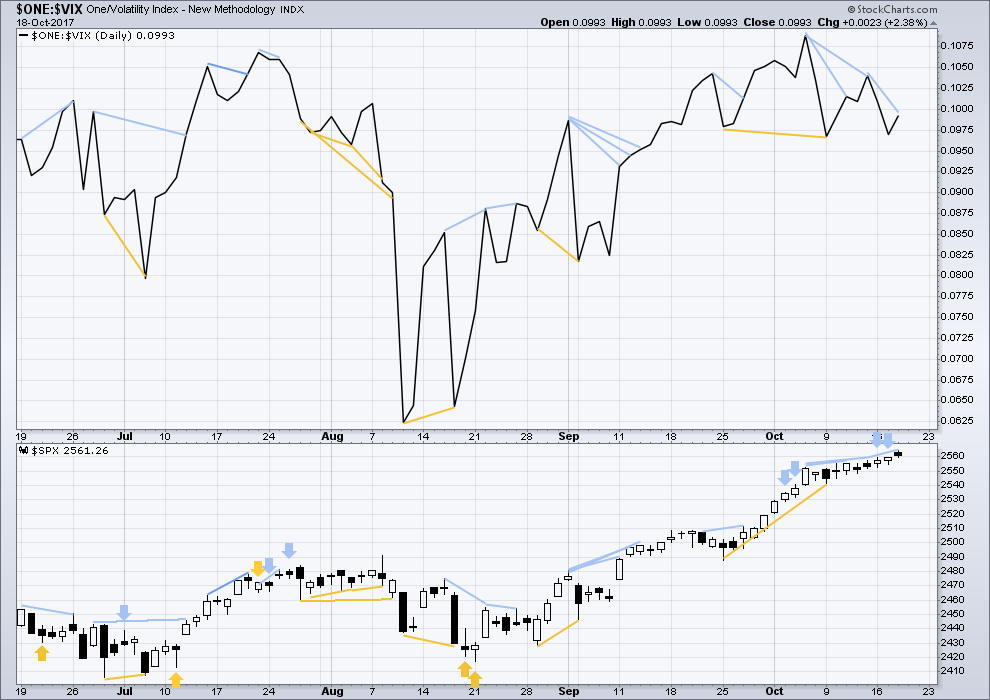
Normally, volatility should decline as price moves higher and increase as price moves lower. This means that normally inverted VIX should move in the same direction as price.
There is still bearish divergence. Price has made another all time high, but inverted VIX has not. Upwards movement of price is weak. But so far this divergence has failed in the last two instances to lead to any pullback.
BREADTH – AD LINE
Click chart to enlarge. Chart courtesy of StockCharts.com.
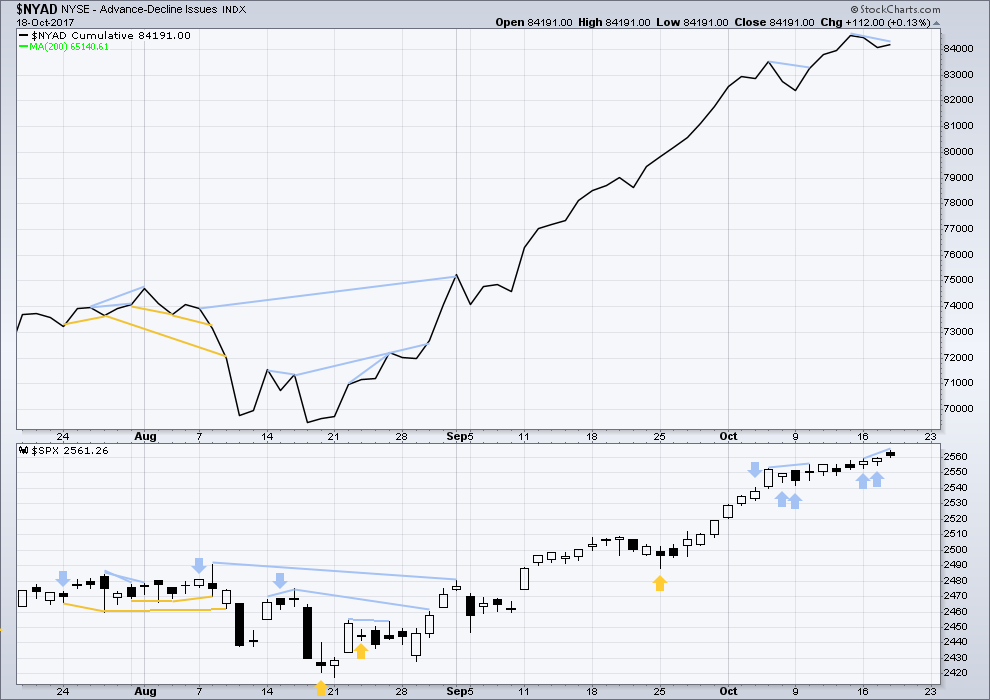
With the last all time high for price, the AD line also made a new all time high. Up to the last high for price there was support from rising market breadth.
There is normally 4-6 months divergence between price and market breadth prior to a full fledged bear market. This has been so for all major bear markets within the last 90 odd years. With no divergence yet at this point, any decline in price should be expected to be a pullback within an ongoing bull market and not necessarily the start of a bear market.
The last two sessions that saw price rise and breadth fall has not led to any pullback. This bearish divergence may have failed, or it may be an early warning of a sharp and deep pullback.
There is still bearish divergence between highs: price has again made a new all time high, but market breadth has not yet made a corresponding high. This indicates weakness within price, that it does not have support from breadth.
Small, mid and large caps have all made new all time highs. The rise in price is supported in all sectors of the market.
Go with the trend. Manage risk.
DOW THEORY
All the indices are making new all time highs. The continuation of the bull market is confirmed.
The following lows need to be exceeded for Dow Theory to confirm the end of the bull market and a change to a bear market:
DJIA: 17,883.56.
DJT: 7,029.41.
S&P500: 2,083.79.
Nasdaq: 5,034.41.
Charts showing each prior major swing low used for Dow Theory are here.
Published @ 07:53 p.m. EST.
Hello I was hoping you might give a long term spx count , a monthly back to 2000 or more. Maybe on the Friday video.
Thanks your work is great and has helped a lot
No breaks. Tax reform is about to pass and SPX is about to go to 2600. How on Earth was this not priced in already.
still going up…………….!
If this is subminuette (orange) wave ii, then the close was at an 88% retracement.
Updated alternate hourly wave count:
The depth of the drop at the start of this session indicates strongly that minute wave v should be over. Which means that minor wave 3 should be over.
Minor wave 2 was fairly brief as a quick zigzag. Minor wave 4, if this is what this is, should be more time consuming. It may be shallow and sideways, just another shallow consolidation. Or it may be deeper. Impossible to tell at this stage.
But what I can say is that it should have only just begun. A wave at minor degree should begin with a five down on the hourly chart and that is incomplete. While that is incomplete we should not see another ATH. If we do get an invalidation of this then I would expect the pullback is over and the upwards trend resumes.
This will be the new main hourly wave count. I’ll have a more bullish alternate. The price point that will differentiate the two ideas will be 2,541.60. We need a new low now below this point to have strong confidence that minor 4 is underway.
A new ATH will indicate minor wave 3 is not done. The pullback would then be labelled subminuette i within minuette (v) of minor 3.
Looks like three days in a row of bearish signals from the AD line were a harbinger of a pullback.
Yep! I agree!
No payday today for my IYT puts unfortunately though.
Maybe tomorrow?
Have a great evening all! 🙂
Lara,
Anyway to see movement up from green minute 4 as an ending diagonal to ATH whether it be completion of minor 3 or alternatively just subminuette 1 of minute 5 rather than as an impulse?
Well, I can make it work regarding wave lengths, but the trend lines are overshot way too many times. Technically it can work and meet all EW rules, but it looks so horrible… I wouldn’t be comfortable publishing the idea. And the overshoot of the fifth wave is far too large.
I’ve had a play trying to see it differently, and this is the only way I can see which meets EW rules regarding wave lengths and iv overlapping i territory.
Thanks.
Market makers apparently do not thing volatility is going much lower.
Spread on next week’s 10.00 strike calls back to 0.75/0.80
We need to wait and see how things close.
I suspect going forward we are going to be seeing bigger and bigger plunges in futures that get bought back during the session.
Call me crazy again (after saying BTD this morning), but I honestly think it gaps up tomorrow. (certainly not playing that with a position, however)
Possible. I can see a bullish wave count for that. But… lets see what volume says about this downwards move. And lets see how this closes.
If we get a bearish signal from On Balance Volume, then you know how seriously I’d be taking that.
Another very boring day in the market, will it ever change?
So boring I can’t stand it anymore!
…. ARRIVEDERCI Baby! …..
IYT looks like a 3,3,5 upward flat correction on the 15 minute chart. If so, we should get a turn down shortly….
I mention IYT because it is often helpful to look at other markets when there is some uncertainty about what is going on with the majors. I think the big reversal we saw in DJT warrants some caution for a bullish outlook near term….
I think VIX ten is now support and am tempted to change limit order to contingency order with any move below by even one penny…..let’s wait and see how she closes as Nick says. I think that would be a smart approach…. 🙂
Spread on VIX calls down to 0.70/0.80.
Lowering limit order to 0.50 per contract as VIX heading lower.
Will adjust if it heads higher prior to being filled.
0.50 per contract would be awesome! 🙂
A hanging man is forming on the daily, but we need to wait for the following day’s candle for confirmation that this is a bear signal.
What I don’t understand is, if all these banksters are buying in order to protect their profits but they know the tide will turn against them eventually, why don’t they start massively shorting and make a killing on the way down?
Great question. I think the answer is they are not making their money in the markets and have not for quite some time. The big money is in derivatives held in dark pools. Those derivatives are tied to equity and bond prices and remain viable as long as price of those assets do not collapse. Equity markets represent chump change for these guys.
Re-buying next week’s VIX 10.00 strike calls once again for limit price of 0.55
Nice double on pop this morning ( unloaded for 1.10 )
Current spread at 0.70/0.85
Stepping down to a 15 min chart, SPY, QQQ, and IWM all show a nice zigzag up from the morning lows. Is that zigzag a b-wave or a 2-wave? Either way, that would call for another down move next. Is there another interpretation? QQQ triangle?
Some on the board see the price action as bullish Ron.
All things considered, I think the move up is corrective, but that is just me! 🙂
ps. I also like to keep an eye on VIX for a clue as to what might happen next and it is not trading as it normally would ahead of a third wave up FWIW….
The VIX is foreign to me… I’m still a greenhorn. I need a crash course on it. 🙂
Easy! Buy when cheap, sell when expensive.
Right now, under ten is cheap, over eleven is expensive, if you trade options that is… 🙂
Hard to say. Most likely, completing a B of an ABC correction down. (Contrary to my earlier view of a new impulse 3 up in progress.) Exactly what type of ABC, I dunno. Price has closed the morning gap…this is an “obvious” place for it to turn back down. Any thrust up and through yesterdays close, and a close above it, has to be interpreted, given the hugely bullish backdrop, as quite bullish for the short term (and I’ll be instantly back to my earlier view!). Otherwise, a turn here supports a probably multi-day down/sideways movement, i.e. what Lara has been calling for. Which would make this just the opening scene.
I agree. Move up from this morning’s low looks like a possible zig zag at the moment. Will need a bit more clarity before I’m willing to go long.
I also spotted Rodney’s short trade earlier today and took it. Got out quick with a tiny loss.
Just as we have had many bearish signals negated during the long bull run, close to tops it is not at all unusual for ordinarily bullish signals to end up being bull traps. The hammer has been a very reliable reversal signal but that is usually after an established downtrend. What we are seeing today is NOT technically a true hammer, although the long lower spike COULD be bullish. Of course what do I know…?! 🙂
You know a lot Verne 🙂
I’ll be calculating that lower wick carefully today. It needs to be minimum 2X the real body for a hanging man / hammer pattern.
The low risk short entry position I mentioned around 11 AM has proven a bust. This morning’s gap is being filled as I write. We may even print a daily hammer candlestick on the SPX.
When using low risk entry points, the trick or key is to get out as soon as the market moves against one’s position. That way it truly ends up a low risk and low loss. Those who overstay the position ‘hoping’ it will reverse usually take a greater loss.
a good point Rodney
hope is a terrible investment strategy
…. ARRIVEDERCI Baby! …..
I’m looking at the action through the lense of the prior hourly main that had the action from Oct 5 as a leading diagonal 1, and today we get the “deep” (relative to the leading diagonal) 2. Meaning, price is now in the 3, probably the 1 of the 3, and a 2 of that 3 should commence soon. Then a 3 of a 3 to new ATH’s. That’s my current roadmap, anyway.
So far as I can tell, the smash volatility trade is dead, the Yen carry trade is dead, the ramp of select index stocks probably say its acme with the IBM spike yesterday so what is left? Are they now going to start buying ETFs like BOJ?!
3 points from green. Ain’t that some bo log na.
Well, will the banksters succeed in negating yet another bearish reversal?
They are burning billions in what looks like a last stand…. 🙂
Not to be crude but you have literally been saying this for six months now. I fail to see any evidence whatsoever of a “bankster” conspiracy. It’s just the market doing it’s thing.
What I like about Lara’s analysis is that it is relies on price alone and not theories about market manipulation. Technicals are firmly bullish.
ARRIVEDERCI Baby!
LMFAO here. Oh, laughter is so healthy….TY!!!! As an old landlord once said, “paranoia can be fun!”. As can conspiracy. Meanwhile, back to the market action…
Don’t talk, just Buy! 🙂
Great advice, I bought some MLM, and it’s been going straight up for 30 minutes now. Trailing stop under the 5 minute bars. I love bull markets!
No offense gentleman, but the presence of the “plunge protection teams” globally has been a mainstay this entire cycle. No conspiracy, just fact. For reference see the public holdings of any of the following central banks; BOJ, BOC, ECB, FED, BOE, BOS. IMHO, today was the BTFD crowd plus market makers. The volume characteristics of the 3 candles around 10am do not scream “Central Bank Buying” to me. They’ve been very very very successful training the algos to do their bidding too.
Hey Chris, I kinda figured out that there are different levels of appreciation of market dynamics on the site…’nuff said! 🙂
takes two sides to make a market….. 🙂
Bid on IYT puts still a measly 2.05.
VIX needs to pop above 13 before we see some decent premium on option contracts.
Lowering STC order to 2.40 from 2.50 and will switch to bearish call spreads when filled.
SPX hammers have been very reliable signals of continued upward movement. I think we have one more wave up so another VIX buying window could be just ahead thanks to the largesse of you-know-who.. 🙂
Assuming of course that the hammer holds…..
Boy they are burning through a ton of cash this morning…..yikes!
for it to be a hammer it has to come after a downwards trend
the same candlestick after an upwards trend is a hanging man
a hanging man requires bearish confirmation in the following candlestick though, because of the bullishness in the lower wick
Bought back my VIX 10.00 strike short calls for 0.12 and would love to re-sell but I doubt we will see a sub-ten visit anytime soon. Opening contingent order just in case…I could get lucky… 🙂
Oops! Meant my VIX puts of course!
Selling December 10.50 strike VIX puts for 0.45, 100 contracts.
Opening limit order to buy to close at 0.20 or better
My sincere thanks to the banksters for the mid-morning pump that let me buy back my SVXY puts at a smaller loss than expected!
I knew I could count on ’em…. 🙂
if they’re going to be this reliable, may as well make $$ out of them!
Low risk entry to short side right now as SPX has tagged the underside of the upward sloping wedge. Also on the 5 minute chart we can label a five down and three up.
Remember Lara warns that entering a short position while the trend is still up can be risky and a fool’s game.
Exactly as expected my man! 🙂
I don’t know about the significance of that little trend line as resistance, though I do think we are in a B of some kind of ABC down, and I may be looking for a short here. I’d like to see the gap filled first though, to take that positional risk off the table. We’ll see.
Banksters are formidable but charts do not lie. In addition to Rodney’s observation regarding SPX, we also have an island reversal pattern in play. They are no doubt going to make a valiant effort to negate it. I suspect we will instead see the DJI gap from yesterday closed. This is such fun! 🙂
They certainly are, took VIX gains, reloading right now
Me too! Huyk! Hyuk! 🙂
My question is are we in part of the first wave 3 down or in the first wave 5 down? I think the spike to 2556 area was part of a wave 3 rather than a 4 of 5.
Three items to note regarding the SPX:
1) So far today we have the largest hourly decline since the August 21st low. I am looking for the largest daily decline since Nov. 2016 which I believe was March 21st of about 32 points. If and when we exceed that daily move down, then it tells us the move up from Nov. is complete and a correction of the entire move is underway.
2) Daily MACD has a bearish crossover as of this morning.
3) The upward sloping wedge formation (ending diagonal in EW terms) has been broken to the downside.
Interesting times. I am not of the BTFD crowd and will not be anytime soon.
Lets see is the gap on today’s 5-minute chart gets filled.
Yes sir! One of the things I have always liked about your perspective Rodney is you are a big picture kinda guy. Many months ago you called the cup and handle target on IWM at 148 and I thought you were nuts! 😀
The VIX short sellers are all breathing hot and heavy this morning…I got news for ’em!
For me the critical level is the crossing of the lower trend line and the 24.6% fibo, far upper right on chart. Holding/turning just above it, so far.
There was a significantly larger hourly downmove on 9/5.
I don’t particularly see any giant rising wedge. I see a symmetric trading channel from late August to today, with a confirming bounce off the lower channel line so far today. As for the much larger trading channel running since Nov ’16, price is well inside that channel, with no current threat to channel boundaries at all.
I see nothing so far to indicate in any way the bull market rise is over. Not a thing. I wouldn’t be suprised if the short term channel line does get taken out over the next few trading days, and price gets approaches the larger channel line. But until that larger channel line is taken out, the bull is perfectly healthy. In my opinion. Chart attached to show what I’m talking about.
Hey Kevin. Thanks for the comments. I have the same channel lines drawn as you do and I’m watching closely. I may have mispoken. But I did not say a “giant” rising wedge.
You are correct the 9/5 drop has a larger hourly candle. I am counting from the close of yesterday essentially counting this morning’s gap as part of the hourly bar. But 9/5 is a couple of points larger. My mistake.
In a comment further up I state, “Remember Lara warns that entering a short position while the trend is still up can be risky and a fool’s game.” Thus, I am reminding all who read this that the trend is still up and there is no final evidence the bull run is over. Lara has even stated that any correction is an opportunity to go long. I suspect she will see today as one of those opportunities.
Me, I am not going long any time soon.
I am just putting up some observations I see.
No worries mate, sorry if I mis-quoted you. I certainly found a few long entry opportunities as particular issues over-reacted to the downside. I added some SINA right at it’s bottom today, and with the bounce so far my overall position is back to BE. ICE, similar story. I missed FSLR; that issue seems to frequently sell off hard, then charges back really strong. I think there are excellent long set ups here and there for sure. I for one don’t think this current correction is close to over, so waiting is good, I think we’ve got several days worth to come, minimum, for the mere reason that “it’s due”, and no other. Could be wrong, could be right back to the upward bull march, which I won’t complain about a bit. We’ll see.
I was the one that mentioned the wedge. It can be clearly seen from the August 2015 price low. Contained within the larger wedge was an even smaller one. I am not sure what time frames you guys are looking at but it could be too small to see what I am talking about.
Here’s a weekly of SPX, with all reasonable attempts at upper trend lines drawn in, along with the primary lower trend lines as I see them. What this tells me is that price momentum has been accellerating, resulting in upper channel (wedge) lines twice now getting violated. Which means they helped convey information about the market, but were meaningless as any kind of indicator of a market turn. Only when the LOWER trend line gets violated, does the UPPER trend line get some mystical significance (“see, it was a wedge!!”). In other words, I don’t buy that wedges have any significance whatsoever. After the fact, one of them looks significant, while the 2 or 3 others that are history are just that, forgetten history. Sorry to be so contrarian to some elements of TA religion, but I do find some of it to be little more than mumbo jumbo, not backed up by chart data analysis. I could be wrong.
At this rate, that daily macd cross might be negated.
Yesterday’s DJI gap is really the key. We fill it and the banksters are toast. If it remains open correction will be short and sweet and we head higher at least short term until we see futures down a few hundred points….he! he!
A pullback in the DJI that fills yesterday’s opening gap will be a total pullback from the ATH of (wait for it…)……0.74%. Less than 1%. Yup, that should toast ’em!
Buy! Buy! Buy! 🙂
The market makers are already starting with the garbage, Spread on my IYT 175 strike put a ludicrous 1.85/2.30 so I guess I will just hold onto them for the time being. I may just have to exercise those options to get a fair price. Expect to see more shady dealings in the days ahead as this thing gets ugly. I could probably get filled at much better than the bid but it still ticks me off when they do this. 🙁
Some of the best trades one can make in my opinion, is by recognizing when volatility is mis-priced, both at the top and bottom. The spikes up are easier to spot, the bottoms are much more dicey. Even if you are wrong 50% of the time you can still do really well trading vol with good risk management. I noticed VIX was putting in a rounded bottom a few weeks ago and then it penetrated a long held down-trend line to the upside. I at that time casually mentioned that it might not be too early to start getting positioned. As I recall I had at least one person scoff at the idea. 🙂
Of course I did not take the derision personally as I like to eat my own cooking so to speak. At any rate, not only did I open some short trades, some of which I posted, I also started trading the smack-downs of VIX below 10 as I thought the trend had changed. That is a neat trick at the beginning of a new trend to get positioned with a very low or even zero cost basis. By selling the pops of the new trend and buying back the declines you can get in at practically zero cost basis in a few trades. No charge!
🙂 🙂 🙂
Beautifully done. Thanks Verne for sharing your expertise with all here.
To newer members: watch and read carefully. This guy really knows what he’s doing, and as he says, good risk management is the key.
Only follow with actual trades if you have reasonable experience, otherwise just watch and learn. You can learn a lot from the trades posted here from Verne and others.
Nothing like making 20% on calls in 3 mins. Done for day.
Nice scalp!
I am after a 10X haul myself! 🙂
My last minute decision to buy a little SPXU yesterday just as the market was about to close on a slightly weak note is turning out nicely. Now can I take profit before price is back to a new ATH? Lol!!! Who knows. I would not be suprised this time by more than a single spike down, though.
Call me contrarian. Looks like a BTD opportunity. Lets see what cash open brings. Jobless Claims, Manufacturing… all numbers great minus China “asset bubble” stuff. (which will be forgotten as they have said that for over a year now)
You certainly would not be alone in that view. In fact, I am counting on it as I think the sweet spot for us bears will come sometime next year when the BTFD crowd jumps on the initial decline and drive a manic second wave correction. Buy! Buy! Buy! 😉
Right with ya. Just don’t think the end is now.
We will get some clues. The market has been signaling weakness for some time so the breakdown should come as no surprise. The question now is how much firepower the banksters have left. If they buy it back in the green, then I agree we are going a bit higher. The bears could also let them continue the futures ramp and gap it down massively at the open. If we descend below the lower boundary of the rising wedge from August 2015 after yesterday’s throw over, the decline will be deep.
Personally looking for calls around 2545. Maybe 2541. Nothing below that, however.
ARRIVEDERCI Baby!
We are probably going to fill DJI’s gap from yesterday making it an exhaustion gap. Looks like I will be buying back my SVXY short puts at the open. What did I tell ya about my being a contrary indicator? lol!
No question the banksters are furiously buying but they are facing serious push-back and relentless selling pressure; I think they are going to loose.
Thankfully, I am massively net long vol and those IYT puts and various other short positions should do quite nicely. Are you smiling as well Chris?
WSJ reports that investors withdrew more money this year ftom the stock market than they invested. One could legitimately ask how then could the market have continued to relentlessly notch new all time highs. I sometimes get derided for my only partly tongue in cheek refetence to banksters but their participation, directly or indirectly must be factored in in my view to correctly undetstand price action. Harry Dent was right about baby boomers retiring and withdrawing money from the market. He woefully underestimated CB intervention and was therefore wrong on his market calls. Whether it is via the direct purchase of equities as has been the case with the SNB and BOJ, or indirectly through the financing of corporate stock buybacks, the rally has been largely bankster driven, pure and simple. Sovereign wealth funds have also contributed and people would be quite naive to think that the FED has not directly provided, unofficially of course, liquidity to US markets. This is unsustainable. How do I know this? If you take a close look at DJi for example and the tear that it has been on lately, you will discover that its advance has been focused in fewer and fewer specific stocks. Yesterday’s pop was primarily due to the ridiculous ramp in IBM. These are in my view acts of desperation, and a futile attempt to maintain the appearance of a healthy market. I believe this move up is terminal.
Verne, do you have a link to this story and the data? Last time I look at this it was the opposite.
Drudge has a link to the WSJ article. I get a money flow analysis from one of my subscriptions and can shoot you the PDF file if you like.
Looks like the correction is here – 2548 just hit in futures
Good luck everyone
They are going to try and buy it back into the green and may well succeed. Remember it is now the thesis of the bakssters that every decline must be arrested and not permitted to gather downside momentum and this I think explains the grotesque price distortion we have been seeing. Frankly I am hoping they succeed and the market becomes even more grossly extended as it would bolster my expectation that what comes next will be more than a mere correction. A measly ten point decline in futures is insignificant. If I am right about this, that scenario will be heralded by triple digit declines in the futures market. A move past 15 by VIX intraday would change my mind about a cash session collapse. I expect the cash dump to arrive just prior to the open if past practice holds true. I do think we are nonetheless getting closer to judgment day… 🙂
A few weeks ago we Joe and I were talking about the yield curve and what it portends for the broader economy. It continues to flatten and at 0.75 sports the lowest spread since the financial crisis. The yield curve has an unblemished record as a harbinger of recessions so it does appear that my long held opinion that the trouble will begin in the bond market may prove correct. Can the banksters negate yet another bearish harbinger if the curve inverts?!
I am 100% confident that the Yield curve will continue to flatten… I see no evidence that this will change anytime in the future.
The sign of a change will be the 30 Year US Treasury breaking above a 3.26% Yield and accelerating higher above that.
Don’t hold your breath as that level has been strongly repelled a couple of times already.
There is one thing that can cause price to blow past that level and which no one, not even banksters can ultimately suppress- FEAR!
Not too busy to be foist Doc!
Verne,
You got the pole position again 🙁
🙂