Bearish divergence continues today, which supports the expectation of a pullback.
Summary: Bearish divergence continues with the AD line and VIX, so for this reason the expectation of a pullback beginning here will remain.
While the trend remains up, look out for at least a short term pullback to begin tomorrow. Look for one to a few red daily candlesticks here. The first target is about 2,548 minimum. If price makes a new swing low below 2,541.60, then the target is at 2,531.
This pullback may be used as an opportunity to enter the upwards trend. Only the most experienced of traders should consider trading it short.
Always trade with stops and invest only 1-5% of equity on any one trade. If trading a correction against the larger trend, then reduce risk to 1-3% of equity.
Last monthly and weekly charts are here. Last historic analysis video is here.
MAIN ELLIOTT WAVE COUNT
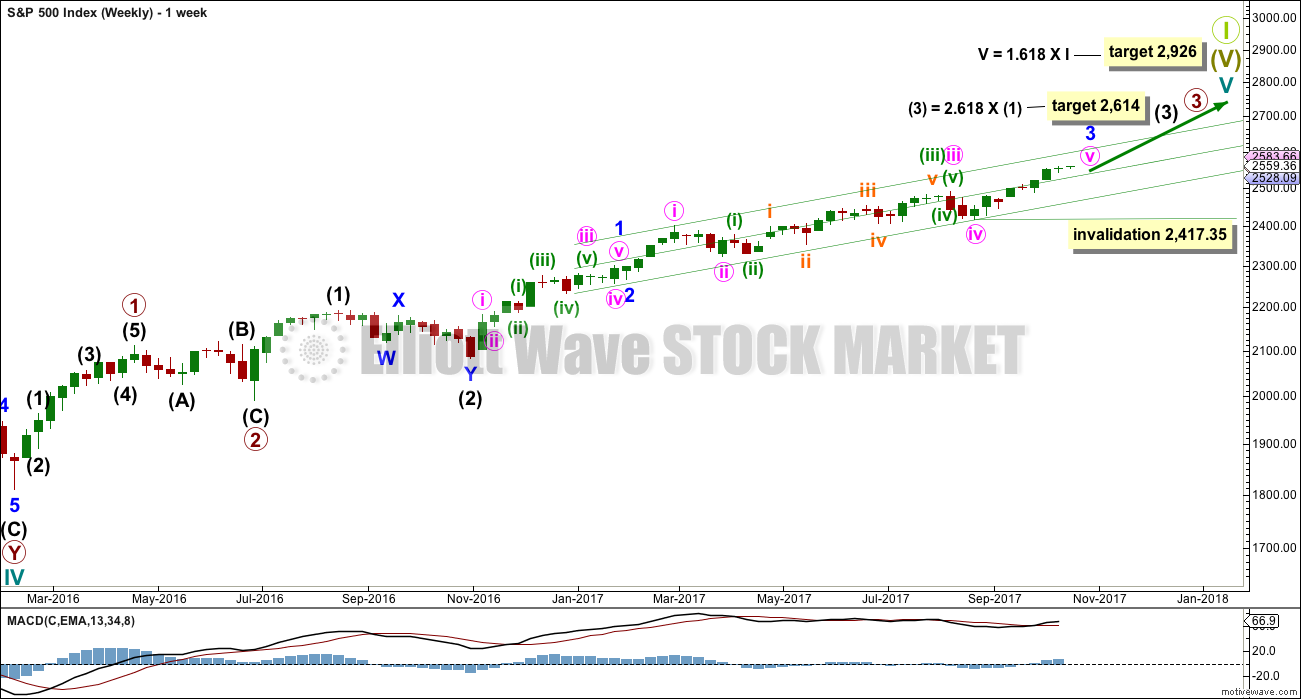
WEEKLY CHART
This wave count has strong support from another bullish signal from On Balance Volume at the weekly chart level. While classic analysis is still very bullish for the short term, there will be corrections along the way up. Indicators are extreme and there is considerable risk to the downside still.
As a Grand Super Cycle wave comes to an end, weakness may develop and persist for very long periods of time (up to three years is warned as possible by Lowry’s for the end of a bull market), so weakness in volume may be viewed in that larger context.
Within minute wave v, no second wave correction may move beyond the start of its first wave below 2,417.35.
The next reasonable correction should be for intermediate wave (4). When it arrives, it should last over two months in duration, and it may find support about the lower edge of this best fit channel. The correction may be relatively shallow, a choppy overlapping consolidation, at the weekly chart level.
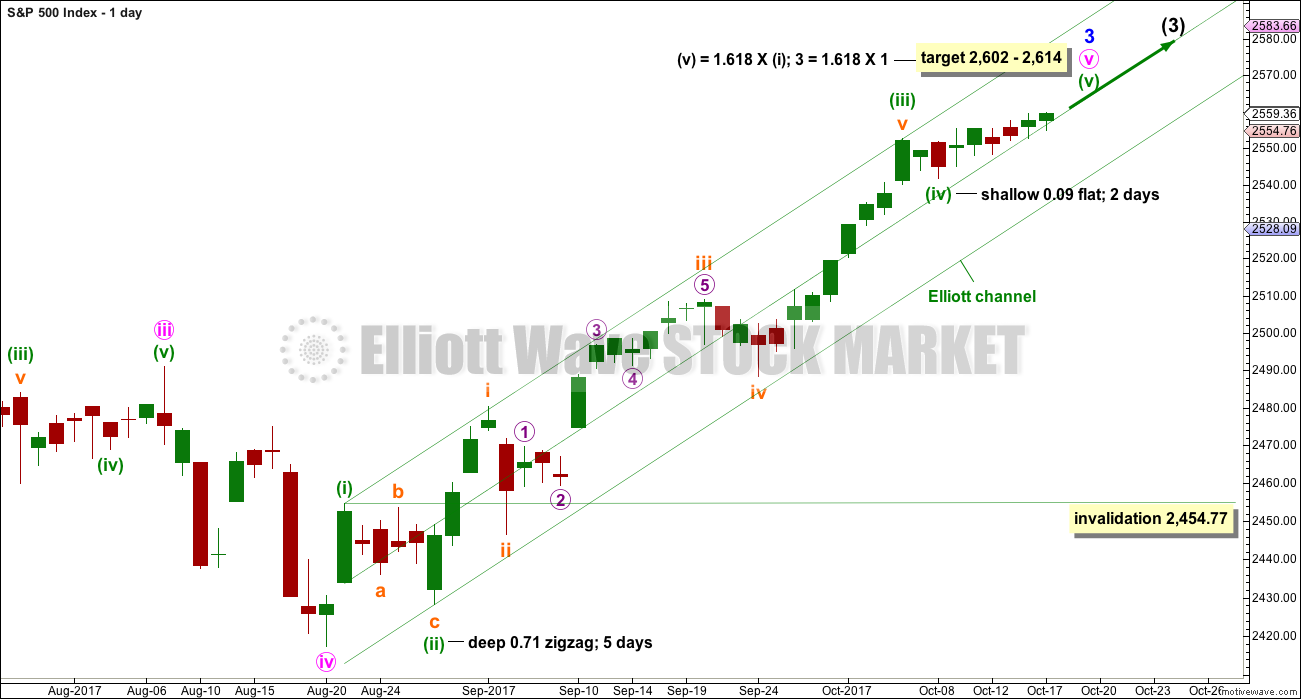
DAILY CHART
To see details of the whole of primary wave 3 so far see the analysis here.
Minute wave v to complete minor wave 3 must subdivide as a five wave structure. It looks like an incomplete impulse. It looks like minuette waves (i) through to (iv) may now be complete despite minuette wave (iv) lasting only two sessions. The problem of proportion may be accepted if bullishness in classic analysis correctly predicts more upwards movement.
If it continues any further then minuette wave (iv) may not move back down into minuette wave (i) price territory below 2,454.77. If it continues further, then minuette wave (iv) may end to total a Fibonacci eight sessions and have good proportion with minuette wave (ii).
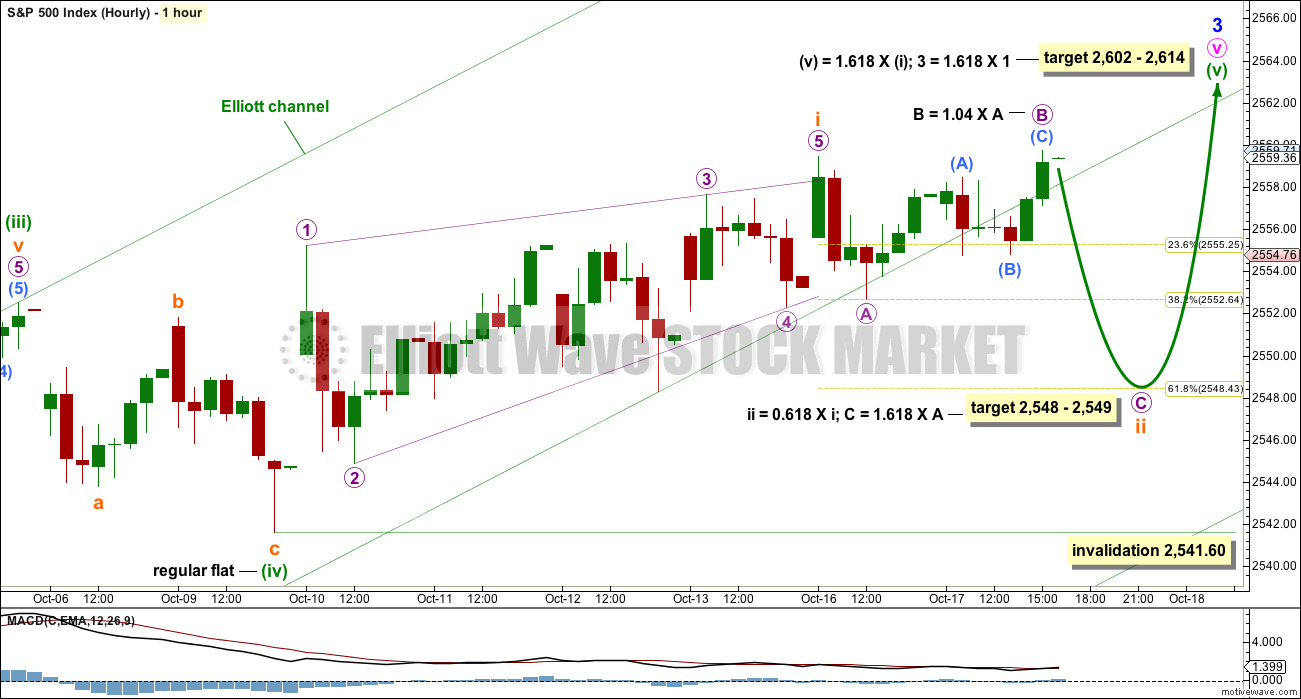
MAIN HOURLY CHART
It is possible that minuette wave (iv) may have been a flat correction. The downwards wave labelled subminuette wave a will subdivide as either a three or a five on the five minute chart. This wave count looks at it as a three which would give alternation for minuette wave (iv) as a flat correction to the zigzag of minuette wave (ii).
The target may now be calculated at two wave degrees, so it is widened to a rather large zone. When subminuette waves i through to iv are complete, then it can be calculated at a third degree. At that stage the zone may be narrowed.
A leading contracting diagonal may have just ended at Monday’s high, and this may be subminuette wave i within minuette wave (v). The only problem with this leading diagonal is the overshoot of the lower 2-4 trend line; this does not look typical. The structure does meet all Elliott wave rules.
Second wave corrections following first wave leading diagonals are most commonly very deep. If the 0.618 Fibonacci ratio as a target is wrong, it may not be low enough for subminuette wave ii.
Subminuette wave ii may be unfolding as a very common expanded flat correction. Micro wave B is longer than 1.05 times the length of micro wave A, so this flat may be categorised as an expanded flat.
The target for micro wave C coincides nicely with the 0.618 Fibonacci ratio of subminuette wave i.
Subminuette wave ii may not move beyond the start of subminuette wave i below 2,541.60.
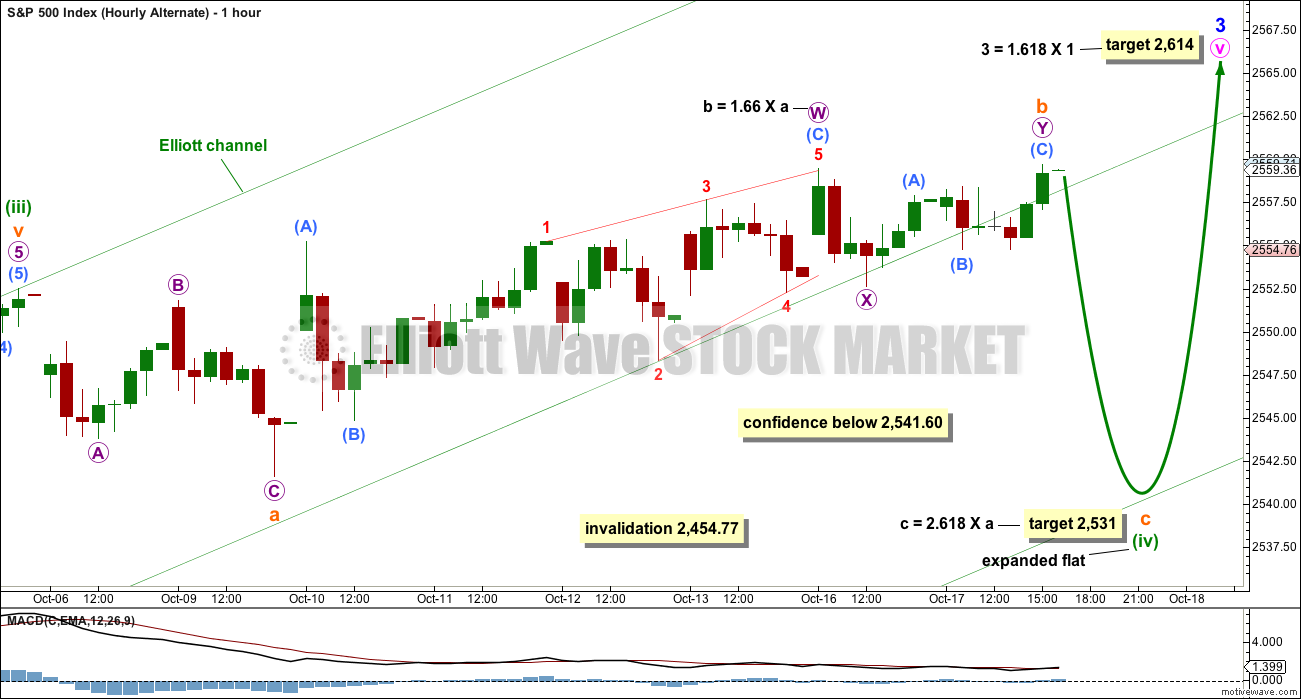
ALTERNATE HOURLY CHART
If minuette wave (iv) is not over, then it may continue for another five days to total a Fibonacci 13.
There are still multiple structural options for minuette wave (iv). Today, it is labelled as the most common option, an expanded flat. But it may still morph into a combination or complete as a running triangle.
An expanded flat may see minuette wave (iv) come lower to test support at the lower edge of the green Elliott channel. The target calculated may still be a little too low if this channel offers strong support.
The structure within subminuette wave b upwards is different to the main hourly wave count. Seeing this upwards wave as a zigzag has a better fit than trying to see it as a five for the main hourly wave count.
This alternate wave count would see minuette wave (iv) still exhibit good proportion with minuette wave (ii), and they would have perfect alternation. At the daily chart level, this wave count would give the structure of minute wave v a better look.
TECHNICAL ANALYSIS
WEEKLY CHART
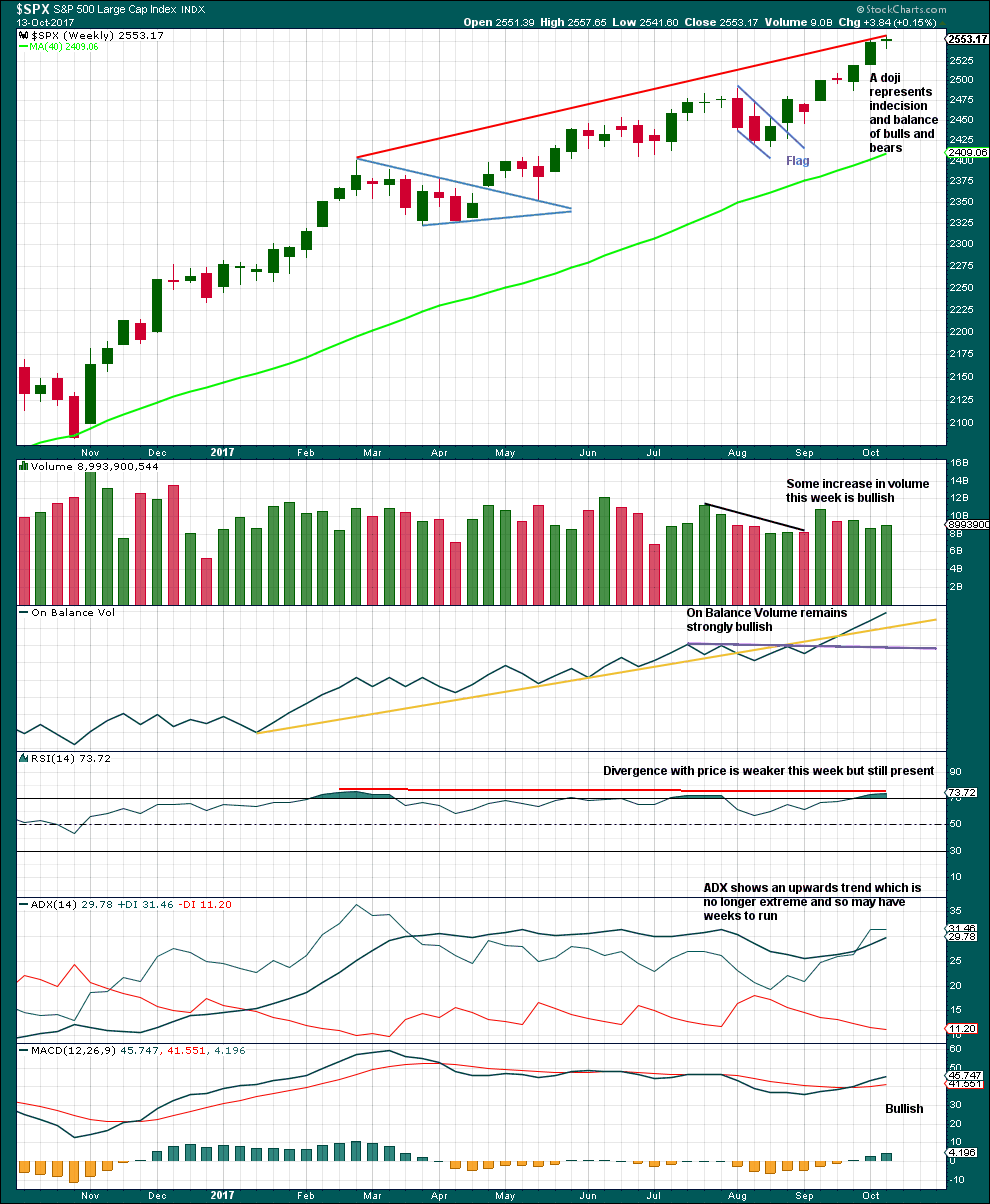
Click chart to enlarge. Chart courtesy of StockCharts.com.
Again, this week this chart remains very bullish. A doji on its own is not a reversal signal, and doji may appear as small pauses within upwards trends.
RSI is overbought and exhibits longer term divergence with price, but not short term. If short term divergence develops, then a pullback would be more likely. RSI may move higher to further overbought and may remain there for a reasonable period of time during a strong bull trend in the S&P500. On its own, it does not mean a pullback must happen here and now; it is just a warning at this stage for traders to be cautious and manage risk. Overbought conditions mean the risk of a pullback is increasing.
DAILY CHART
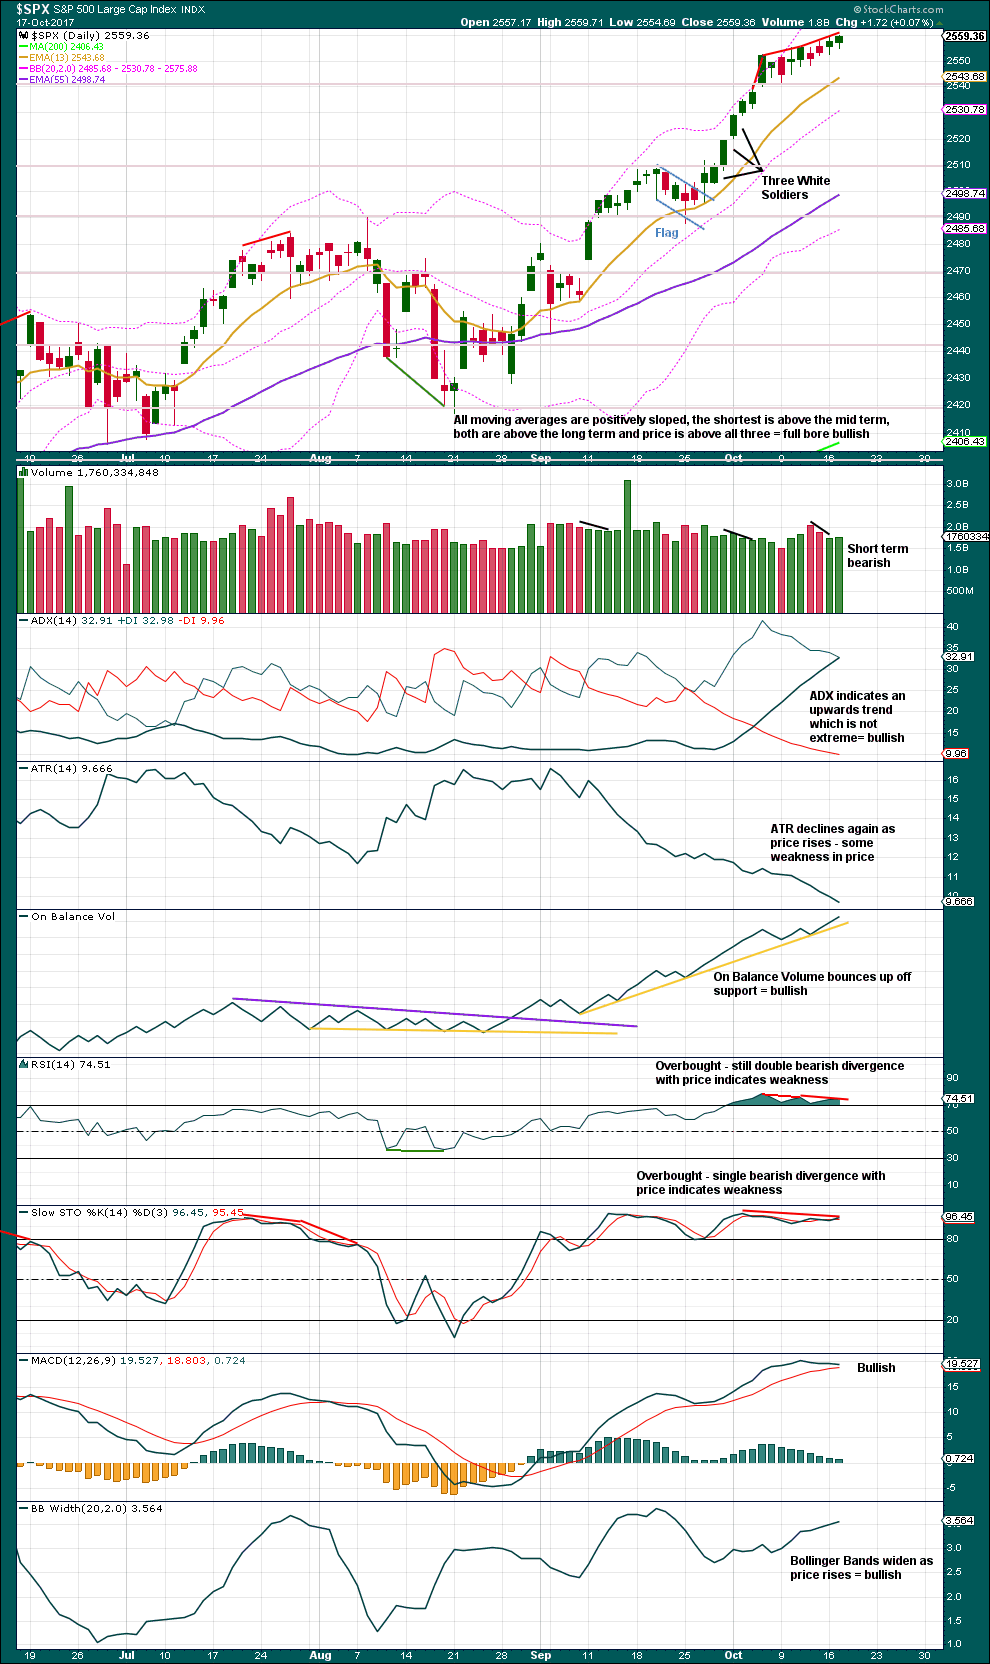
Click chart to enlarge. Chart courtesy of StockCharts.com.
Bullish: The last two longer wicks on the daily candlesticks, On Balance Volume, a slight rise in volume today, ADX, MACD and widening Bollinger Bands.
Bearish: Now only single divergence with price and Stochastics, and still double divergence with price and RSI while it is overbought. Overall, still some decline in volume as price rises.
On balance this chart may be judged to be more bullish than bearish, but overbought conditions are a warning that a pullback or consolidation may come soon.
VOLATILITY – INVERTED VIX CHART
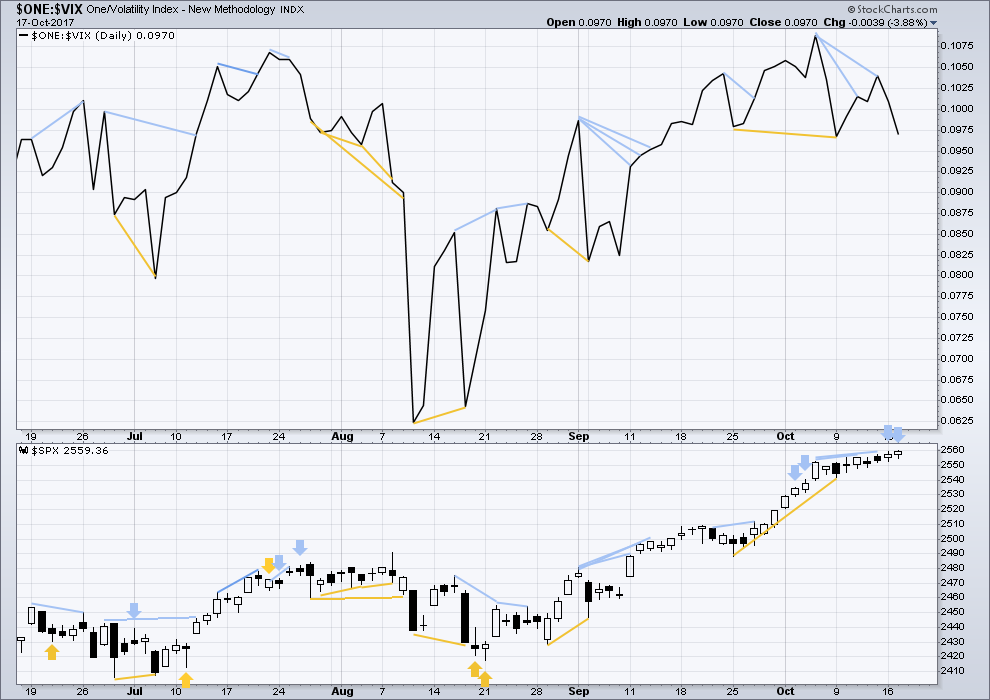
Click chart to enlarge. Chart courtesy of StockCharts.com.
Normally, volatility should decline as price moves higher and increase as price moves lower. This means that normally inverted VIX should move in the same direction as price.
Price again moved higher today with a higher high and a higher low and a green daily candlestick. However, volatility did not show a normal decline and increased as inverted VIX moved lower. This divergence indicates weakness today within price and is bearish. It is slightly unusual for VIX to exhibit this divergence two days in a row, so it will be given some weight in this analysis today.
BREADTH – AD LINE
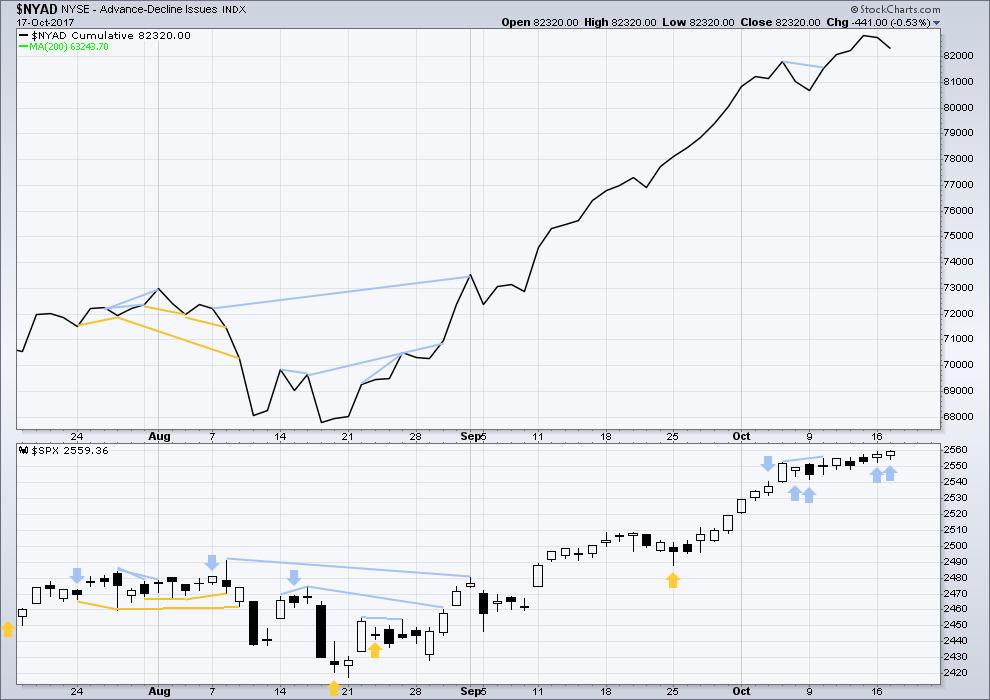
Click chart to enlarge. Chart courtesy of StockCharts.com.
With the last all time high for price, the AD line also made a new all time high. Up to the last high for price there was support from rising market breadth.
There is normally 4-6 months divergence between price and market breadth prior to a full fledged bear market. This has been so for all major bear markets within the last 90 odd years. With no divergence yet at this point, any decline in price should be expected to be a pullback within an ongoing bull market and not necessarily the start of a bear market.
While price has made another new all time high, it still does not have support from market breadth. The AD line can be a leading indicator. The decline today in market breadth is bearish and supports the hourly Elliott wave counts which expect a pullback or consolidation to begin here. It is very unusual for the AD line to exhibit strong divergence with price for two days in a row, so this indicator will be given reasonable weight today in the analysis.
Small, mid and large caps have all made new all time highs. The rise in price is supported in all sectors of the market.
Go with the trend. Manage risk.
DOW THEORY
All the indices are making new all time highs. The continuation of the bull market is confirmed.
The following lows need to be exceeded for Dow Theory to confirm the end of the bull market and a change to a bear market:
DJIA: 17,883.56.
DJT: 7,029.41.
S&P500: 2,083.79.
Nasdaq: 5,034.41.
Charts showing each prior major swing low used for Dow Theory are here.
Published @ 07:50 p.m. EST.

I have been keeping a personal log of bearish or reversal signals that have been negated in this market over the last year or so (including some of my own “proprietary” ones!) and it truly is mind blowing. As far fetched as it sounds, it would almost appear that the market buying has been exactly timed to do exactly that. It is truly the most incredible thing when you look at how many times this has happened, not to mention the persistently low volume!
ARRIVEDERCI Baby!
For goodness sake. Price rising on declining breadth? Really? I’ve not seen this one before with this persistence.
There will be a pullback… but for now with price just rising we have to go with it.
I am sorry for it folks. The technicals are looking bearish… but they seem to be either divorced from price or there will be a strong fall very soon…. but it’s just not happening yet 🙁
A more bullish wave count now requires more upwards movement to complete the structure of minuette wave (v). With three small fourth wave corrections along the way up, they may continue to find support about the mid line of the channel. Which should present opportunities to join the upwards trend. Stops just below the invalidation point should see long positions closed quickly if I”m wrong and if a deeper pullback now for minor wave 4 arrives.
Don’t feel badly Lara. This market is doing things I would venture to state that most of us has never ever seen before. I suspect I will end up being a perfect contrarian indicator as a result of those SVXY puts I sold just prior to the close! lol!
But seriously, the repeated negation of the bearish signals is nothing short of astonishing. Yikes!
Hedging short SVXY trade with sale of Nov 3 106 puts for 4.20.
Looks like we are going higher short term…
Reducing exposure by selling 10.00 strike calls bought for 0.55 for 0.65; maintaining short 10.00 strike puts….will buy to close at 0.15 or better…
Taking a different approach on VIX trade.
Selling to open 100 VIX 10.00 strike puts one week out….filled at 0.25
Absolutely no movement of bid on VIX call options as market powers higher. Very, very strange. Particularly since I am looking at near-by expiration….
Talking about downside risks in a market displaying this kind of manic ascent does indeed appear silly. I am starting to become very interested in finding out if the persistence of market divergences is in any way accretive… 🙂
One of the toughest decisions Republicans face is passing the Tax Reform Plan before November 13, 2017 (thats only a month away folks). I would start thinking about what would happen if they choose to extend it to next year; some shrinking in the market like Mr. Mnuchin suggests. The word is spreading rapidly now across media news so the likelihood of the market correcting is an unavoidable risk. Priorities of the government is to establish systems for the public like healthcare, protection, education, taxes, job creation and other efficient sources. But can America keep up with how fast things are expected to change. There are concerns out there, from now on next to my bed is a cup of coffee and just like a crime scene I declare myself a detective in this case.
Re this: “Priorities of the government is to establish systems for the public like healthcare, protection, education, taxes, job creation and other efficient sources.”
That’s a very progressive statement. I like it. However, I do not find that any of these represent the priorities of the government in power in the USofA. I find that their only objective is the maximization of profit by the top 1% of citizens, and the maximization of profit of the largest corporations. It’s a non-democratic oligarchy, pure and simple, focused on it’s own self interest, to the exclusion of all else. I agree with you wholeheartedly, that if the massive tax larceny program they intend to pass fails, the market will tank. Windfall “profits” (money that should be flowing to the American people through the governmental tax->spend process) are already very significantly priced in, and more so every day.
Not placing to much emphasis on the Democrats I think if the Republicans don’t pass the Tax Reform Plan they will start playing the blame game. Who would want to go to the crash site other than cops. Meaning who would want the market to crash and be responsible after this great year in the market. So although Republicans had months leading up to the campaign and months into the presidency they only have a month left.
Interesting. No fill on VIX calls. Spread at 0.65/0.70. Not chasing. Keeping bid at 0.60 and hoping for another spike down.
DJIA
ARRIVEDERCI !
Same for S&P
It is not going to happen during the regular session. Mr. Market is going get as many bulls on board as poassible before he makes the turn. I have long contended we will first see the turn in futures, where they will fail in attempts to buy it out of the red. Until then, assume the upward grind will continue….
We must look at charts differently. All I see here is it popping upwards. Just no reason for a sell off.
“Reasons? Reasons??? We don’t need no stinkin’ Reasons!!!”.
Reasons are fun for entertainment. Lots of entertaining Reasons (for actual action, and even more for “I’m right” actions soon to come!) are thrown out here. Greatly entertaining. But they are immaterial, and reasons are in fact wholly unknowable. “More buying pressure than selling pressure”, and vice versa, are the only pragmatic reasons of consequence.
Has anyone here ever read the forums on investing.com? Take oil, for example. Bulls and bears arguing and insulting each other every moment of every day. But price moves up and down at will, eventually forming discernable Elliott Wave patterns. The forums mean absolutely nothing.
So true. It is really amusing to see how folk get worked up about price action while markets do exactly as they will.
I’m not buying any ABC pattern here in SPX at this point. This looks like a 1-2 type push up to me, in progress. I wonder how the hourly gets adjusted to map this. A leading diagonal without a 2 just won’t do! Bottom line: bearish hopes of even a little 2 pullback are getting squished here. The trend is UP in every timeframe folks. What the market “should” do is 100% immaterial. All that matters is what the market IS doing, and it is once again breaking to the upside. Just as a broken clock is correct twice every day…the bears will be correct too. Once the market starts going down. Doesn’t appear to be today.
Maybe so, Kevin. I’m curious to see how Lara factors in today’s price movement.
Silly me… on the sidelines at the moment, looking for a little deeper pullback to re-join the trend, and it just keeps levitating upward.
Raising limit to 0.60…ask 0.75…
Trying to add to VIX 10.00 strike calls at limit of 0.55 but no bites so far….
A clear impulse down in Nasdaq off this morning’s. It sure seems that does not mean squat these days. Through the looking glass…
Filled on cconingent order for next week VIX 10.00 strike calls for 0.55
Funny, my chart did not show it went below ten…
Looking like ten formerly resistance now support…
Next pop higher could be perfect short entry for three wave IYT upward correction…
It will be very interesting if Nasdaq joins DJT in printing a bearish engulfing candle. Previous attempts have been forecefully bought back into the green so we could once again see a positive close.
Today just feels like your typical 11am est low of day…. then it moves up from here.
Pretty much exactly how it played out. (took 15% on some calls expiring today)
Glancing across IYT I see many bearish engulfing candles, followed soon thereafter by higher prices. Someone the other day here said “indicators are often wrong” or something like that. This one might be too.
Furious attempts to negate downturns with cash dumps. This has been going on non-stop several days now. It really is amazing to watch them hanging on for dear life.
Here’s how my charts show IYT. Strong uptrend on the weekly (upper left). Nice pullback and now turn back up on the daily and still overall in an uptrend (upper right). Breakout bar on the hourly (yellow bar), and close to moving from neutral to uptrend (gray bars, will go green on any further rise, bottom right). The bottom left is the 5 minute showing the recent sharp spike. This is a strongly bullish set up, and a pretty decent point for entry. Based on the action on the charts and the action (alone). That said, a buy could go wrong: manage risk!
Bearish engulfing candle last Friday and downside follow through on Monday favors more downside imo…
Loads of red, but wouldn’t be surprised to see a hanging man. I’ve gotta say the utter and rampant bullishness of nearly all clients/prospects and market participants is slowly making me crazy. Hard to do what’s right and prudent when promises and fomo has jaded people into behavior that lacks all logic and reason.
Are you allowed to say which fund you run?
Not sure, but I’ll ask compliance. Likely it’s a no, as far as a public posting is concerned. And as a disclaimer, all individual trades I mention here, that I am entering and exiting are for personal accounts, not the fund; which I occasionally mention fund algo positioning in aggregate.
Cheers. I can understand the disclaimer, while I don’t work in investments, my family does. A.I. intrigues me to no end.
Yep. Since you are registered you have to be very careful my friend. 🙂
Yup, no dice. Any communications related to it would have to occur offline. Yes AI is amazing, but requires human oversight as well. My two cents….
Despite yesterday’s doji, SVXY notched another 52 week high. It did the same thing a few weeks ago when the doji was just a pause in the upward trek. If we close green today I will be hedging my short trade by selling 106 strike puts.
The banksters are all in…how high can we go?! 🙂
Not looking like another sub ten VIX entry opportunity in the cards…come on guys, just one more! 🙂
IYT in midweek upward correction. This can sometimes be a great opportunity for trading near-dated put options.. Market makers know this so what they do to discourage traders is offer ridiculous spreads. You can generally get filled at much better than the ask. An even better approach is selling call credit spreads.
VIX up, futures up, so who’s fibbing? 🙂
This is rare…
VIX down 1% now… Gold dropping too.
Key is how price closes. That will tell us something about conviction…the gap down open is suspicious and could be filled by the close.
Final Blow OFF spike above 23000 this morning and then… ARRIVEDERCI !
There in futures now at 7:15AM Eastern Time
Your plan was ruined 30 mins later. Judging by my 4hour indicators…. All this sideways, creep up action for the past week has done is cool off the moving averages and now looks to go back to poppin’
Hiya Doc!