
More upwards movement was expected from the main hourly Elliott wave count and from the summary in last analysis.
Summary: The correction may be over; while price remains above 2,548.31 now, this should be the expectation. The next target is at 2,602 to 2,614. However, there is less bullishness and more weakness today, so a little less support for this view.
While the trend is clearly up, overbought conditions illustrate risk here to long positions.
A new low below 2,548.31 would indicate the pullback is not over and a target for it to end would now be at 2,527 to 2,523. If this happens, then use it as an opportunity to add to long positions. The trend remains up.
Always trade with stops and invest only 1-5% of equity on any one trade.
Last monthly and weekly charts are here. Last historic analysis video is here.
MAIN ELLIOTT WAVE COUNT
WEEKLY CHART
Click chart to enlarge.
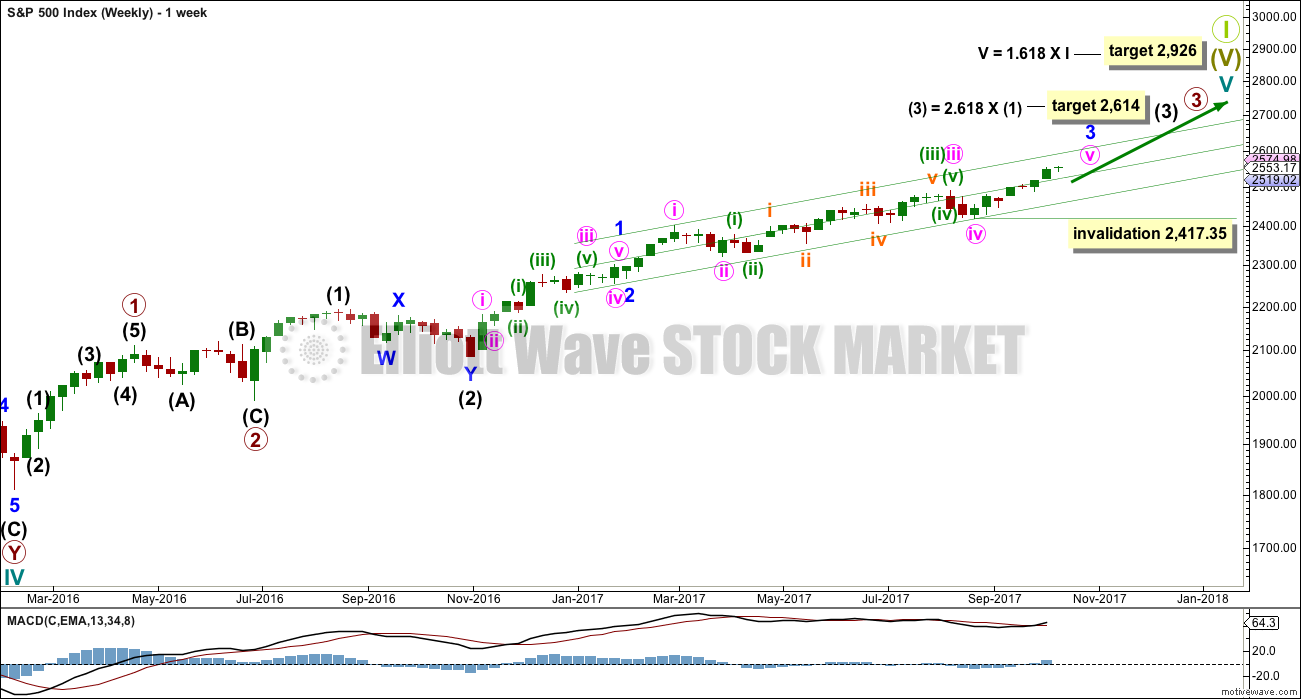
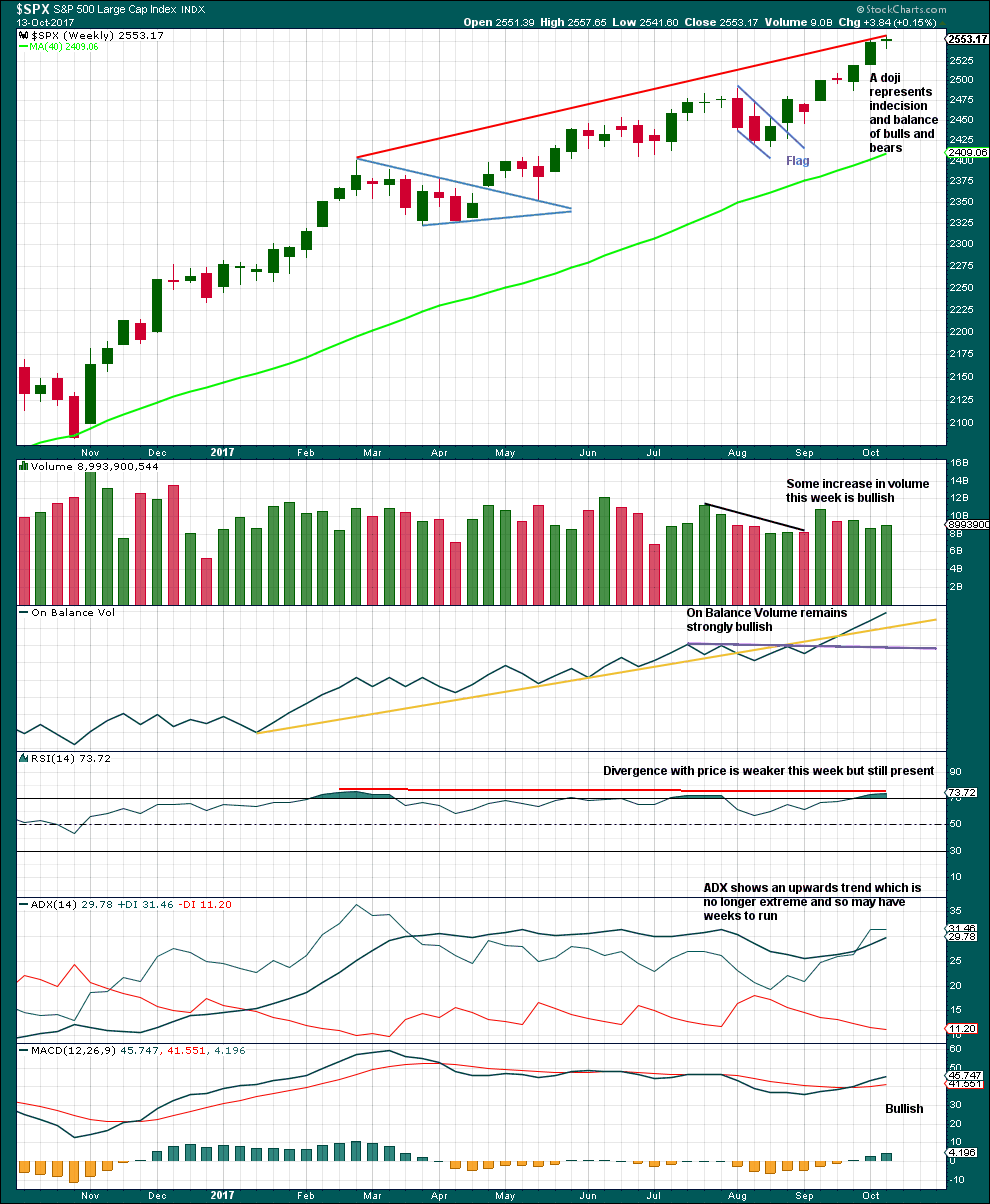
This wave count has strong support from another bullish signal from On Balance Volume at the weekly chart level. While classic analysis is still very bullish for the short term, there will be corrections along the way up. Indicators are extreme and there is considerable risk to the downside still.
As a Grand Super Cycle wave comes to an end, weakness may develop and persist for very long periods of time (up to three years is warned as possible by Lowry’s for the end of a bull market), so weakness in volume may be viewed in that larger context.
Within minute wave v, no second wave correction may move beyond the start of its first wave below 2,417.35.
The next reasonable correction should be for intermediate wave (4). When it arrives, it should last over two months in duration, and it may find support about the lower edge of this best fit channel. The correction may be relatively shallow, a choppy overlapping consolidation, at the weekly chart level.
DAILY CHART
Click chart to enlarge.
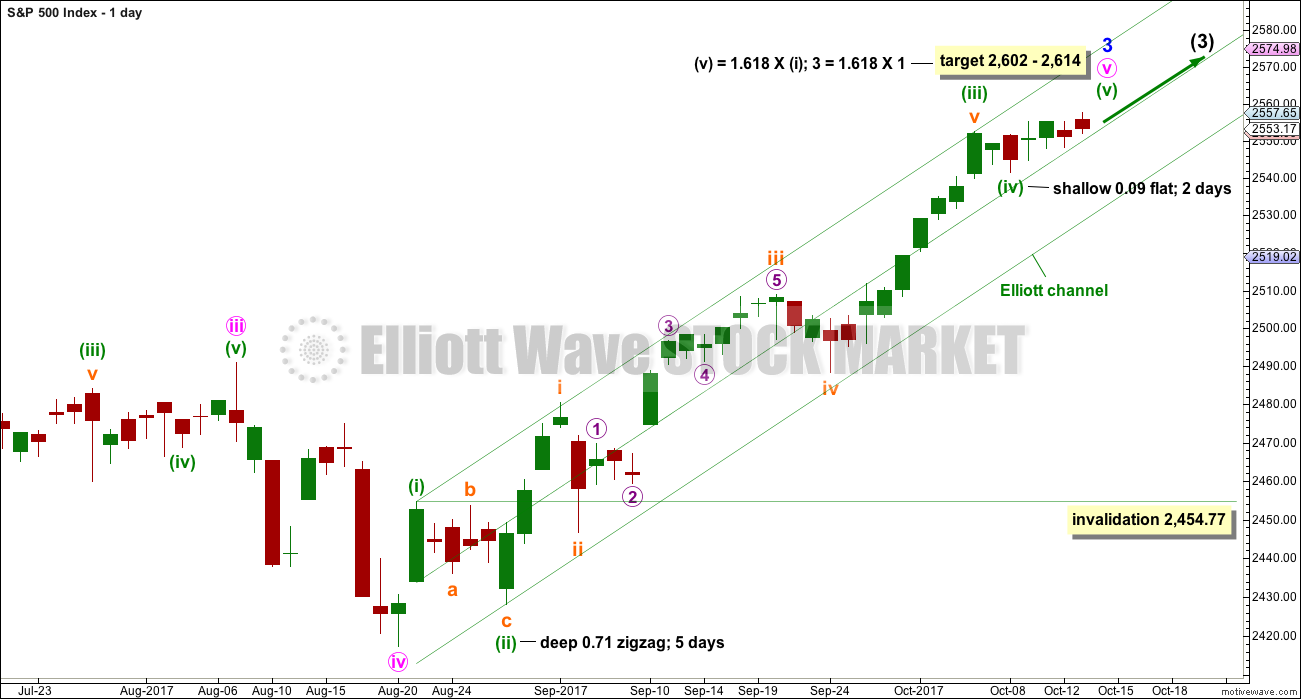
To see details of the whole of primary wave 3 so far see the analysis here.
Minute wave v to complete minor wave 3 must subdivide as a five wave structure. It looks like an incomplete impulse. It looks like minuette waves (i) through to (iv) may now be complete despite minuette wave (iv) lasting only two sessions. The problem of proportion may be accepted if bullishness in classic analysis correctly predicts more upwards movement.
If it continues any further then minuette wave (iv) may not move back down into minuette wave (i) price territory below 2,454.77. If it continues further, then minuette wave (iv) may end to total a Fibonacci eight sessions and have good proportion with minuette wave (ii).
MAIN HOURLY CHART
Click chart to enlarge.
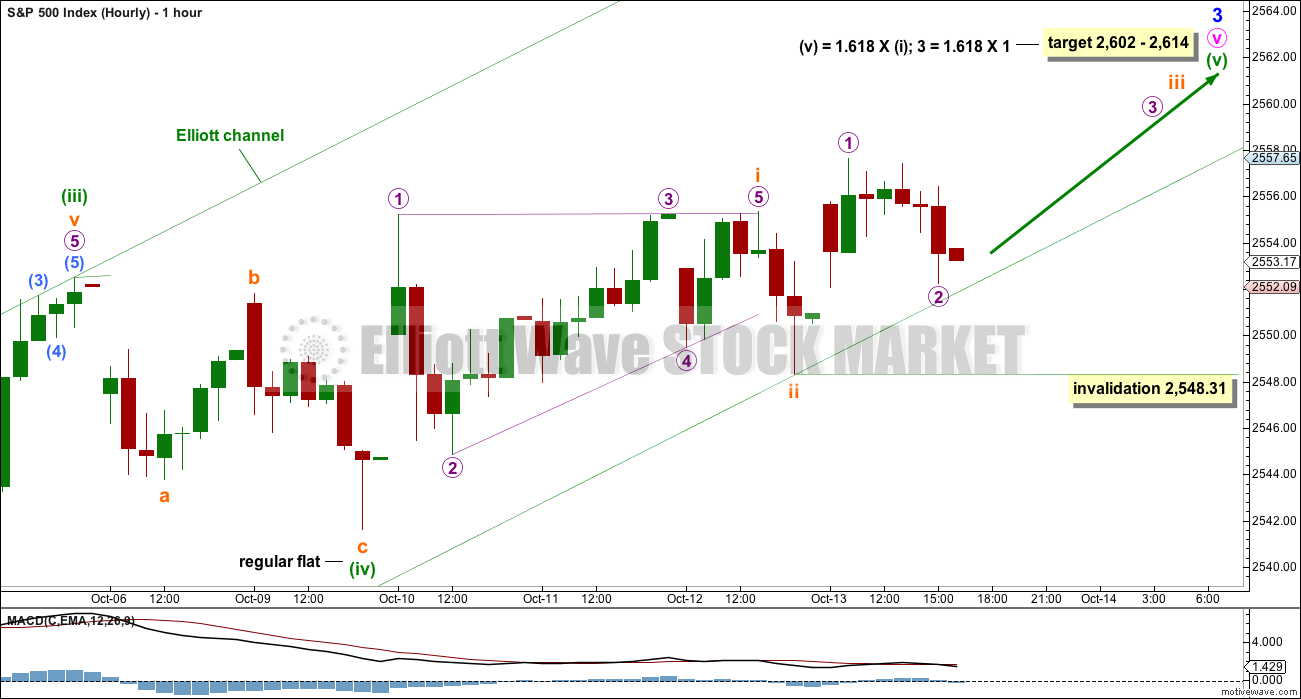
It is possible that minuette wave (iv) may have been a flat correction. The downwards wave labelled subminuette wave a will subdivide as either a three or a five on the five minute chart. This wave count looks at it as a three which would give alternation for minuette wave (iv) as a flat correction to the zigzag of minuette wave (ii).
The target may now be calculated at two wave degrees, so it is widened to a rather large zone. When subminuette waves i through to iv are complete, then it can be calculated at a third degree. At that stage the zone may be narrowed.
Minuette wave (v) may have begun with a leading contracting diagonal for subminuette wave i and a relatively deep 0.51 zigzag for subminuette wave ii, which is finding support about the mid line of the green Elliott channel.
If subminuette wave iii is underway, then micro wave 1 may be complete and micro wave 2 may have either completed or continue lower on Monday. It may not move beyond the start of micro wave 1 below 2,548.31.
Prior to any invalidation, it is safest to assume the trend remains the same, upwards.
ALTERNATE HOURLY CHART
Click chart to enlarge.
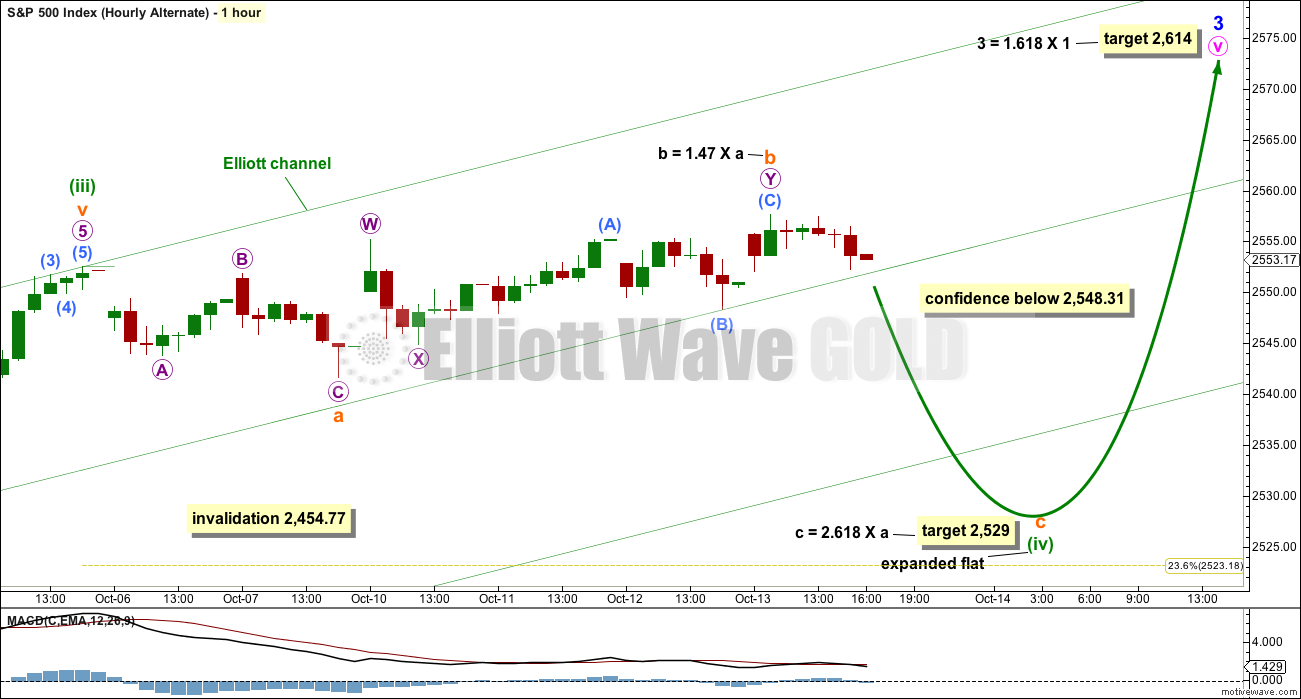
If minuette wave (iv) is not over, then it may continue for another two days to total a Fibonacci eight.
There are still multiple structural options for minuette wave (iv). Today, it is labelled as the most common option, an expanded flat. But it may still morph into a combination or complete as a running triangle.
An expanded flat may see minuette wave (iv) come lower to test support at the lower edge of the green Elliott channel. The target calculated may be a little too low if this channel offers strong support.
This alternate wave count would see minuette wave (iv) still exhibit good proportion with minuette wave (ii), and they would have perfect alternation. At the daily chart level, this wave count would give the structure of minute wave v a better look.
TECHNICAL ANALYSIS
WEEKLY CHART
Click chart to enlarge. Chart courtesy of StockCharts.com.
Again, this week this chart remains very bullish. A doji on its own is not a reversal signal, and doji may appear as small pauses within upwards trends.
RSI is overbought and exhibits longer term divergence with price, but not short term. If short term divergence develops, then a pullback would be more likely. RSI may move higher to further overbought and may remain there for a reasonable period of time during a strong bull trend in the S&P500. On its own, it does not mean a pullback must happen here and now; it is just a warning at this stage for traders to be cautious and manage risk. Overbought conditions mean the risk of a pullback is increasing.
DAILY CHART
Click chart to enlarge. Chart courtesy of StockCharts.com.
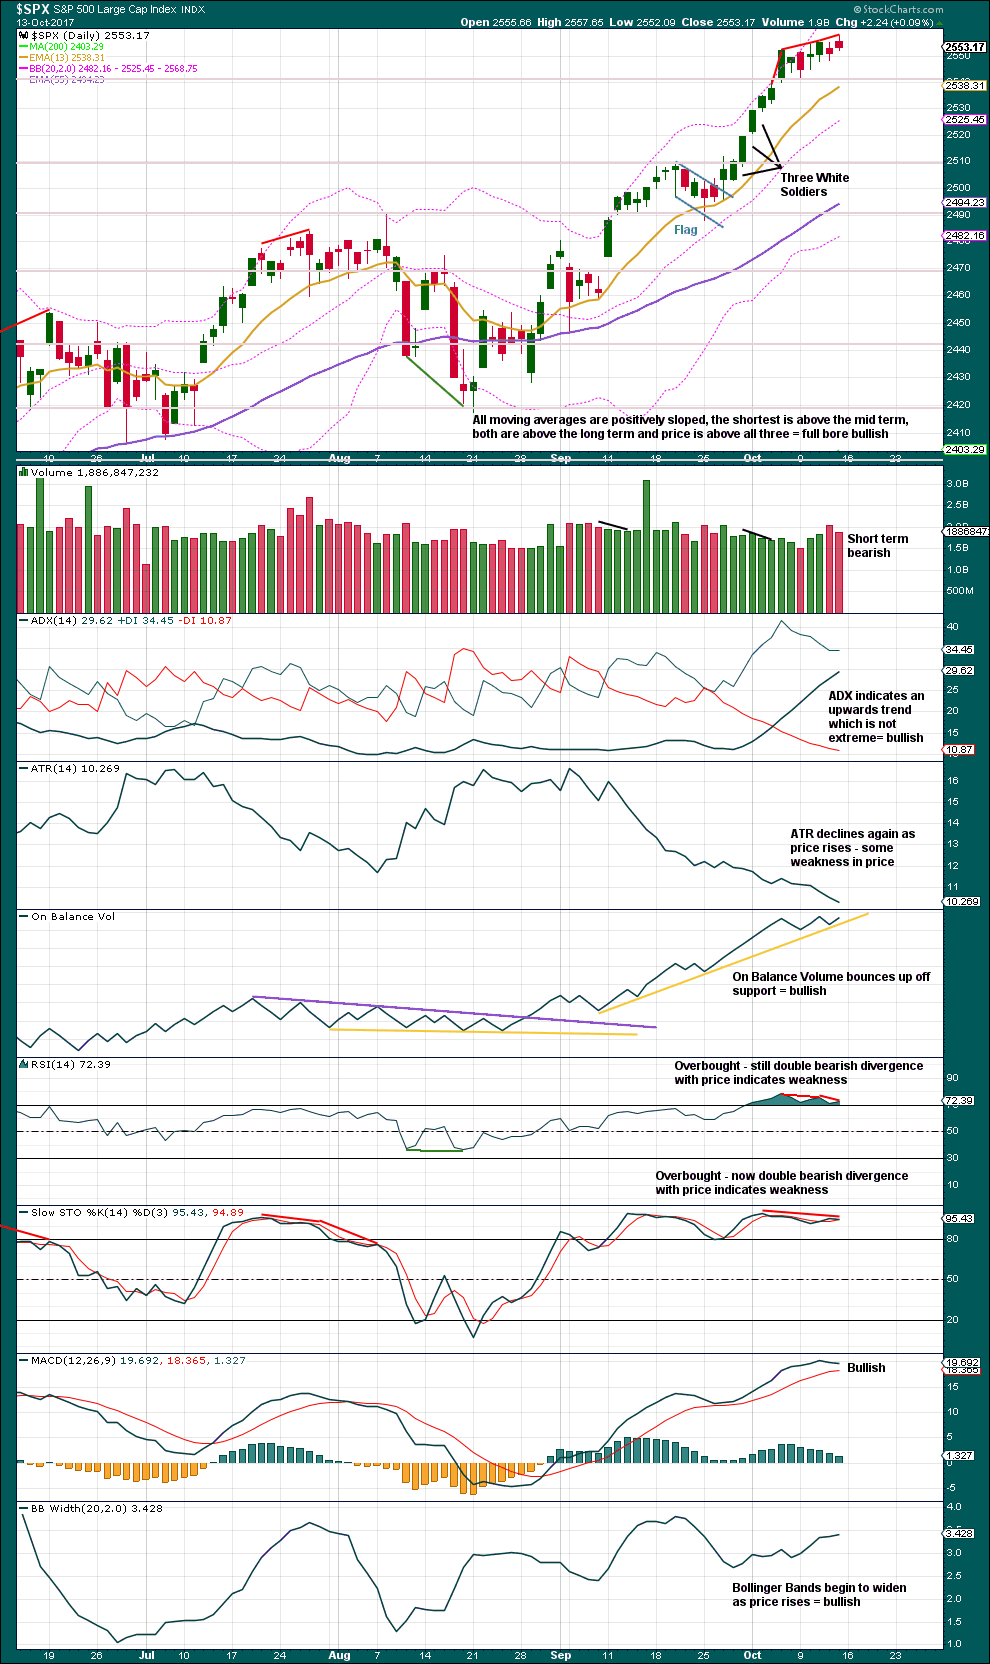
Thursday’s session moved price higher, but the balance of volume was downwards. Higher volume supported that downwards movement during Thursday’s session.
Now Friday’s session has also moved price higher with a balance of volume upwards. Lighter volume did not support upwards movement during Friday’s session.
The short term volume profile is thus bearish. This offers a little support to the alternate Elliott wave count.
ATR, RSI and Stochastics also offer support to the alternate Elliott wave count.
On Balance Volume, ADX, MACD and Bollinger Bands offer support to the main Elliott wave count.
VOLATILITY – INVERTED VIX CHART
Click chart to enlarge. Chart courtesy of StockCharts.com.
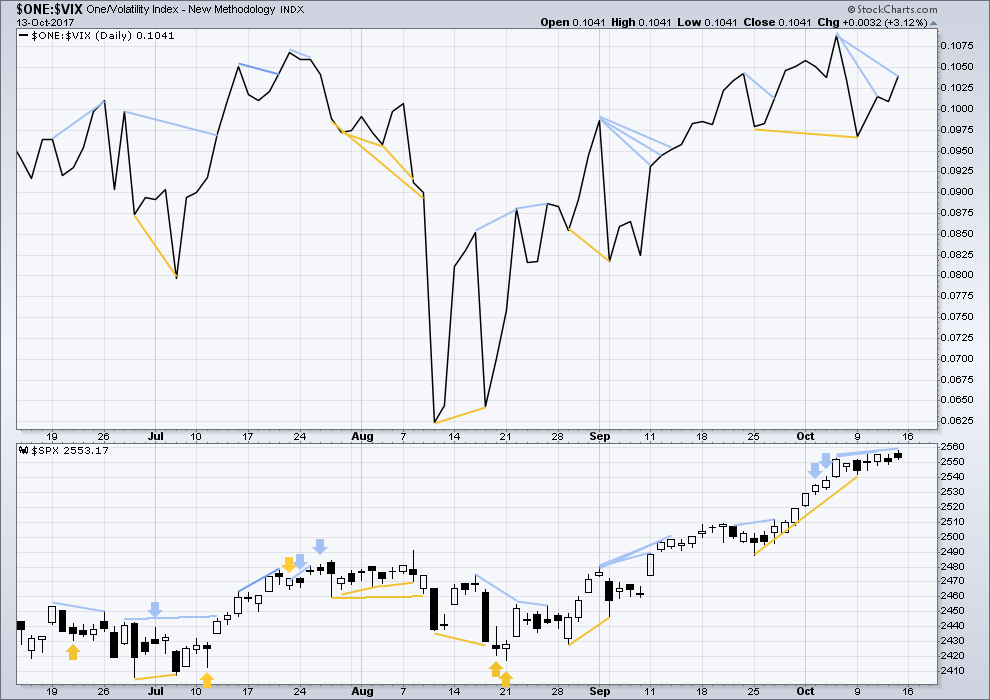
Normally, volatility should decline as price moves higher and increase as price moves lower. This means that normally inverted VIX should move in the same direction as price.
There is still bearish divergence for Friday between price and inverted VIX. The new all time high for price does not come with a normal corresponding decline in market volatility; the rise in price is weak.
BREADTH – AD LINE
Click chart to enlarge. Chart courtesy of StockCharts.com.
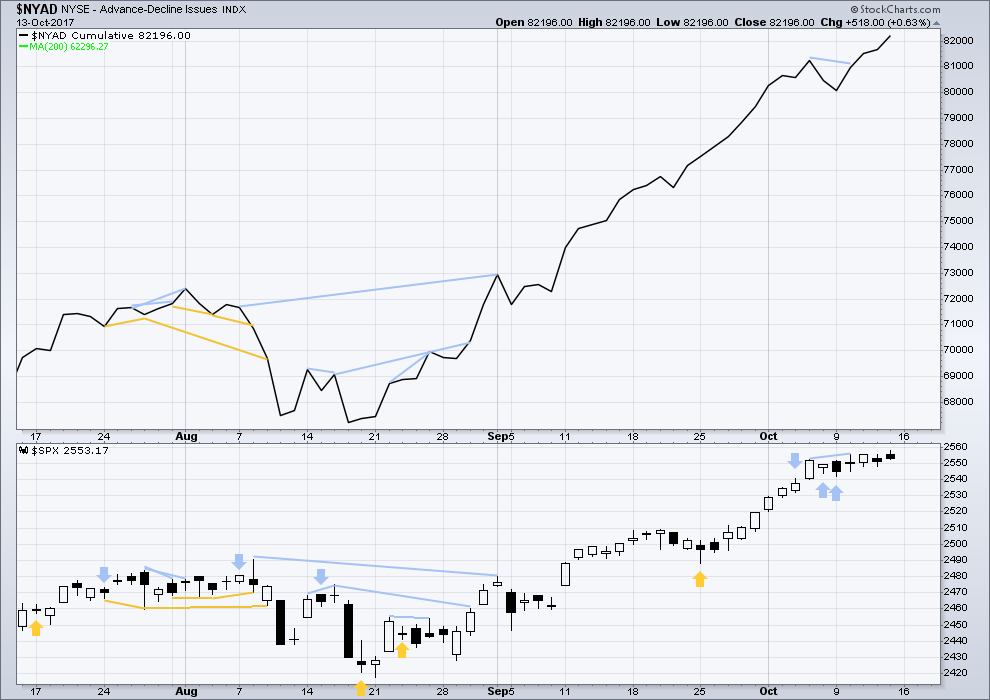
With the last all time high for price, the AD line also made a new all time high. Up to the last high for price there was support from rising market breadth.
There is normally 4-6 months divergence between price and market breadth prior to a full fledged bear market. This has been so for all major bear markets within the last 90 odd years. With no divergence yet at this point, any decline in price should be expected to be a pullback within an ongoing bull market and not necessarily the start of a bear market.
The AD line has again made a new all time high for Friday. As this should be read as a leading indicator, it supports the main hourly Elliott wave count. This is bullish.
Small, mid and large caps have all made new all time highs. The rise in price is supported in all sectors of the market.
Go with the trend. Manage risk.
DOW THEORY
All the indices are making new all time highs. The continuation of the bull market is confirmed.
The following lows need to be exceeded for Dow Theory to confirm the end of the bull market and a change to a bear market:
DJIA: 17,883.56.
DJT: 7,029.41.
S&P500: 2,083.79.
Nasdaq: 5,034.41.
Charts showing each prior major swing low used for Dow Theory are here.
Published @ 07:35 p.m. EST on 14th October, 2017.
Good morning everybody 🙂
It just keeps on going upwards, doesn’t it. Still finding support pretty close to the mid line of this channel which is proving rather useful. I hope you are all using that as an opportunity to enter long. Another opportunity nicely presented today.
If this wave count is right for the very short term then now there are three overlapping first and second waves. This predicts an increase in upwards momentum shortly as the middle of a third wave unfolds. It doesn’t have to be very strong though, because it’s within a fifth wave. So don’t expect any explosions.
Jiminy Cricket! Another green VIX print in the face of new all time highs everywhere! What on earth does this all mean?
Never ever seen anything like it! Yikes! 🙂
Taking profits on KSS puts on bullish engulfing candle to day. Will look to re-accumulate on any move above 45 and cost average in on move back towards upper B band. A very predictable beast as long as position given enough time to work out and that means puts at least 45 days out.
I find it quite curious the banksters did not buy the trannnies out of the key reversal day from Friday. Of course we always have tomorrow…lol!
Then again, who is to say they did not try??!! 🙂
They may well have tried. It’s fallen strongly now two days in a row.
It can sometimes be a leader, and so this suggests my target for the S&P may be too high…
Could be. I have not seen VIX persist in printing green candles in the middle of a third wave up. Of course we are also in uncharted territory…
The spike down this morning could have been some sort of a fourth wave. It looks like we have yet another rising bearish wedge; these thing are interminable aren’t they??!!
Hey Joe, where is everybody today? I guess they left just the both of us to mind the store! lol! 🙂
I’m here too now 🙂
Guten Morgen! 🙂
Apologies Verne, we had the rare day where all prospects want into the fund all at once, and that requires a ton PPMs, Sub-docs, etc. I’m buying DIJA leaps here. So cheap…..
I’ve got a wagon-load. I suspect they are not going to get any cheaper…Yikes! 🙂
Reloading IYT puts by way of November 175 strike contracts for 2.00 each….
STC order at 2.50 opened….
That intra-day spike down in VIX from 10.00 to 9.76 in one fell swoop is a great example of what market makers do to stops placed in the market.
I think I am going to open a few buy stops on VIX on any move below 9.75 lol! 🙂
That VIX red candle on the five minute chart suggests someone got a few fingers blown off trying to hold onto a stick of dynamite…
They have decided in the absence of the ability to force a new VIX 52 week low, to employ a whack-a-mole strategy on any move of VIX above 10.00. That is how insanely leveraged the VIX short trade has become. Look for an explosive move past 10.00 and a take out of 13 to signal they are done….
I am trying to do a bit of market research on the current volatility anomaly. The more I dig the stranger it gets. VIX made a new 52 week low back on July 26 when DJI was over a thousand points lower than where it is trading today. There is something very, very wrong with the picture we are seeing. I am not sure what it is exactly and am trying to crunch some historical numbers but so far it is just not adding up…
I have some ideas but I plan on keeping them to myself for now… 🙁
Over the years that I have been trading volatility, in almost every instance that I can recall, market price vol divergence has typically signaled some sort of short term imminent relief of overbought conditions. I have never seen this kind of divergence persist for the kind of duration we are now seeing. Since I have never seen it, obviously conclusions cannot be drawn about what it means. I suspect it is another example of the kinds of persistent extremes so characteristic of equities market nowadays.
IMO we should be seeing extremes for a fair while approaching a Grand Super Cycle market high. Once in generations that should be. So it should be something we have never seen in our lifetimes.
Probably something that’s not in the textbooks either.
I never thought about that, and I bet you are right! 🙂
Lara is absolutely on point…..for a top of that magnitude occur we really need all the ingredients that are now present.
Who has the total number of down days since November 8th 2016 to today handy?
It can’t be many.
If they don’t keep today’s gap open. there is an excellent chance we will also close the one from last Thursday….
Clearly trying to maintain open gap from this morning. If they can keep it open into the close we are probably going higher….if it closes could be an exhaustion gap….
The banksters have begun the desperate pump. Let’s see how they do….
An SPX move and CLOSE below 2550.93 could spell trouble…
That won’t happen though… because it never does in this run up from November 8th 2016 or for that matter From Feb 11th 2016 if you go back to where the FED last stepped in to Kill an EW Confirmation with liquidity.
You could be right and that really worries me. It is further evidence of how terrified they are of any kind of market correction. A move down in the market at this point is going to happen in the face of strenuous attempts by the banksters to prevent it so will be all the more significant….
I don’t think there has ever been a market in the history of markets that has been in quite this position….
With the balance sheet reduction started and their (whole board) replacements imminent … the Fed won’t step in this time.
However, it has to be tested and so you actually need a correction to occur to prove it out. What sets one off????
Israeli jets bombed an air defense battery in Syria earlier today which fired on them for violating Syrian air space. The Israelis supposedly gave the Russians a heads-up on the strike but that could be a game changer if they killed any Russian personnel training the Syrians at that site….
Wow… those “Models” referred to below are always accurate… continues to be accurate today. Wow… never wrong! LOL
Nothing new under the sun; certainly nothing new about human nature… 🙂
You have that right Verne… I have never seen anything like this in my lifetime.
I think they are trapped. This market is so leveraged they have to step in, as a serious decline is going to up-end the entire apple cart, and so so very quickly….
The idea that the most telegraphed action in Fed history will blow up the markets is just wishful thinking on the part of the bears. The inexorable climb upward will continue until some real, unpredictable damage occurs.
Buying to open 100 SVXY October 27 105 strike puts for 3.95 per contract….
Opening STC order for half at limit of 10.00 per contract….
Market makers may be starting to get a bit nervous. Filled at 2.50 on my STC order for IYT 179 puts on a 2.20/2.65 spread.
I should have rolled ’em instead. Looking for a reload……
The suppression of volatility as an instrument for jacking the price of equities to the moon is a one-way trade. I have long contended that the banksters CANNOT permit even a mild correction in this market because of what they had to do to ramp it this high. It sure is looking to me like they have exhausted the pairs trade of short vol ramp equities as we have seen the refusal of VIX to put in a new 52 week low despite a week or more of consistent new all time highs across a variety if indices. I have to admit this has come as quite a surprise to me. The short sellers of volatility have displayed unprecedented hubris the last year or so. I am not about to argue that they will have to unwind on the next decline, but they will have to do so eventually. I am still expecting one last desperate flame-out so we’ll see…..
Filled at 0.70….
Cancelling VIX December 10.00 strike put sale order.
Selling to open Dec 11.00 strike puts for limit price of 0.70…
Buying to open 25 IYT 179 puts expiring Friday for 2.00 per contract….
Open STC order at limit price of 2.50…
Partial fill on VIX short put sale of 100 shares; if not filled in the next hour lowering limit to 0.25…..
A few contrarian analysts are seeing quite a few ending diagonals in various indices.
The great thing about that call is it does not take long to find out if you are wrong. EDs are very particular animals when it comes to how they trade at their completion – the reversal is brutal and unistakable. If they are right, we should know by session’s end methinks…. 🙂
Bought to close 250 Jan 10.00 strike puts for 0.20.
Selling to open 250 Dec 10.00 strike puts for limit of 0.30, waiting to be filled….
The recent article by Zerohedge that all the bears have left the arena may not be all hyperbole. I lowered the cost basis of my considerably large long volatility position by selling a ton of VIX 10 strike Jan 18 puts. I took a quick look-see at how VIX puts are trading a few months out and could hardly believe what I was seeing- even the market makers are wildly bullish!
The ask on those 10 strike puts have moved down this morning to 20 from 0.35 a bit over a week ago.
Those same 10.00 strike puts expiring in two days have an ask of 0.35!
Even the Dec puts are more expensive at an ask of 0.30! Yikes!
Of course I will be buying back those Jan puts and selling the pricier near dated ones!
Why on earth not??!! 🙂
How Lucky are all of you??? Here is a History…
“So we got out our history books (i.e., we scrolled to the left on our chart of the Dow Jones Industrial Average) to check previous “7” years going back to 1900. As it turns out, 7 does indeed appear to be quite unlucky.
Consider the track record for the back half of “7? years:
2007: “Just” a 10% drawdown, but also a cyclical market top
1997: Asian Crisis…swift 17% drawdown
1987: “The Crash”…20% decline, with a 41% drawdown
1977: Cyclical bear market…9% decline, with a 15% drawdown
1967: Up 5% for half, but 12% drawdown, all in the 4th quarter
1957: Straight down from July…13% loss, with 20% drawdown
1947: Mostly unscathed…2% gain, with ”just” a 7% drawdown
1937: Major bear market…Down 29% with 41% drawdown
1927: Roaring bull…9% drawdown, but a gain of 21%
1917: Cyclical bear market…22% decline, with a 31% drawdown
1907: Cyclical bear market…24% decline, with a 35% drawdown ”
“As the 4th quarter gets under way (and just in time for Friday the 13th), we took a fresh look at performance in “7” years. What we discovered is that the lion’s share of the poor-performance during “7” year 2nd halves actually took place during the back half of those periods, i.e., the 4th quarter.
Specifically, of the -7.88% average historical return during the 2nd half of “7” years, a full 730 basis points, or -7.30%, of the loss took place in the 4th quarter alone. That ranks it as the worst average performance of any quarter of the decadal cycle.”
“Further, of the -21.69% average historical drawdown during the 2nd half of “7” years, 15.93%, or nearly 1600 basis points, took place in the 4th quarter alone. Not surprisingly, that equates to the worst average drawdown of any quarter of the decadal cycle.”
That portion of an interesting article above does match timing very well with…
We are now 10 Trading days into Balance Sheet decline/runoff and the outer estimate of when I believe the effects will begin to be felt.
The 30 Year Treasury bond offering went off Thursday and was at the highest oversubscribed level in years.
From Monday on the effects of a liquidity draw will start to be felt in the same place that benefited most when it was pumped in.
This is the schedule of amounts… with 100% Certainty!
Runoff By… $10 Billion/mo increasing $10 Billion/Qtr to Max per month of $50 Billion.
Enjoy the final day! It time for a shortened EW Count to occur.
A post of mine from Yesterday:
It’s as clear as day… the perfect timing of the “bankster manipulation”!
Just as the confirmation of an EW bear count was to be confirmed the QE rushed in to prevent that confirmation. The most recent was in July-Aug 2015 to Feb 2016. That was a clear “bankster manipulation” to prevent a confirmation of an EW Bear Count. It occurred again in 2012 with all out QE and one other time.
It was as if the “banksters” were using EW Theory to time the infusions.
Nobody is going to tell me it didn’t occur… because I saw it with my own eyes.
Using counts from this service and EWI. The “banksters” timing of infusions was perfect.
That’s all over now with the Fed Balance Sheet reductions now in place. With the EU to follow in a couple of months.
Thanks for the sobering reminder Joe. I for one am taking that cautionary tale quite seriously. Considering all the historical and immediate red flags in place, one has to smile at the fact that some still lampoon the idea of being prepared for what COULD happen. I learned two important things about trading bear markets. First, once they are confirmed you have to scalp ’em.
Second and probably more importantly, the serious money is made at their start, and that means you have to be positioned prior. This of course is risky as we have seen how often those calling a top the last several years have ended up with proverbial egg on their faces. Successful trading is all about making intelligent risk/reward assessments. For option traders like me, believe it or not, a full blown bear market can be more difficult to make great trades in because of the explosion of option premiums. The monster trades are made not only with profits that come from the directional trade being correct, but also the additional pop that comes from exploding premiums in positions entered when vol was quite low. Some of you will get what I am saying. Some of you will not, and that is O.K. 🙂
I’m sorry Joe but I just don’t see it. The Nikkei is hitting 20+ year highs, Hang Seng is higher than in 2015, Kospi is at all time highs, VIX is at it’s lowest levels ever, VX futures are at their lowest level ever… There is just nothing to even remotely suggest we are in any kind of trouble at all. It’s not some mystery as to what the Fed is doing by reducing its balance sheet. There are sophisticated models that represent what asset prices should do based on the actions the Fed has telegraphed. There is absolutely nothing to suggest we will see any pain in the near future.
That is quite all right Jimmy. No one ever does! 🙂
And they are right, far, far more often than not, Verne 😉
I agree fully. All the reasons cited for a bearish outlook have certainly been proven wrong the last few years. The interesting thing is the bearish signals were all real, and persist, but were all ultimately negated by the market’s relentless upward march. It does make one wonder how reliably the many reasons some now give for being bullish can be viewed…you know, the old “same as it ever was!”…just saying! Market metrics in this environment are quite dicey in my humble opinion. 🙂
“There are sophisticated models that represent what asset prices should do based on the actions the Fed has telegraphed.”
Yes… the Models are absolutely accurate! Buy, Buy, BUY!
It is also true that the market has bucked typical seasonal bias in a remarkable way this year and that certainly could continue. We did not see any sell in May and go away, and the market spectacularly departed from September’s historical bearishness. As I stated, it is possible that the market’s winning streak could continue through October, after all, some folk do survive a game of Russian Roulette, or two… 🙂
Long time since I’ve been first. But I will take it any way I can as long as that wascally wabbit doesn’t get it. What’s up doc?
Care to take a guess Doc?