
Another very slight new all time high continues the upwards trend today.
Summary: The correction may be over; while price remains above 2,541.60 now, this should be the expectation. The next target is at 2,602 to 2,614. However, there is less bullishness and more weakness today, so a little less support for this view.
While the trend is clearly up, overbought conditions illustrate risk here to long positions.
A new low below 2,541.60 would indicate the pullback is not over and a target for it to end would now be at 2,527 to 2,523. If this happens, then use it as an opportunity to add to long positions. The trend remains up.
Always trade with stops and invest only 1-5% of equity on any one trade.
Last monthly and weekly charts are here. Last historic analysis video is here.
MAIN ELLIOTT WAVE COUNT
WEEKLY CHART
Click chart to enlarge.
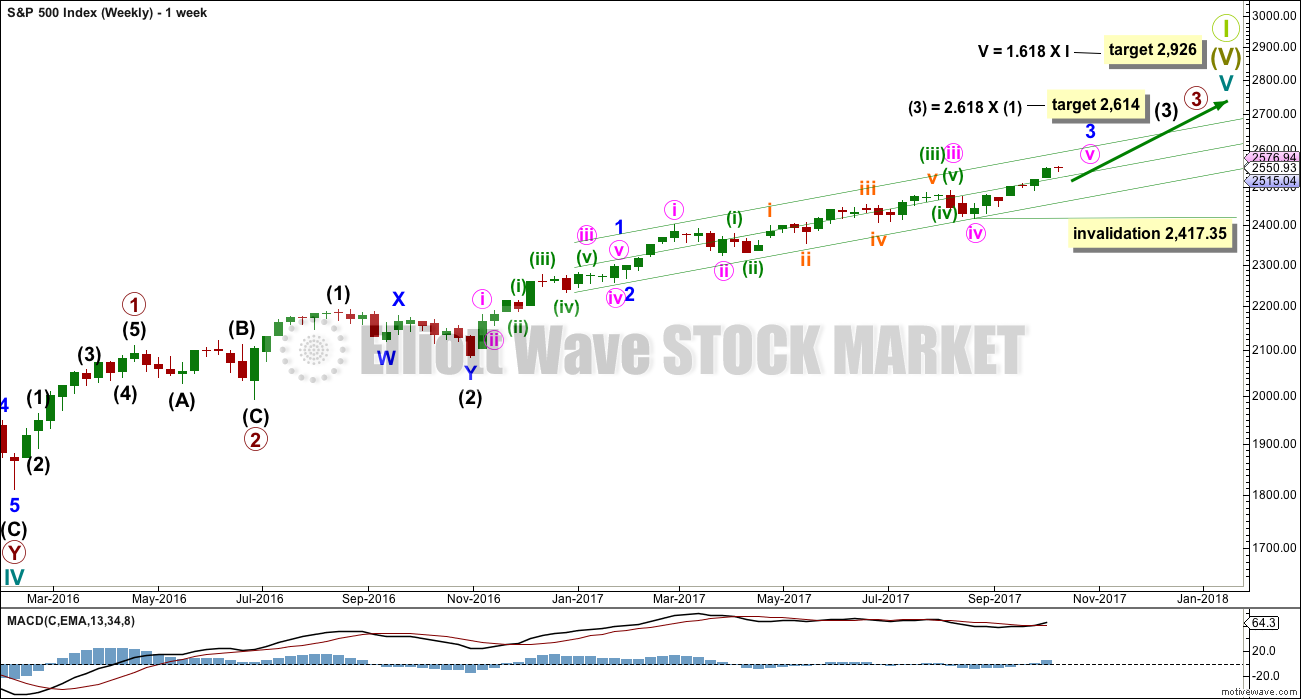
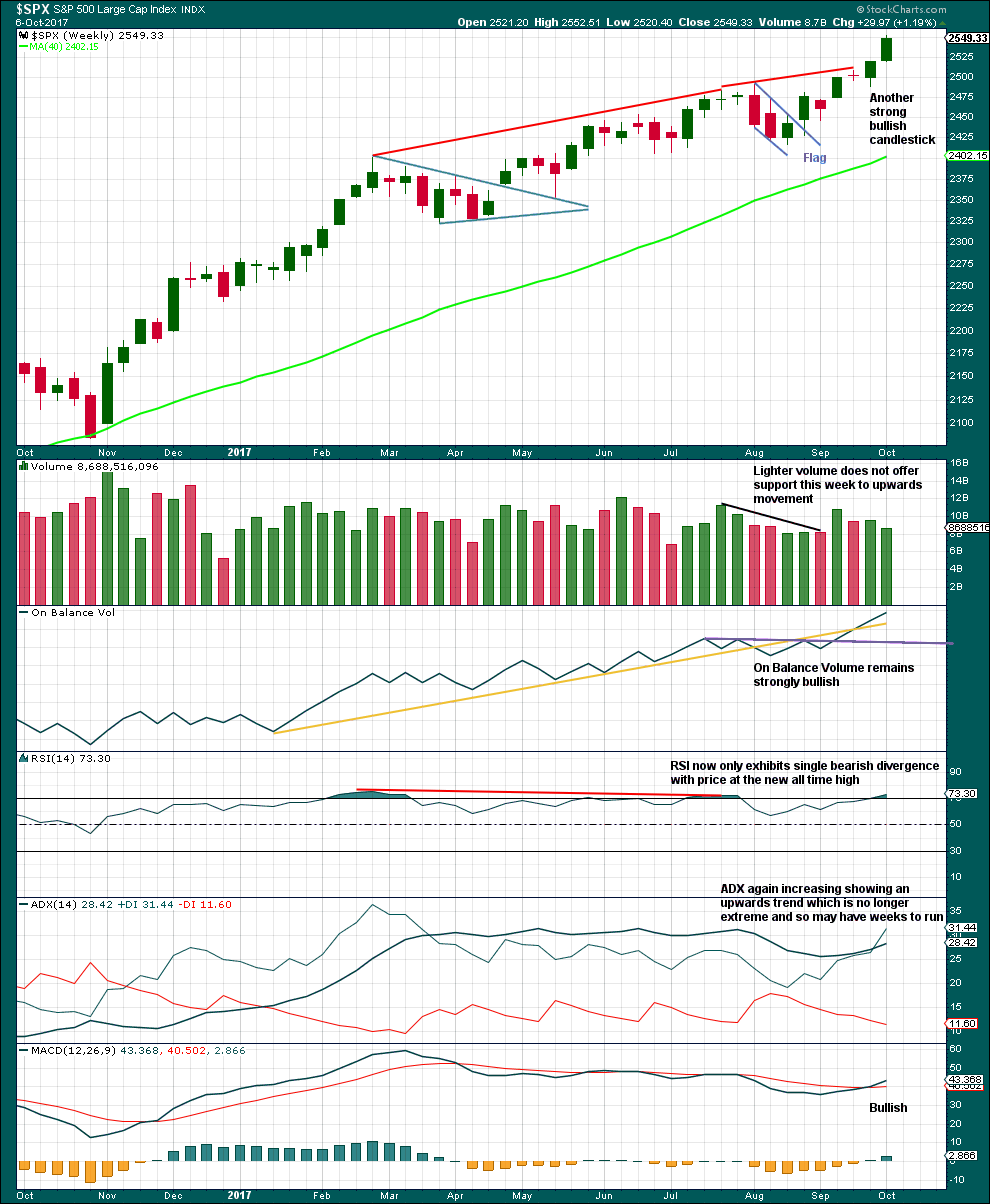
This wave count has strong support from another bullish signal from On Balance Volume at the weekly chart level. While classic analysis is still very bullish for the short term, there will be corrections along the way up. Indicators are extreme and there is considerable risk to the downside still.
As a Grand Super Cycle wave comes to an end, weakness may develop and persist for very long periods of time (up to three years is warned as possible by Lowry’s for the end of a bull market), so weakness in volume may be viewed in that larger context.
Within minute wave v, no second wave correction may move beyond the start of its first wave below 2,417.35.
The next reasonable correction should be for intermediate wave (4). When it arrives, it should last over two months in duration, and it may find support about the lower edge of this best fit channel. The correction may be relatively shallow, a choppy overlapping consolidation, at the weekly chart level.
DAILY CHART
Click chart to enlarge.
To see details of the whole of primary wave 3 so far see the analysis here.
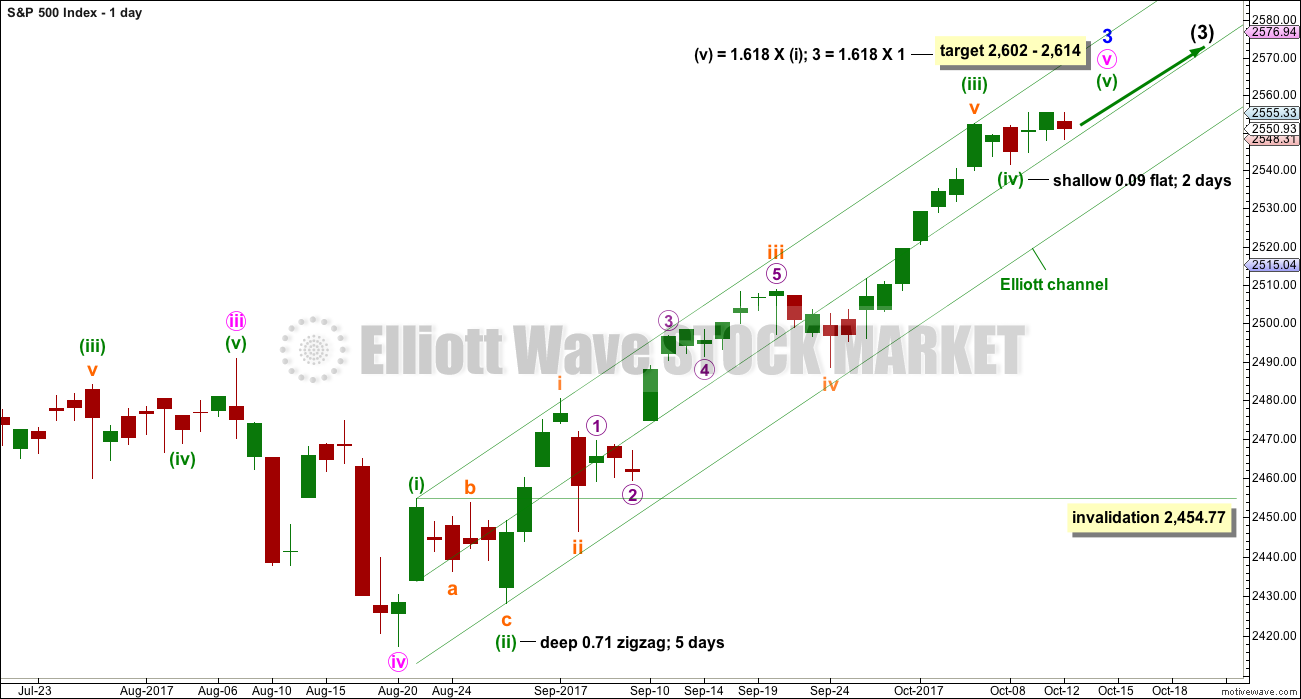
Minute wave v to complete minor wave 3 must subdivide as a five wave structure. It looks like an incomplete impulse. It looks like minuette waves (i) through to (iv) may now be complete despite minuette wave (iv) lasting only two sessions. The problem of proportion may be accepted if bullishness in classic analysis correctly predicts more upwards movement.
If it continues any further then minuette wave (iv) may not move back down into minuette wave (i) price territory below 2,454.77. If it continues further, then minuette wave (iv) may end to total a Fibonacci eight sessions and have good proportion with minuette wave (ii).
MAIN HOURLY CHART
Click chart to enlarge.
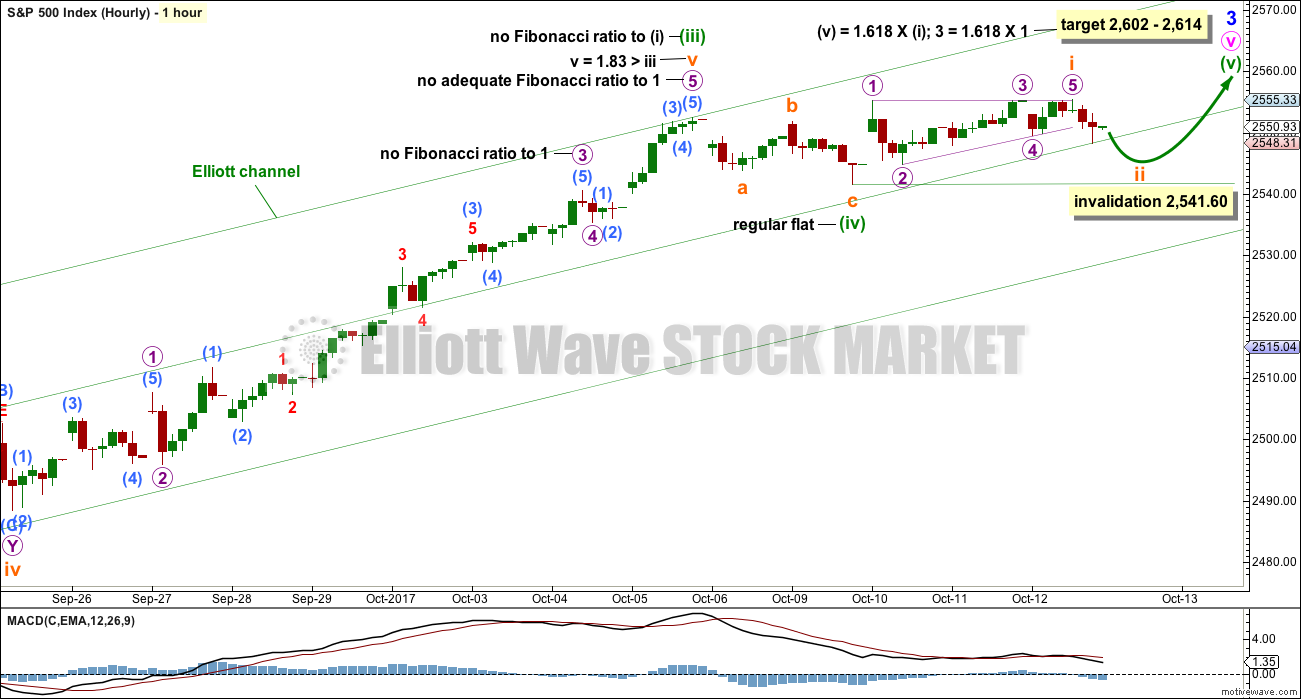
It is possible that minuette wave (iv) may have been as a flat correction. The downwards wave labelled subminuette wave a will subdivide as either a three or a five on the five minute chart. This wave count looks at it as a three which would give alternation for minuette wave (iv) as a flat correction to the zigzag of minuette wave (ii).
The target may now be calculated at two wave degrees, so it is widened to a rather large zone. When subminuette waves i through to iv are complete, then it can be calculated at a third degree. At that stage the zone may be narrowed.
Upwards movement for the start of minuette wave (v) will now subdivide nicely as a leading contracting diagonal for subminuette wave i. Leading diagonals in first wave positions are very commonly followed by very deep second wave corrections. If this structure is correctly labelled, then tomorrow subminuette wave ii may move lower, but it may not move beyond the start of subminuette wave i below 2,541.60.
A new low by any amount at any time frame below 2,541.60 would invalidate this main hourly wave count. At that stage use the alternate below.
Prior to any invalidation, it is safest to assume the trend remains the same, upwards.
ALTERNATE HOURLY CHART
Click chart to enlarge.
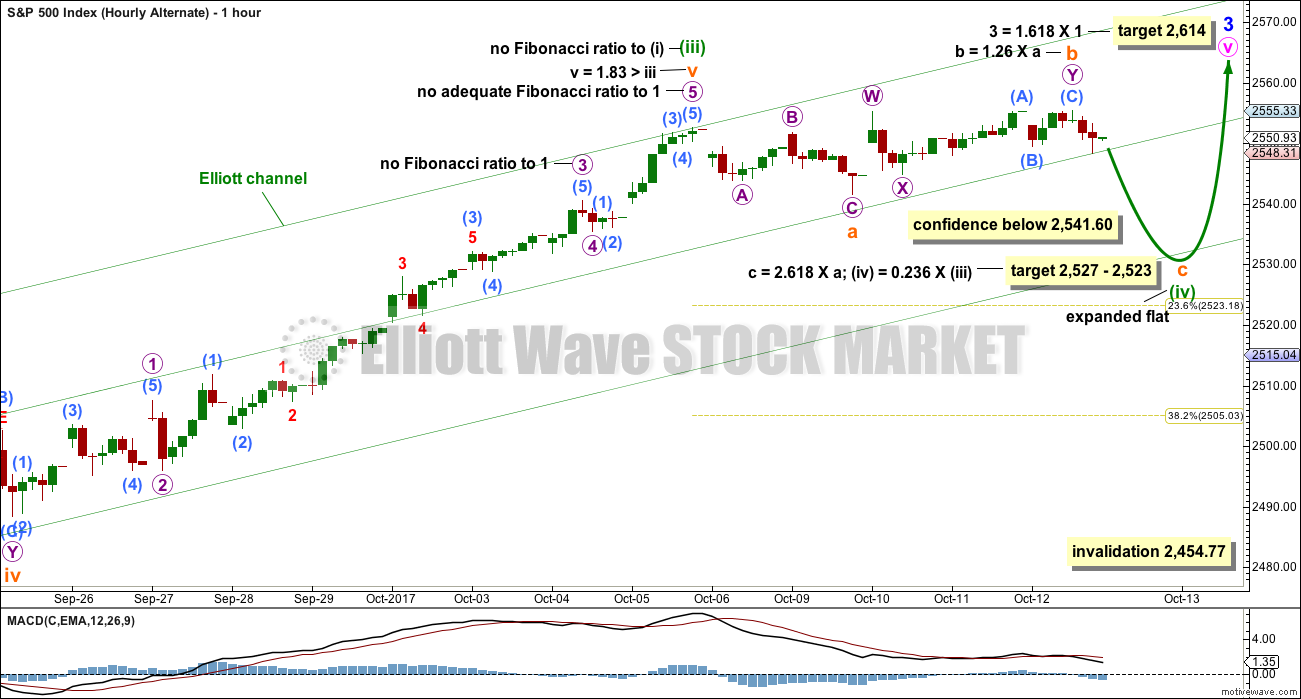
If minuette wave (iv) is not over, then it may continue for another three days to total a Fibonacci eight.
There are still multiple structural options for minuette wave (iv). Today, it is labelled as the most common option, an expanded flat. But it may still morph into a combination or complete as a running triangle.
An expanded flat may see minuette wave (iv) come lower to test support at the lower edge of the green Elliott channel. The target calculated may be a little too low if this channel offers strong support.
This alternate wave count would see minuette wave (iv) still exhibit good proportion with minuette wave (ii), and they would have perfect alternation. At the daily chart level, this wave count would give the structure of minute wave v a better look.
TECHNICAL ANALYSIS
WEEKLY CHART
Click chart to enlarge. Chart courtesy of StockCharts.com.
This chart remains very bullish, but with RSI now overbought for a little while the upwards trend may see a pullback soon to relive this overbought condition.
ADX is now again fully bullish at the weekly chart level as the black ADX line returns to below the directional lines.
The decline in volume for the last completed week is slightly bearish, but this bull run has done this before and yet price has continued higher. On its own this will not be taken as a sign that a pullback or consolidation must begin here. The bull run could continue yet for weeks.
DAILY CHART
Click chart to enlarge. Chart courtesy of StockCharts.com.
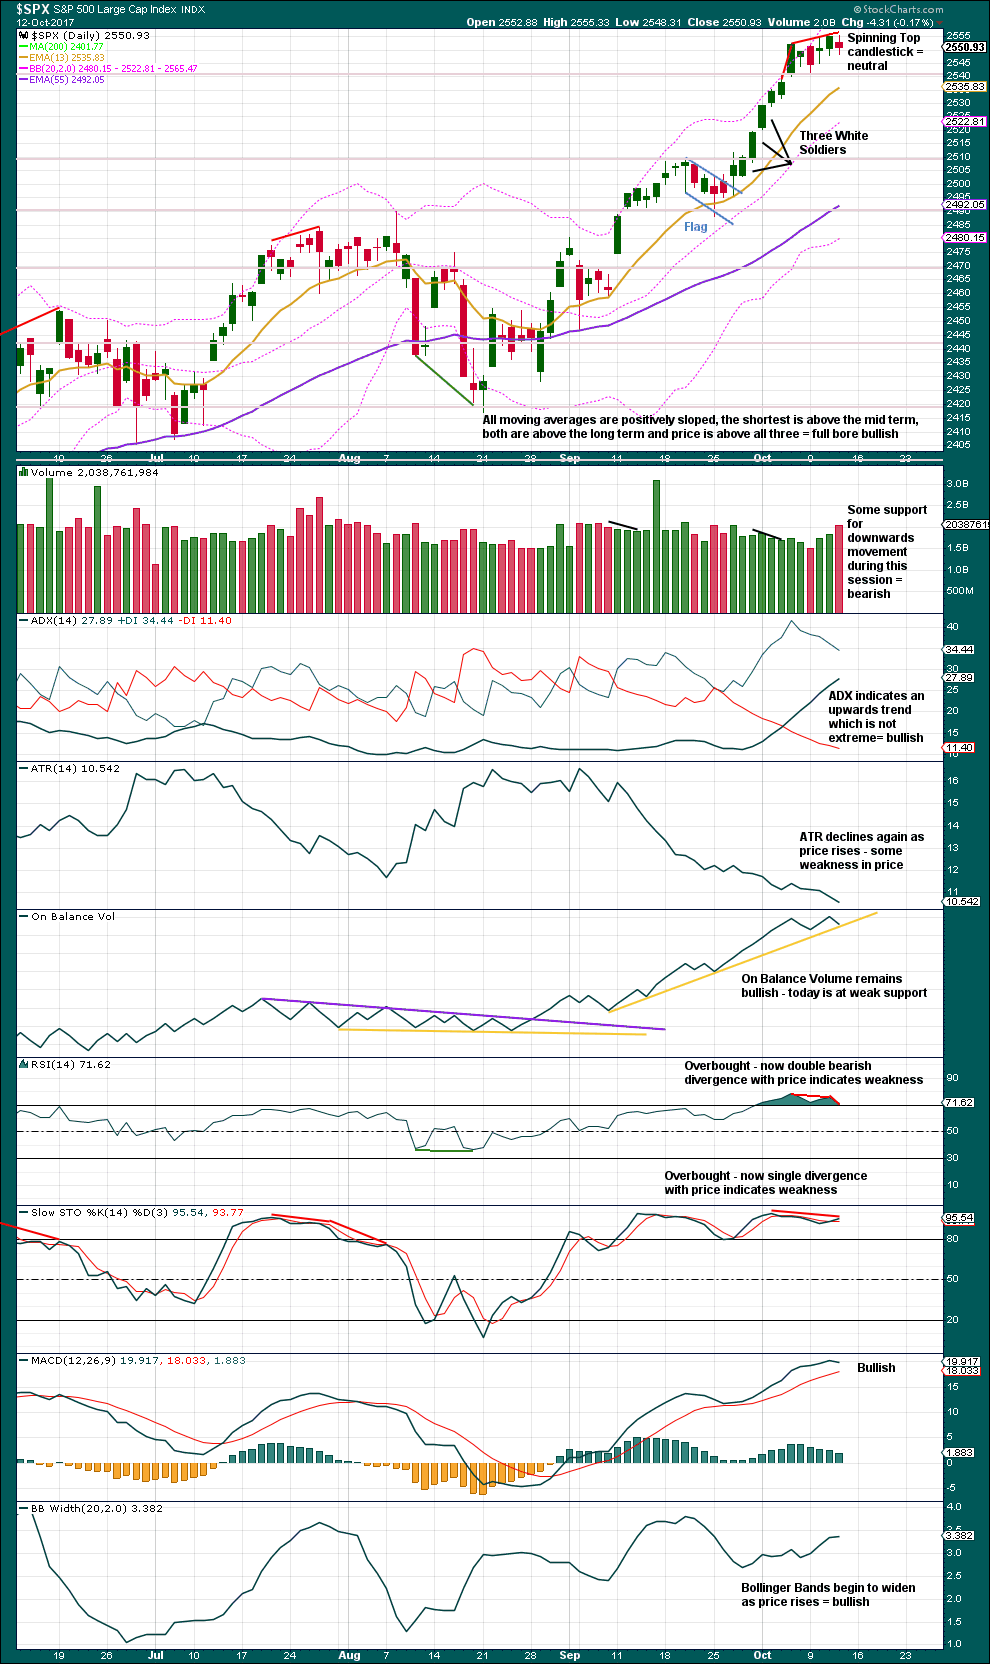
A very slight new all time high today now sees some bearish divergence return to RSI and remain with Stochastics.
If On Balance Volume breaks below support, that would offer support to the alternate hourly Elliott wave count, but right now On Balance Volume supports the main hourly Elliott wave count. Assume the yellow line will provide support until it is breached. The yellow line offers only weak technical significance as it is fairly steep. It is considered though because it has been tested four times and is reasonably long held.
Supporting the main hourly Elliott wave count: price, ADX, MACD, On Balance Volume and Bolllinger Bands.
Supporting the alternate hourly Elliott wave count: Spinning Top candlestick pattern, short term volume, ATR, RSI and Stochastics.
VOLATILITY – INVERTED VIX CHART
Click chart to enlarge. Chart courtesy of StockCharts.com.
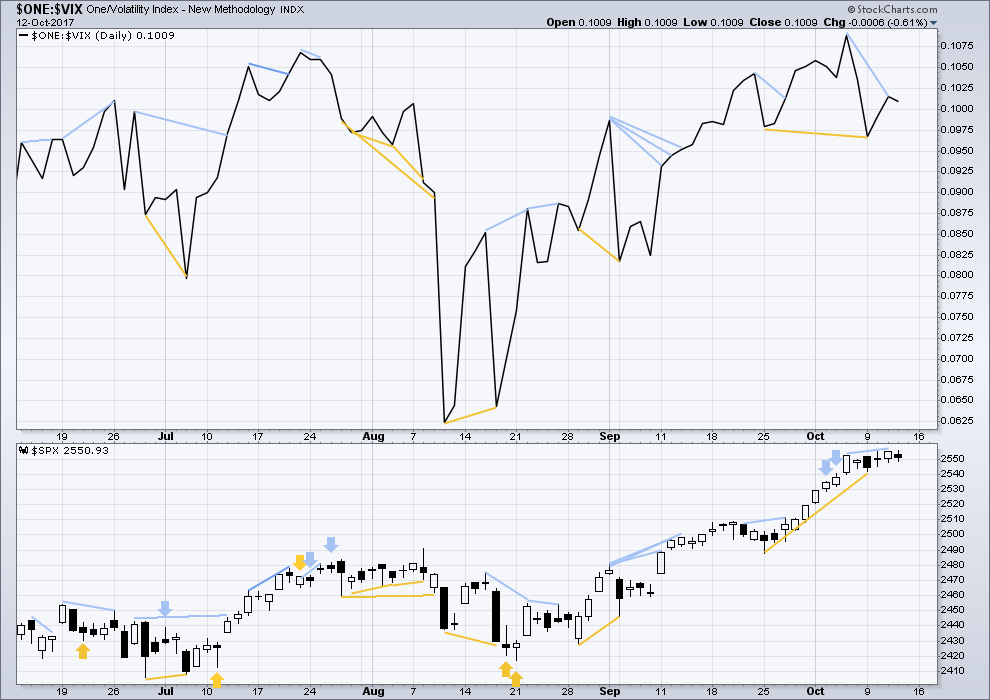
Normally, volatility should decline as price moves higher and increase as price moves lower. This means that normally inverted VIX should move in the same direction as price.
There is still bearish divergence today between price and inverted VIX. The new all time high for price does not come with a normal corresponding decline in market volatility; the rise in price is weak.
BREADTH – AD LINE
Click chart to enlarge. Chart courtesy of StockCharts.com.
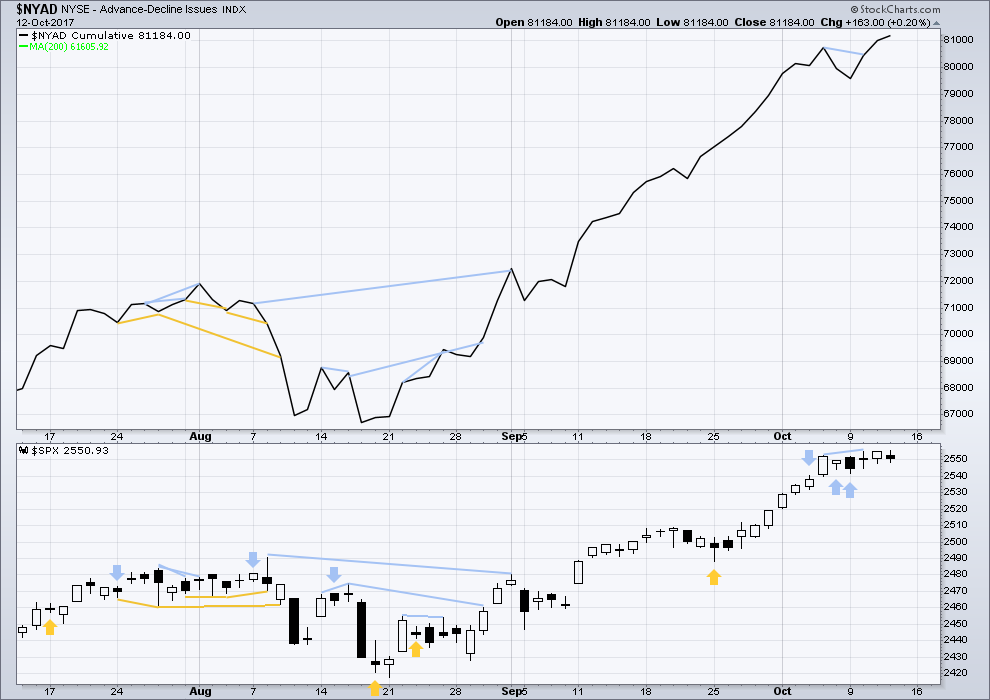
With the last all time high for price, the AD line also made a new all time high. Up to the last high for price there was support from rising market breadth.
There is normally 4-6 months divergence between price and market breadth prior to a full fledged bear market. This has been so for all major bear markets within the last 90 odd years. With no divergence yet at this point, any decline in price should be expected to be a pullback within an ongoing bull market and not necessarily the start of a bear market.
The AD line has again made a new all time high. As this should be read as a leading indicator, it supports the main hourly Elliott wave count. This is bullish.
Small, mid and large caps have all made new all time highs. The rise in price is supported in all sectors of the market.
Go with the trend. Manage risk.
DOW THEORY
All the indices are making new all time highs. The continuation of the bull market is confirmed.
The following lows need to be exceeded for Dow Theory to confirm the end of the bull market and a change to a bear market:
DJIA: 17,883.56.
DJT: 7,029.41.
S&P500: 2,083.79.
Nasdaq: 5,034.41.
Charts showing each prior major swing low used for Dow Theory are here.
Published @ 07:55 p.m. EST.
UVXY looks primed for a pop. There isn’t much more they can squeeze out of it. October futures traded at 10.20 today. The greed of the volatility shorts knows no bounds. RVX and and VXN are both well above their corresponding moving averages while VIX sits within grasp of all time lows. I think we’ll see an exhaustion spike like we had in May sometime within the next two weeks.
While it may be a slow upwards grind, it is having lots of little corrections along the way up. Price is sitting in the upper half of the green Elliott channel.
One approach to this market which IMO is the safest is to assume the trend remains the same, until it changes. That way your trades will be profitable, until the last one.
Use the corrections as opportunities to go long, with stops just below the EW invalidation points which may now also see stops just below the mid line of the EW channel. Either exit daily if that’s your thing, or pull stops up daily to protect some profit and hold on until the target is met.
If I’m wrong then you should have some profits, then the final trade or day a loss or a profitable trade stopped out.
If I’m right and the target is hit that’d be a nice profit.
Theoretically a bull trend like this should be easy to trade. Buy the dips.
Thank you everybody for keeping it civil. A couple of comments are borderline…. please remember to just stick to the facts and analysis and avoid anything that might look like a comment on another’s person.
We are all grownups here. We can discuss whatever we like, including politics. As long as we discuss the issues and not make any negative personal comments on another member.
Just a wee polite reminder.
I’m enjoying the conversation, thanks guys!
Good morning everybody 🙂
Before I read comments and answer any questions EW here’s your updated hourly chart.
The trend does indeed remain up. Assume it remains the same until proven otherwise.
DJT exhibiting a huge bearish engulfing candle after hitting an ATH yesterday. RUT continuing to lose steam.
It all depends on the tax bill and earnings. Great earnings and easy passage of tax reform would probably launch a true blowoff top that would take us to that 2600 target easily.
Otherwise we seemed destined for this quiet drift sideways/up. ATHs 4 out of 5 days this week but we’re looking at a pretty tight weekly candle. Not quite the type of week I’d have like to seen if we’re going to hit 2600 by the end of the month. We need a sizable dip before that can happen unless exogenous triggers work in our favor.
Looks like that DJT candlestick is turning bullish…
Nasdaq does look a little bearish with it’s long upper wick today though.
Still… overall the indices are all making new ATHs today. The upwards trend continues.
Blue Apron (APRN) has a superb show on today. Their earnings report will be on November 2, 2017 early morning. Maybe this action is a way to get in early just in case it incidentally struggles more. I’ve added a little into my portfolio for diversify (long term).
Ideally, a few more days of VIX B band compression accompanied by a new 52 week low would be the reversal set-up I would expect. We are not quite done with this move up methinks. True reversals out of rising wedges are generally sharp and decisive and the declines so far all continue to look corrective.
Have a great week-end everybody!
Does anyone have thoughts on how or if the market is going to fill the gap up 09/11/2017.
It seems like around a 5% move down. My 2 sense is that maybe this weekend NK may fire a missile, rumors are they are again active on the ground and may test a missile this weekend. Obviously the market deteriorates on NK news and it may start a down turn. Any thoughts on how this market will move 5% down to fill the gap?
I never saw a gap that has never been filled before..
It was pre-filled by the action on 9/4 and 9/5. (Some may say that’s not legitimate, but all the market “prefers” is that there be no gaps, and there isn’t one there…IMO.) However, the upcoming intermediate 4 may get down there again. Then there is a primary 4 looming in the future too.
Thanks Kevin, ideally insight is always useful. I will like Lara’s skillful and knowledge point of view on this gap.
In any favorable case the decrease won’t happen over night, that for sure.
Happy Friday the 13th everyone.
We are now 10 Trading days into Balance Sheet decline/runoff and the outer estimate of when I believe the effects will begin to be felt.
The 30 Year Treasury bond offering went off yesterday and was at the highest oversubscribed level in years.
From Monday on the effects of a liquidity draw will start to be felt in the same place that benefited most when it was pumped in.
This is the schedule of amounts… with 100% Certainty!
Runoff By… $10 Billion/mo increasing $10 Billion/Qtr to Max per month of $50 Billion.
Enjoy the final weekend!
My $0.02: certain and well known events in the near future are always already priced in. This one is too. It’s not sneaking up on anyone. That said, sure, there might be a minor sell off next week, one EW possibility (the alternate, with a C down) calls for that. No EW projections we have support much more than that. That all said, you could be right: price action speaks.
NOT at all priced in… because 99% of participants don’t believe it will have an effect or don’t understand how it effects . This is just a fact!
Plus the other little understood fact… The diversion of funds into investment in Plant, Equipment and production… away from where?
Diverted away from stock buy backs!
Financial institutions managing billions of $$$, with rooms full of quants, and they don’t understand this. Are you serious? Or…are they “complacent”? A word I see a lot around here. Let’s see what next week brings. 18 months of bull market (8.7 years, actually), it will end someday. Maybe next week. Maybe not!
Everyone thinks these people are geniuses… they are NOT! They just have access to a ton of money.
I have less faith in the credibility of the central bankers than you do. I believe their announcement of balance sheet reduction is the playing of their last psychological card in an attempt to maintain some credibility and the appearance of normalcy in these markets. These folk are masters of deception. I think your expectations are correct but not because of any putative reduction in their balance sheet or for that matter their manic purchases of equities. That claim, I maintain, is nothing but a tissue of lies. Having said that, there are forces in play that are larger and more powerful than central banksters. With all due respect to those who dismiss the idea of mean reversion, I would simply point out that SPX dividend yields sub 2.0 % have historically seen forward ten year returns of just about 0. Let’s see how long yields remain below 2%; the implications are significant. I suspect the first sign of trouble will be price action in HYG and JNK. I don’t think we are quite there yet.
One last time and then forevermore I will not say a word about it. Reversion? Of course. To a price mean? Doesn’t exist. Reversion to a target price based on mean PE’s? Well, such a target can be computed, but to argue it’s stable as a target is contrary to all factual data, on top of which, even if you compute a mean across history of PE’s, who’s to say that is the “appropriate” target PE for today’s economic conditions? All of which is to say…there’s no price mean. Reversion yes. Which really just means “price moves around”. But to a well defined MEAN (remember, that’s a PRECISE MATHMATICAL TERM and simple computation across a set of data points!)?? No. Clearly not. Let’s get back to your constant financial conspiracy theories, shall we? Because, yes, EVERYTHING is always explainable with a conspiracy theory. Particularly when you are eternally bearish and the market goes up for 18 months. Of course you aren’t wrong: it’s a conspiracy!!! Those banksters manipulating things again. Pardon me while I chuckle.
Reversion to WHAT, may I politely ask? 🙂
You concede the possibility of an “appropriate” target, and in the next sentence deny its existence. Now THAT’s funny!
Last time I checked science and mathematics weren’t a conspiracy theory…..
Stunning isn’t it?
The current SPX dividend yield is 1.96
True SPX under-evaluation will actually see yields go to 5% or higher.
What is really interesting is that even at the 2009 low they only went to about just over 3.5%. At the 1932 low yields were around 17%!
When we talk about historical market evaluations is it that some folk are just stubborn, or is it ignorance?!
Assume we see yields approach 5% or better in the next few years, and dividends remain the same, which is questionable as revenue has been steadily declining, that would mean a better than 50% price decline. But why am I wasting my breath…?
Of course HYG and JNK reflect the prevailing madness.
Have a great week-end Chris. Looks like a few more days before the vol pop we are expecting. 🙂
Price goes up, price goes down. So far we are in agreement. After that…I doubt there’s much we can agree on, besides EW facts. Why I like Lara’s approach: no politics. No meta-level “reasons” why some things “should happen”. No reversion to means in Elliott Wave theory. Not part of the methodology. Nor bankster manipulation. Just pure, simple, price action. The only truth there is. Go take your shorts quick, I’m sure the market is going to start reverting any moment now!!! (That sounds a bit facetious but one of you encouraged me to “prepare now” just the other day!) Me, I’ll trade the price action based on EW and technical analysis, thank you. That will provide me more than enough information, in time, to properly prepare and take advantage.
You too Verne. When I review the percentage of buybacks, lack of GAAP accounting, Top-line revenue decline, huge debt levels, compression of spreads, insane complacency, and then try and model valuations inputting GDP, inflation, durable goods, PMIs, wage and productivity growth; I arrive at the most overvalued capital markets in all of mankind’s history. There is no comparison.
Well… The Fed balance sheet build has extended EW wave counts on three separate occasions since mid 2012… by my count! Includes other central bank BS builds as well.
I would say this was a “bankster manipulation”
Now it’s time to shorten one EW count.
We will never see those 17% yields like in 1932 in our lifetimes. Nearly every bank the country failed that year. Over 32,000 businesses went bankrupt.
The problem with your theory is that things have fundamentally changed over the course of the century. Banks don’t fail anymore, because Central Banks back them up. The only thing that can break the current system is a sudden precipitous decline in the demand for U.S. debt. That won’t happen anytime soon though, because the U.S. economy is still far too advanced compared to the rest of the world. Developing economies need the U.S. economic machine working at full strength and are willing to do practically anything they can to keep it going at full strength.
The only real danger down the road is inflation. But we haven’t seen a whiff of it in nearly four decades.
Well Jimmy, I have to say your outlook on yields is fascinating, but I am not sure what it is based on. I agree that the immensity of dollar denominated debt that will default means massive deflation initially, no question.
If you agree, how do you think central banks are going to respond and with what results? The long bull run in bonds has ended I suspect.
We are not even considering the demise of the Petro-Dollar, something, if you have been paying attention, that is already well underway.
I don’t think the bull run in bonds has ended yet. A lot of real productivity gains are being made outside the U.S. as the developing world comes up out of poverty. The wealth that is being created is being used to buy U.S. debt to fund more productivity growth. This feed forward cycle can continue many years into the future. There is absolutely no need for anyone to pull back the reins yet.
Western Central Bankers are always going to respond to deflation by printing new money via debt monetization. The doomsdayers will continue to harp that all this money creation will lead to inflation, but the fact of the matter is that it hasn’t. People like Robert Prechter (he of EW fame) have been predicting for a long time now that this excessiveness will eventually resolve itself via a deflationary crisis followed by hyperinflation. They all thought the Great Recession was the first stage, but there hasn’t been any follow through. Inflation is nowhere to be seen.
I contend that it’s because U.S. debt is being backed up by real gains in international productivity. In the absence of supply shocks (which are rare and get rarer by the day), inflation can only occur when growth of the money supply exceeds growth of productivity. There is still too much low hanging fruit out there in terms of industrial potential all throughout the world. It’s a quite brilliant system, really. The world buys U.S. debt, and the U.S. buys what the world produces. The world uses the proceeds to buy even more U.S. debt, and the U.S. consumes even more.
I do think eventually we will reach a tipping point, but it is many, many decades away–after a majority of the rest of the world transitions to a post-industrial economy. I personally think it will coincide with the end of the next long banking debt cycle, which is probably 75-100 years in the future.
Chuckle away…I don’t mind in the least! 🙂
I heard very similar comments back in October 2007 just about exactly ten years ago.
I found these comments by Northmantrader quite insightful:
“….That’s what bubbles do. They blow past anyone’s expectations, they make believers of the unbelievers, make bears look like idiots and the most reckless look like geniuses.
But an extreme market that only becomes more extreme is not any less extreme, it is just more extreme. As no risk is apparent these extremes are then dismissed as the new normal.”
Caveat Emptor!
This reminds me Verne of one of Chris Ciovacco’s videos where he looked at the technicals prior to the stockmarket crash of October 1987.
When a bubble bursts and price crashes, there will be some warning in the technicals. ADX may be very extreme, volume may be showing some decline and weakness and market breadth should show divergence / weakness.
It won’t come immediately out of nowhere, I expect there will be warning signs. IMO. That is, if every crash and bear market to date in the last 92 years tells us anything.
I keep going back to Lowry’s. In their 92 year history every single bear market has been preceded by a decline in buying power, an expansion in selling pressure and at least 4-6 months of divergence with their Operating Companies Only (OCO) AD lines.
We should also see weakness first in small caps, leading next to weakness in mid caps and finally weakness in large caps.
At this time with the data we have in hand, none of the above weaknesses are evident with the sole exception of a steady decline in volume at the monthly chart level.
And that is why I am saying that this bull market looks like it has another 2-3 years to run.
A bearish crossover on RUT MACD has me thinking we could see a move down to the 1490 area for RUT and 2538 area for SPX tomorrow or early next week. SPX has had a tendency to gap up on Mondays though.
ATHs on Tuesday, Wednesday, and Thursday of this week have not been followed through with much conviction.
Agreed, no conviction, no real impulsive action. Even now, in theory, just started a 3 of a 5 up and yet, the price action is relatively weak, so far. Perhaps at some point today price moves decisively to the upside to finally get into some legitimate 3 of 5 action. Alternatively…this tiny ii we have end of day yesterday that broke below the leading diagonal may NOT be over, we get an expanding flat ii, and price tests the low of prior iv around 2542, THEN the 3 finally kicks off.
Joseph is exactly right. It is clear as the noses on our faces how wave movements the last several years have aligned with Q.E. infusions. People somehow seem to think when we refer to CB intervention in the market that we are denying the bullish trend and that is simply not the case. We have all made great profits trading the market to the upside guided by Lara’s sharp market analysis. The point of the comments with regard to the role of central banks is that traders need to understand the kind of market we are trading, namely once divorced from economic reality, and that market risks are probably far greater than it would appear at first glance. While we may not know WHEN the illusion will end, history tell us in no uncertain terms HOW! Caveat Emptor! 🙂
It’s as clear as day… the perfect timing of the “bankster manipulation”!
Just as the confirmation of an EW bear count was to be confirmed the QE rushed in to prevent that confirmation. The most recent was in July-Aug 2015 to Feb 2016. That was a clear “bankster manipulation” to prevent a confirmation of an EW Bear Count. It occurred again in 2012 with all out QE and one other time.
It was as if the “banksters” were using EW Theory to time the infusions.
Nobody is going to tell me it didn’t occur… because I saw it with my own eyes.
Using counts from this service and EWI. The “banksters” timing of infusions was perfect.
That’s all over now with the Fed Balance Sheet reductions now in place. With the EU to follow in a couple of months.
Indeed! If you were trading the markets you could not miss it…unless, of course, you were blind! Bottom line is the bull run has been entirely owing to central bank infused liquidity. Absent that, the market will most certainly collapse. The continued upward surge is proof positive they are still buying imho. 🙂
Yep- I am short RUT by way of TZA.
Hi all! Good luck!