
Price has moved higher during Wednesday’s session.
Summary: The correction may be over; while price remains above 2,544.86, this should be the expectation. The next target is at 2,602 to 2,614. Bullishness today from volume, On Balance Volume, and rising market breadth supports this view.
A new low below 2,544.86 would indicate the pullback is not over and a target for it to end tomorrow would be 2,538. If this happens, then use it as an opportunity to add to long positions. The trend remains up.
Always trade with stops and invest only 1-5% of equity on any one trade.
Last monthly and weekly charts are here. Last historic analysis video is here.
MAIN ELLIOTT WAVE COUNT
WEEKLY CHART
Click chart to enlarge.
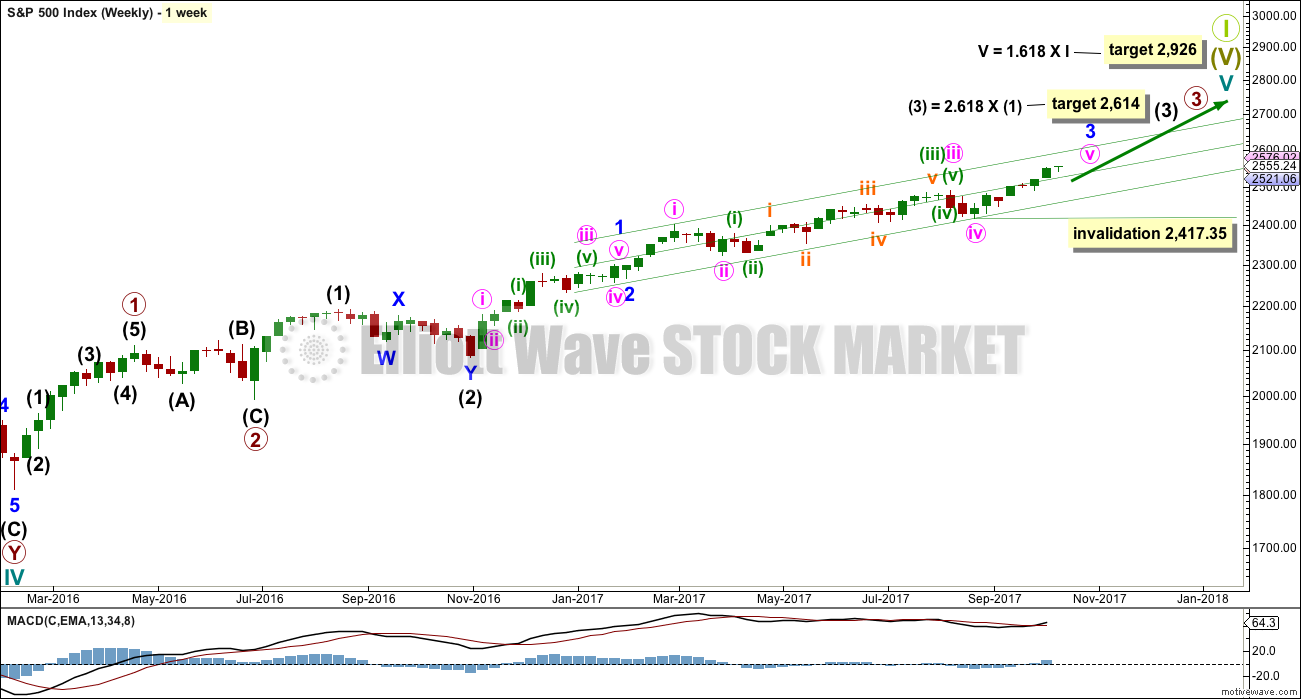
This wave count has strong support from another bullish signal from On Balance Volume at the weekly chart level. While classic analysis is still very bullish for the short term, there will be corrections along the way up. Indicators are extreme and there is considerable risk to the downside still.
As a Grand Super Cycle wave comes to an end, weakness may develop and persist for very long periods of time (up to three years is warned as possible by Lowry’s for the end of a bull market), so weakness in volume may be viewed in that larger context.
Within minute wave v, no second wave correction may move beyond the start of its first wave below 2,417.35.
The next reasonable correction should be for intermediate wave (4). When it arrives, it should last over two months in duration, and it may find support about the lower edge of this best fit channel. The correction may be relatively shallow, a choppy overlapping consolidation, at the weekly chart level.
DAILY CHART
Click chart to enlarge.
To see details of the whole of primary wave 3 so far see the analysis here.
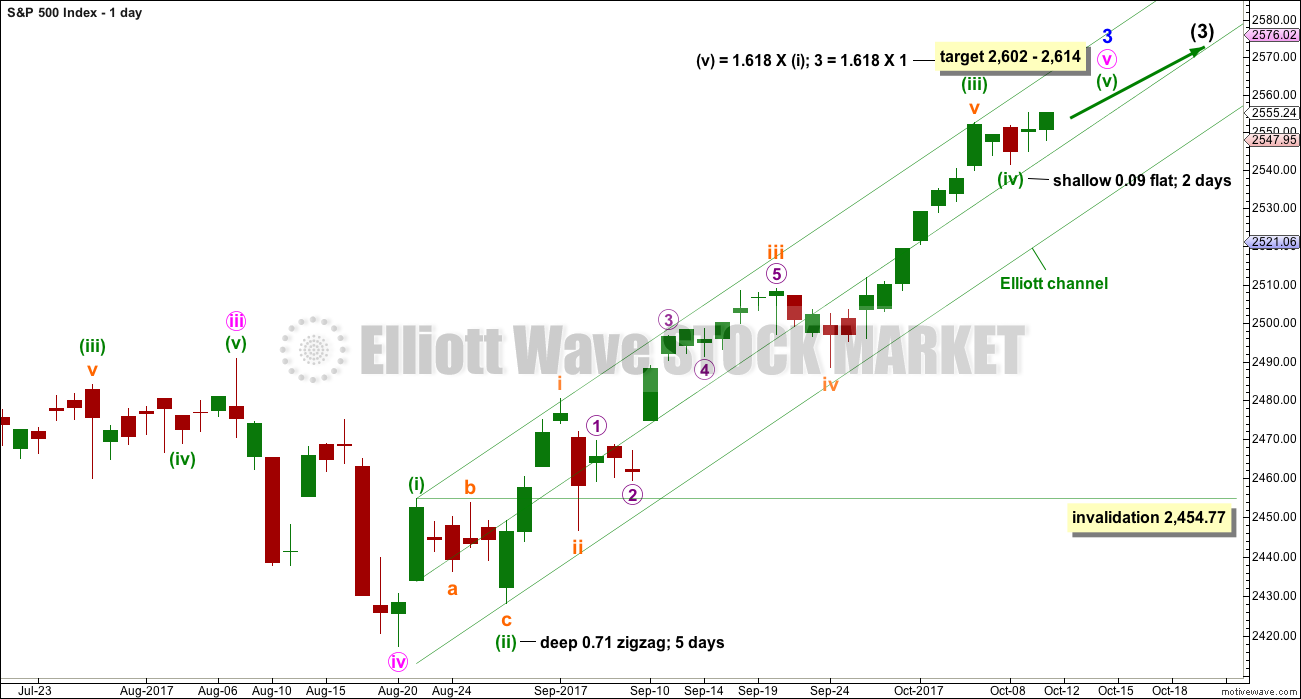
Minute wave v to complete minor wave 3 must subdivide as a five wave structure. It looks like an incomplete impulse. Today, it looks like minuette waves (i) through to (iv) may now be complete despite lasting only two sessions. The problem of proportion may be accepted if bullishness today seen in volume and rising market breadth correctly predicts more upwards movement tomorrow.
If it continues any further then minuette wave (iv) may not move back down into minuette wave (i) price territory below 2,454.77. If it continues further, then minuette wave (iv) may end tomorrow to total a Fibonacci five sessions and have perfect proportion with minuette wave (ii). If it takes longer than that though, it may continue for another three sessions to total a Fibonacci eight.
MAIN HOURLY CHART
Click chart to enlarge.
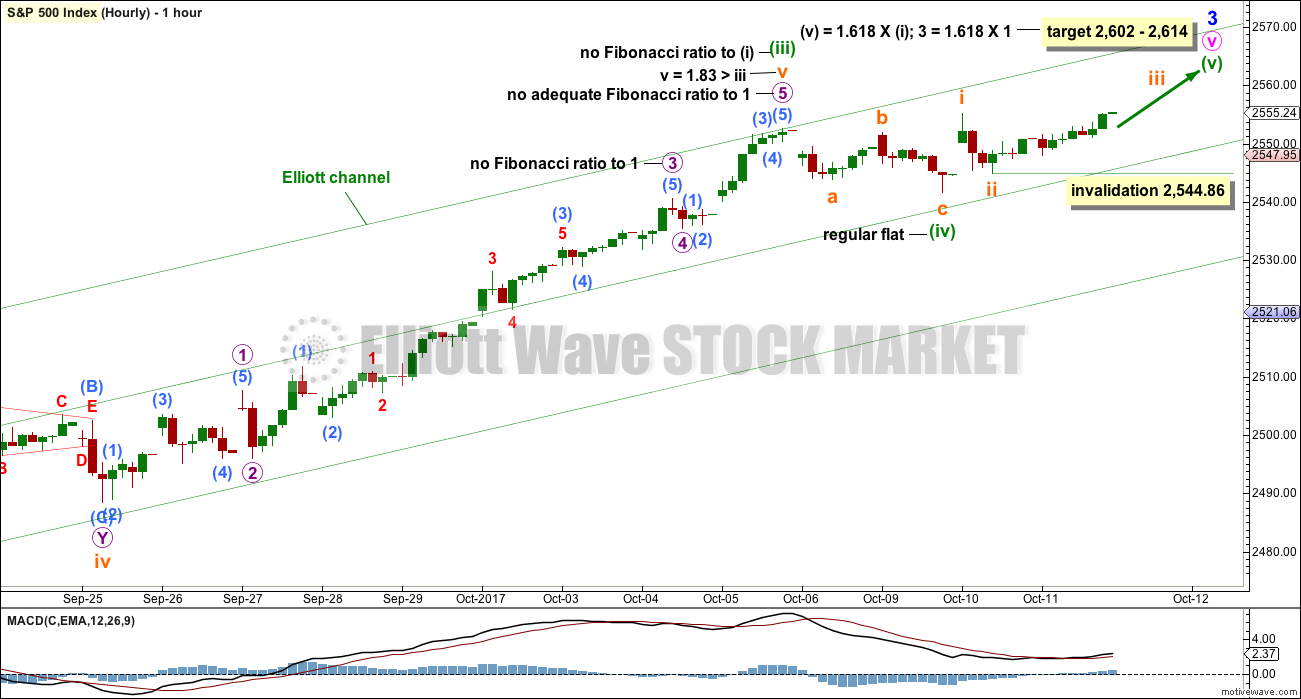
It is possible that minuette wave (iv) may have been over two days ago as a flat correction. The downwards wave labelled subminuette wave a will subdivide as either a three or a five on the five minute chart. This wave count looks at it as a three which would give alternation for minuette wave (iv) as a flat correction to the zigzag of minuette wave (ii).
The target may now be calculated at two wave degrees, so it is widened to a rather large zone. When subminuette waves i through to iv are complete, then it can be calculated at a third degree. At that stage the zone may be narrowed.
If minuette wave (iv) is over, then within minuette wave (v) a first and second wave may now be complete. Within subminuette wave iii, no second wave correction may move beyond its start below 2,544.86.
A new low below 2,544.86 by any amount at any time frame would see this main hourly wave count invalidated. At that stage, use the alternate hourly wave count below.
ALTERNATE HOURLY CHART
Click chart to enlarge.
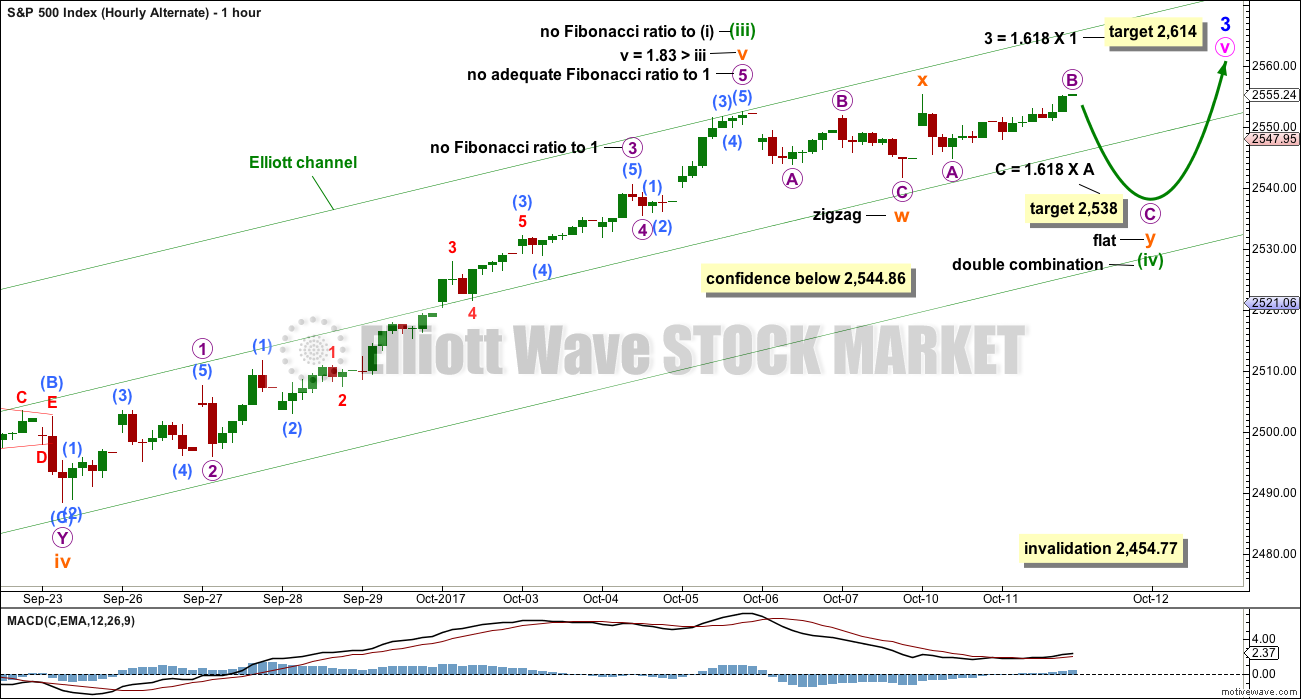
It is still possible that minuette wave (iv) may continue sideways as a combination. This may also be relabelled as an expanded flat or triangle. All these structures are sideways movements and the overall expected direction is still the same no matter which of these three options it takes: sideways.
The target for micro wave C downwards to complete the combination tomorrow would see subminuette wave y end close to the same level as subminuette wave w, so that the combination achieves a sideways look to it. This would also see minuette wave (iv) end close to the mid line of the Elliott channel.
If minuette wave (iv) were to be deeper than this, then it should find strong support at the lower edge of the Elliott channel.
The final target for minor wave 3 to end remains the same as the upper edge of the zone for the main hourly wave count.
This alternate hourly wave count does not have support from volume, market breadth or On Balance Volume today. Therefore, it must today be judged to be an alternate for these reasons.
TECHNICAL ANALYSIS
WEEKLY CHART
Click chart to enlarge. Chart courtesy of StockCharts.com.
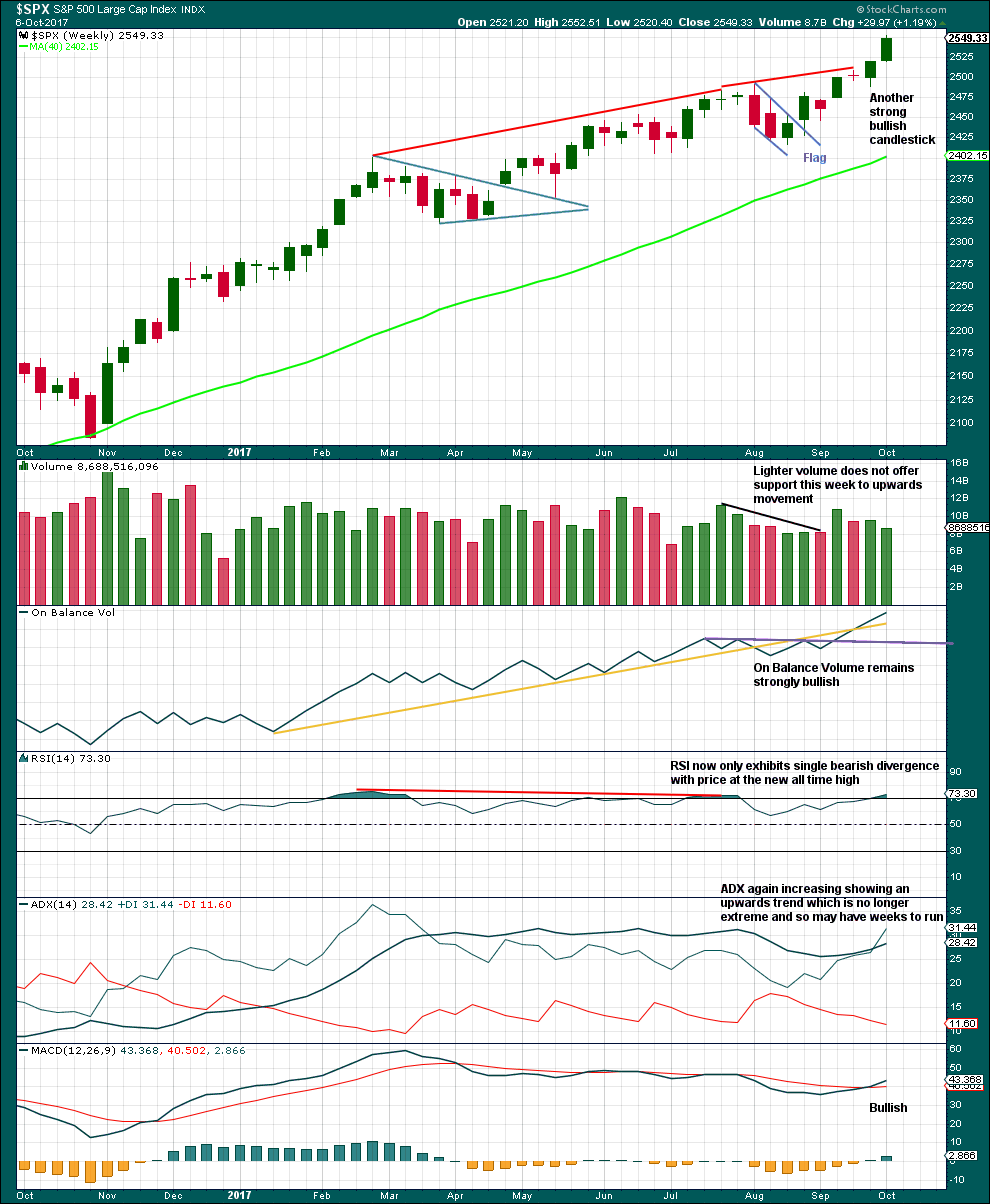
This chart remains very bullish, but with RSI now overbought for a little while the upwards trend may see a pullback soon to relive this overbought condition.
ADX is now again fully bullish at the weekly chart level as the black ADX line returns to below the directional lines.
The decline in volume for the last completed week is slightly bearish, but this bull run has done this before and yet price has continued higher. On its own this will not be taken as a sign that a pullback or consolidation must begin here. The bull run could continue yet for weeks.
DAILY CHART
Click chart to enlarge. Chart courtesy of StockCharts.com.
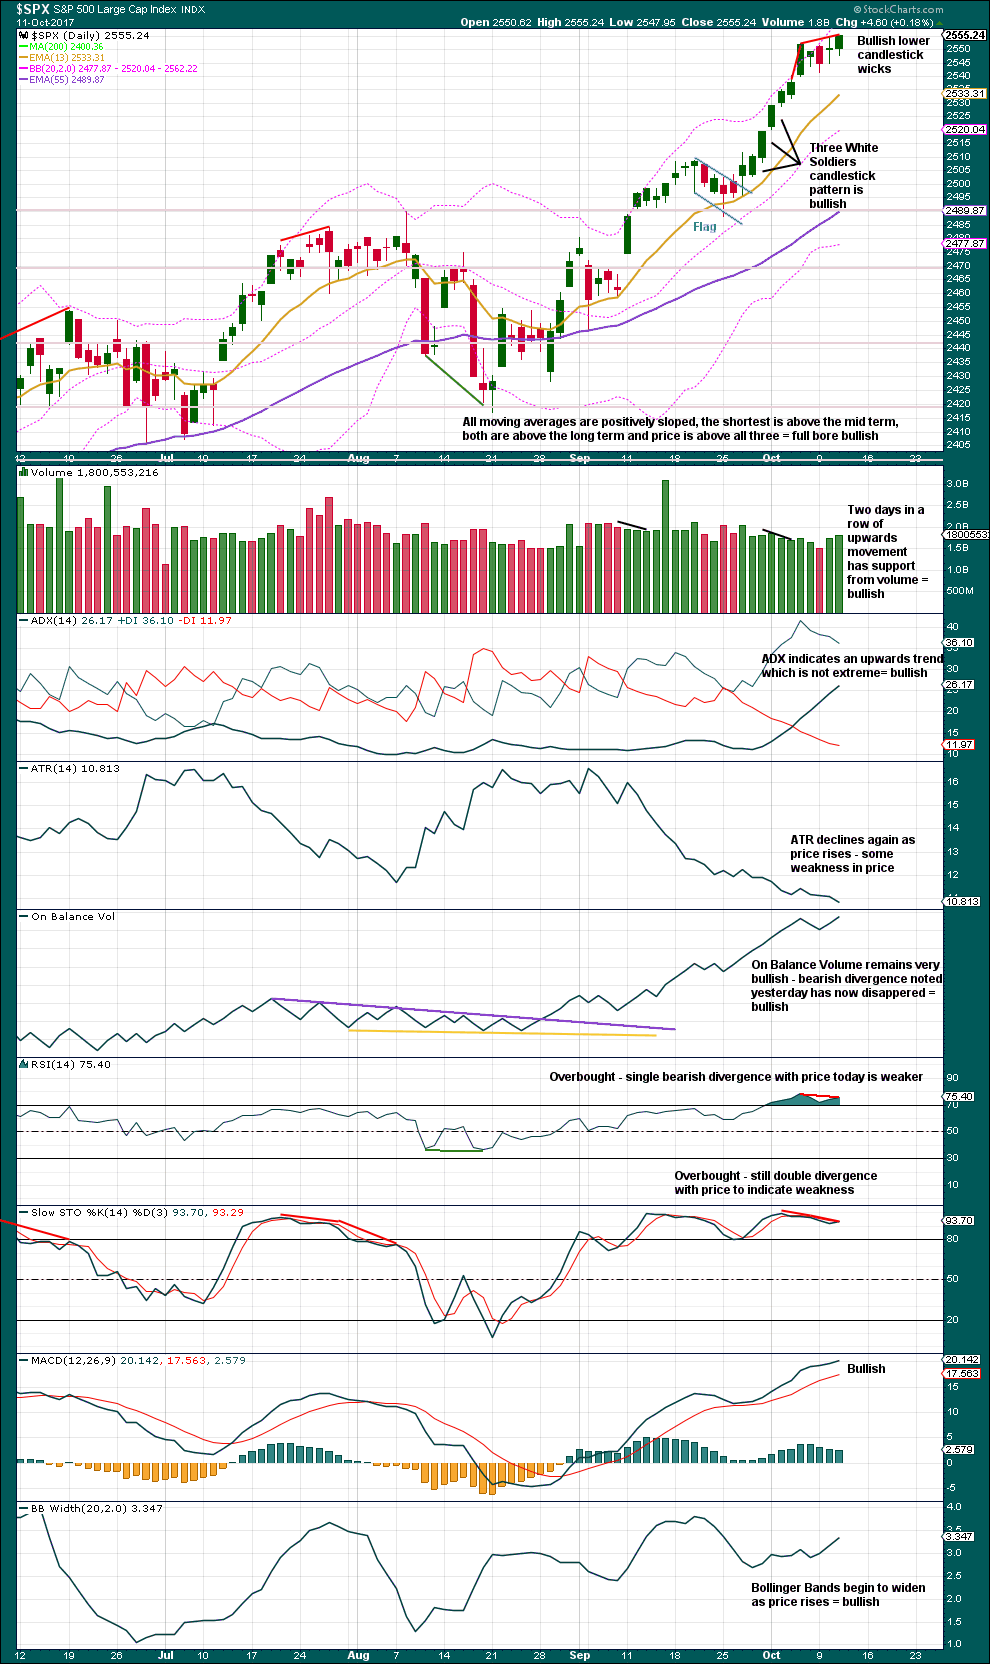
Bearish divergence noted yesterday with On Balance Volume has simply disappeared today. With On Balance Volume making a new all time high, it is now very bullish and offers support to the idea that the consolidation is over already and the next wave up is underway. Rising volume for another day also supports this idea.
This chart is looking more bullish today.
There are still warning signs that this trend is nearing extreme though. RSI is overbought and does still exhibit some divergence with price, although it is weaker. Stochastics has been overbought for a while now and still exhibits double divergence with price. If the Elliott wave analysis is wrong, it may be that the target calculation is too high.
VOLATILITY – INVERTED VIX CHART
Click chart to enlarge. Chart courtesy of StockCharts.com.
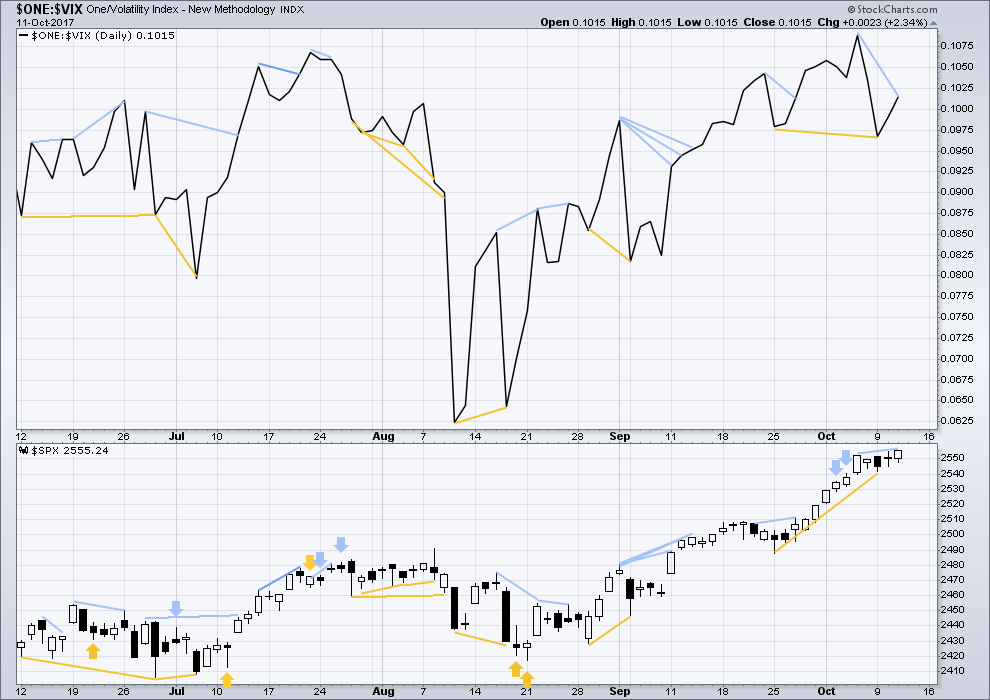
Normally, volatility should decline as price moves higher and increase as price moves lower. This means that normally inverted VIX should move in the same direction as price.
There is still bearish divergence today between price and inverted VIX. The new all time high for price does not come with a normal corresponding decline in market volatility; the rise in price is weak.
BREADTH – AD LINE
Click chart to enlarge. Chart courtesy of StockCharts.com.
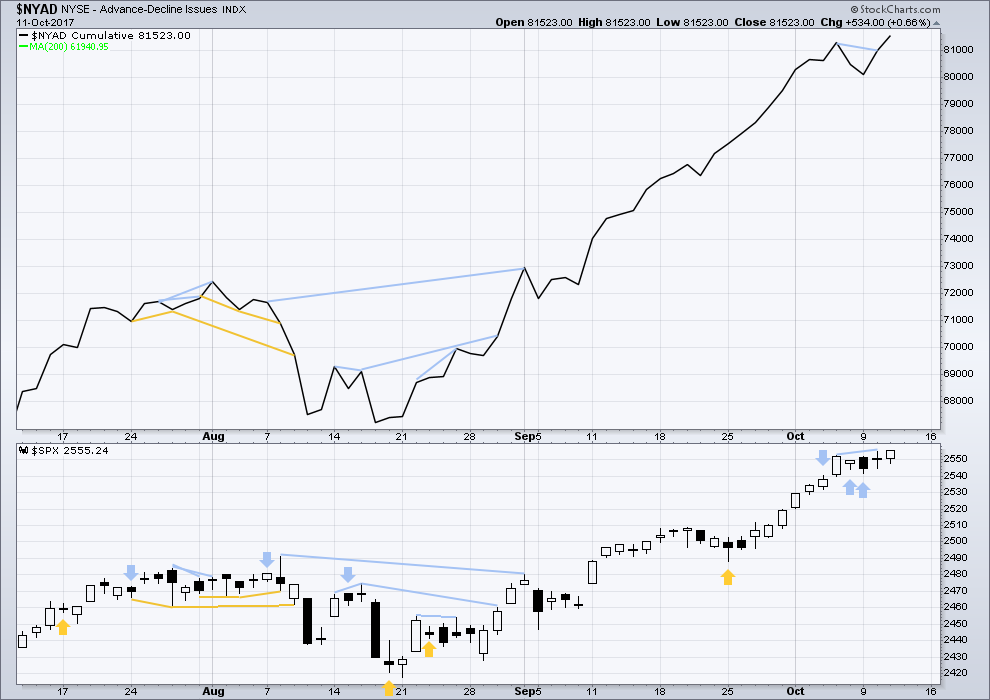
With the last all time high for price, the AD line also made a new all time high. Up to the last high for price there was support from rising market breadth.
There is normally 4-6 months divergence between price and market breadth prior to a full fledged bear market. This has been so for all major bear markets within the last 90 odd years. With no divergence yet at this point, any decline in price should be expected to be a pullback within an ongoing bull market and not necessarily the start of a bear market.
Bearish divergence noted yesterday between price and the AD line has now simply disappeared. While this is not common, it does happen. The AD line has today made a new all time high. As this should be read as a leading indicator, it supports the main hourly Elliott wave count. This is bullish.
Small, mid and large caps have all made new all time highs last week. The rise in price is supported in all sectors of the market.
Go with the trend. Manage risk.
DOW THEORY
All the indices are making new all time highs. The continuation of the bull market is confirmed.
The following lows need to be exceeded for Dow Theory to confirm the end of the bull market and a change to a bear market:
DJIA: 17,883.56.
DJT: 7,029.41.
S&P500: 2,083.79.
Nasdaq: 5,034.41.
Charts showing each prior major swing low used for Dow Theory are here.
Published @ 06:22 p.m. EST.
I am sorry everybody for not being quick enough this morning to post a chart prior to the close of the NY session. It has been a slow and odd start today in my home. Back to normal now and your analysis will be published promptly today.
Thank you all for your patience.
Remarkably, the pairs trade of short vol juice equities has failed to produce a new 52 week low in VIX. The banksters now appear to be at the elastic limit of that particular subterfuge. Yen and Gold also seem no longer interested in funding the equities ramp. Things are getting interesting. I remain amazed at the complete absence of fear in the markets…we’ll see for how long that persists…
Verne, when you say one more wave up, are you following Lara’s count or do you think we might be more advanced in terms of wave degrees?
I am thinking we may be at higher degree-wise but I am assuming that Lara is right and I am not… 🙂
LOL
That may not always be a safe assumption to make Verne…. I’m always open to considerations that I’ve got it wrong. And to chart and consider another idea 🙂
Dang… I entered XIV yesterday. Tightened my stop this AM before the market opened, and then got whip-sawed out in the first ten minutes. Thankfully it was a profitable trade, but out too way quick on a meaningless swing against me.
If anyone here has perfected the fine art of placing stops, please share your secret!!!
(I duuno, Verne, maybe options trades?)
Use the wave count to set your stops. We knew the next move down would be corrective so you could have used a more generous stop to enable you to stay long in the trade.
A good opportunity brewing. Contracting B bands suggesting a huge volatility move just ahead….
One more wave up I think….
You’re right, Verne. I confess that I usually do tend to run stops too tight. Sometimes that means a nice quick profit, but all too often it means getting whipped out on insignificant pull-backs, only to find it hard to re-join the trend at an acceptable price.
Risk management is tricky! Especially the emotional element!
Learning bit by bit…
I find that trailing stops are much better to use to avoid whipsaws, vs hard stops. The Robots hunt down stops at pivots pretty relentlessly.
Yes they do…they have now made it an art form, preying on the unwary….which is why I generally use mental stops…
This can work flawlessly if you never, ever, look away. Or if you trade at fairly long timeframes.
This is probably true. I’ve often wondered how the market knew exactly where my stop was. It has to be some algos pushing/pulling toward clusters of stops. Or just dumb luck.
If you place your stops in the market, remember at the very least your broker can see them, and yes, some brokers will run the stops of their own clients! In addition as Chris pointed out, the algos are programmed to run obvious support and resistance pivots. It it really incredible how good at this they have become. Randy Phinney of Right Side of the Chart even had to change the way he recommended using stops because of how often his trades were getting ambushed.
I’m really glad this came up today. You’ve given me some serious food for thought. Thank you!
Looks to me like the orange three on the hourly main started with a leading diagonal 1, and this pullback is the 2.
The test is here: does the market make it over the “1” that pushed to the new ATH on Tuesday? Thus adding strength to the model that price is now in a 3 up? OR does it fail here (again), and add strength to the alternative “starting a c correction down” model? I’m not voting: I’m watching.
“Summary: The correction may be over;”
yowza
IKR! That may have been rather quick and shallow!
That chart is looking mighty bullish.