
For the very short term, a little upwards movement was expected for Tuesday’s session and this is what has happened. Tuesday put in a higher high and a higher low, closing as a doji, which is entirely normal within a correction.
Summary: Two or five days of choppy, overlapping and generally trending downwards movement are now expected to complete this small consolidation.
In the very short term, expect downwards movement tomorrow. This is indicated by divergence between price and RSI, double divergence between price and Stochastics, divergence between price and VIX, and also divergence between price and the AD line today.
The trend remains up. Go with the trend. Corrections are an opportunity to join the trend. Only the most experienced and nimble of traders may consider trading a smaller correction short. Most traders should wait until the correction is complete before entering long.
Always trade with stops and invest only 1-5% of equity on any one trade.
Last monthly and weekly charts are here. Last historic analysis video is here.
MAIN ELLIOTT WAVE COUNT
WEEKLY CHART
Click chart to enlarge.
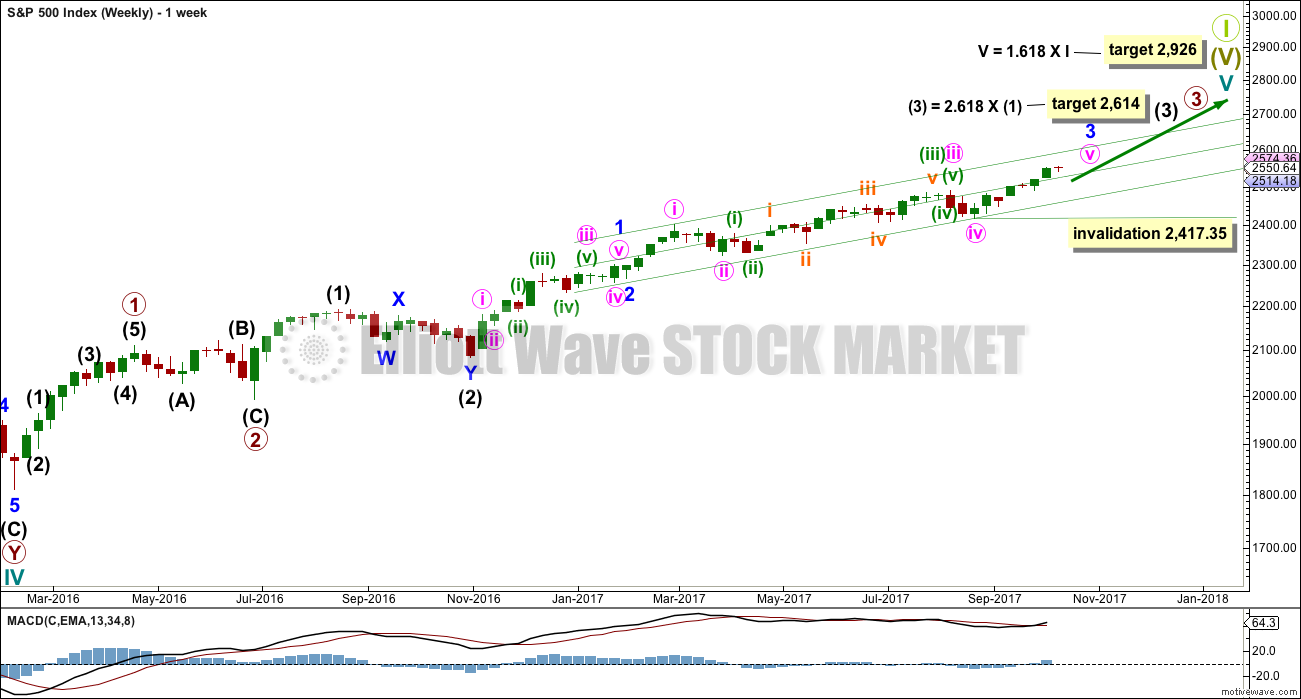
This wave count has strong support from another bullish signal from On Balance Volume at the weekly chart level. While classic analysis is still very bullish for the short term, there will be corrections along the way up. Indicators are extreme and there is considerable risk to the downside still.
As a Grand Super Cycle wave comes to an end, weakness may develop and persist for very long periods of time (up to three years is warned as possible by Lowry’s for the end of a bull market), so weakness in volume may be viewed in that larger context.
Within minute wave v, no second wave correction may move beyond the start of its first wave below 2,417.35.
The next reasonable correction should be for intermediate wave (4). When it arrives, it should last over two months in duration, and it may find support about the lower edge of this best fit channel. The correction may be relatively shallow, a choppy overlapping consolidation, at the weekly chart level.
DAILY CHART
Click chart to enlarge.
To see details of the whole of primary wave 3 so far see the analysis here.
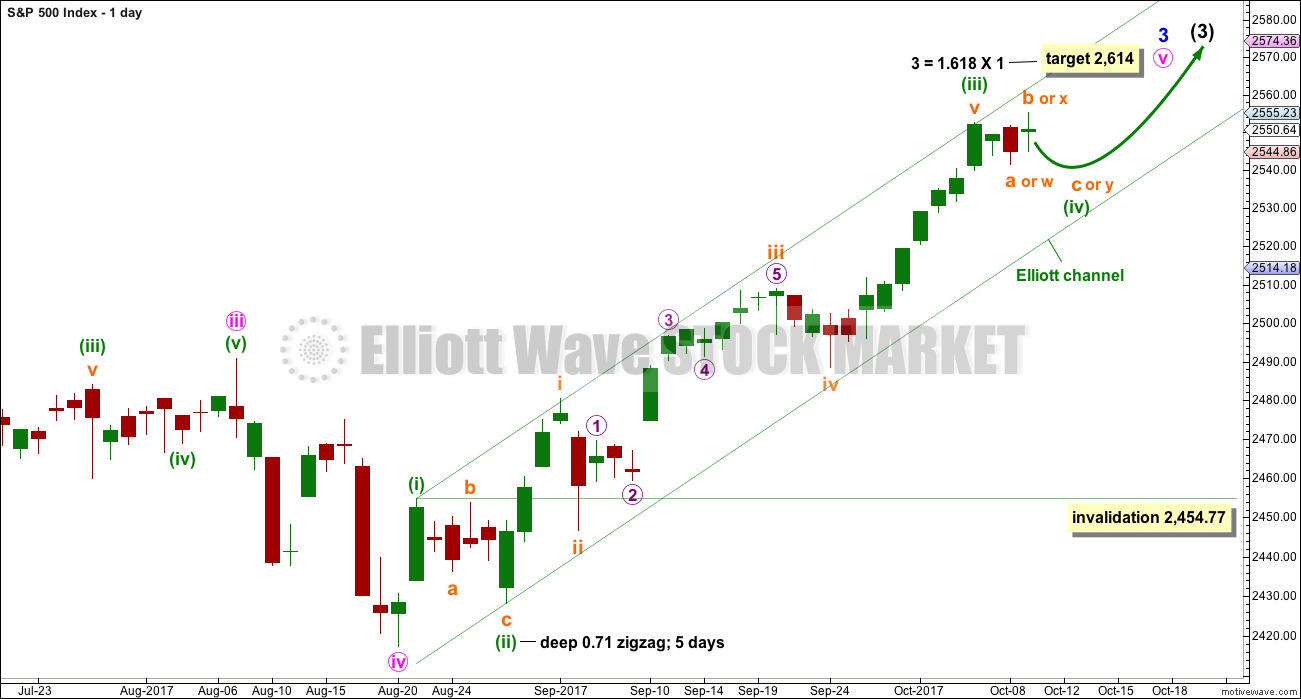
Minute wave v to complete minor wave 3 must subdivide as a five wave structure. It looks like an incomplete impulse. So far it looks like minuette waves (i), (ii) and now (iii) are all complete.
Minuette wave (iv) may not move back down into minuette wave (i) price territory below 2,454.77.
Given the guideline of alternation, minuette wave (iv) may be expected to be a combination, flat or triangle. Within all of these options, a new all time high is possible as part of an expanded flat, running triangle or combination. There is no upper invalidation point for this reason.
Minuette wave (iv) may last about a Fibonacci five or eight days to have good proportion to minuette wave (ii), so that the wave count has the right look. Minuette wave (iv) may find support about the lower edge of the green Elliott channel if it gets down that low.
HOURLY CHART
Click chart to enlarge.
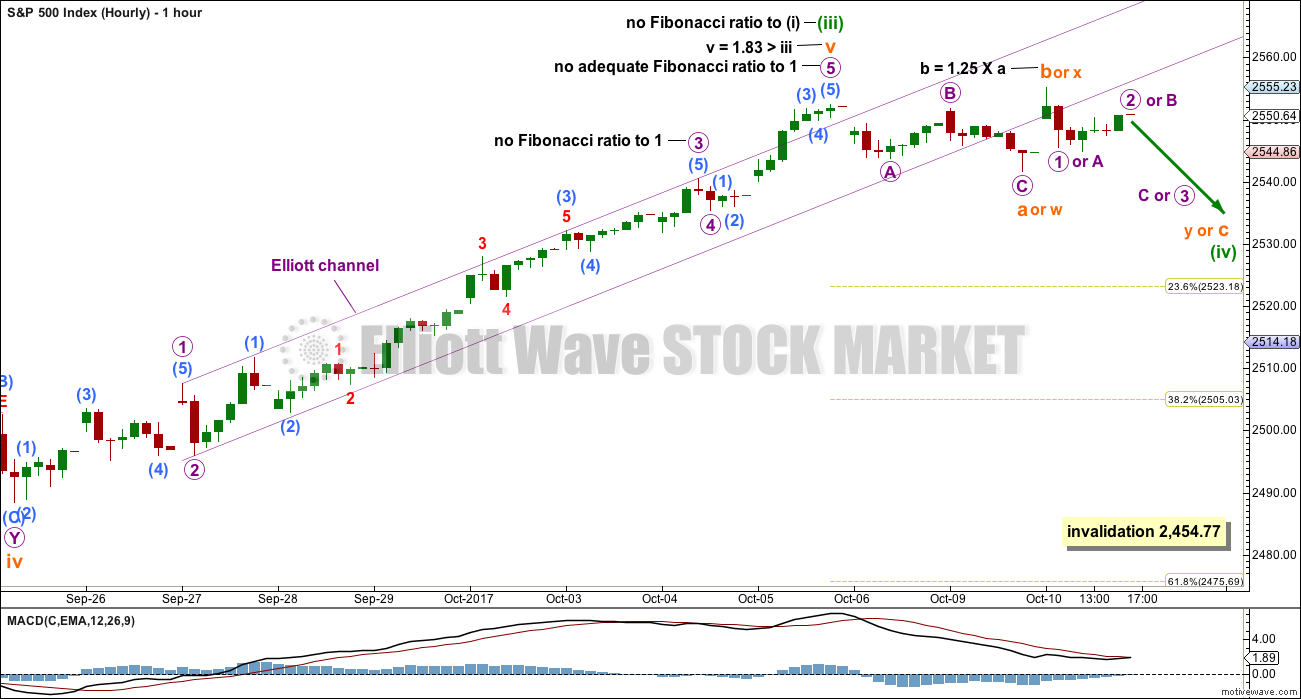
At the daily and hourly chart levels, minuette wave (iii) looks complete and now minuette wave (iv) looks to be underway.
So far minuette wave (iv) has lasted only three sessions. If it completes in a Fibonacci five or eight sessions, it may now continue for another two or five sessions.
Minuette wave (iv) may still be any one of an expanded flat, combination or running triangle. The number of possible structures is now narrowed but not enough for any confidence in how price may move next within this consolidation.
If minuette wave (iv) is the most common expanded flat correction, then a reasonable target for subminuette wave c to end would be about 2,538 where subminuette wave c would reach 1.618 the length of subminuette wave a.
If minuette wave (iv) is the next most common combination, then subminuette wave y must be a flat correction or a triangle. If it were to be a triangle, then the whole structure would look the same as a sole triangle for minuette wave (iv), so only a flat correction may be considered. If subminuette wave y is a flat correction, then within it another new all time high may be seen tomorrow for micro wave B. Thereafter, micro wave C may end below the end of micro wave A and about the same level as subminuette wave w at 2,541.60.
If minuette wave (iv) is a triangle, then it may last another five sessions with choppy overlapping movement in an ever decreasing range.
While it is just possible to label minuette wave (iv) over at the low labelled subminuette wave a or w, it would be too brief for good proportion at the daily chart level. This idea would only be considered if price shows us it is likely by moving very strongly higher with support from volume and momentum.
It looks like minuette wave (iv) may be very shallow.
TECHNICAL ANALYSIS
WEEKLY CHART
Click chart to enlarge. Chart courtesy of StockCharts.com.
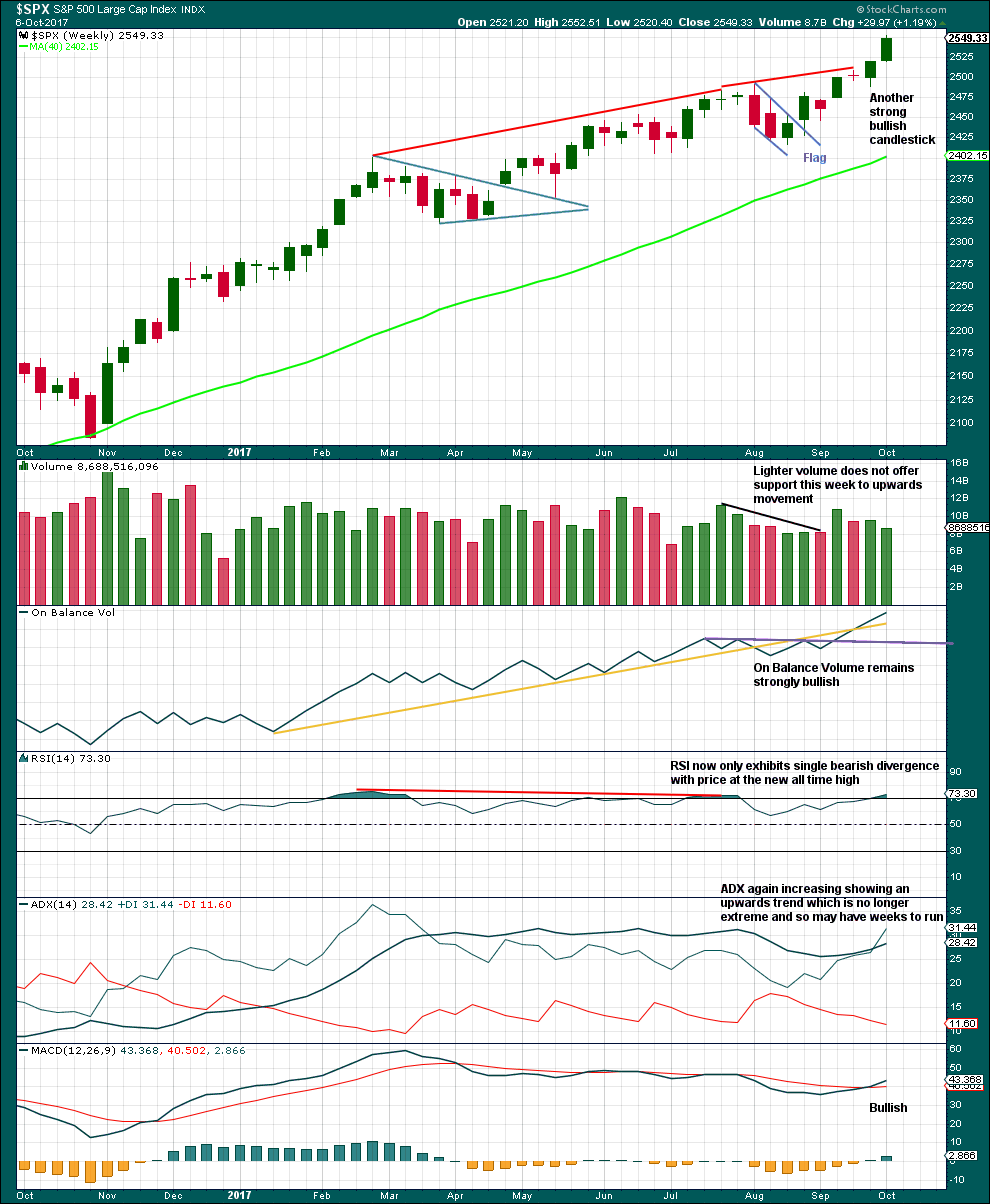
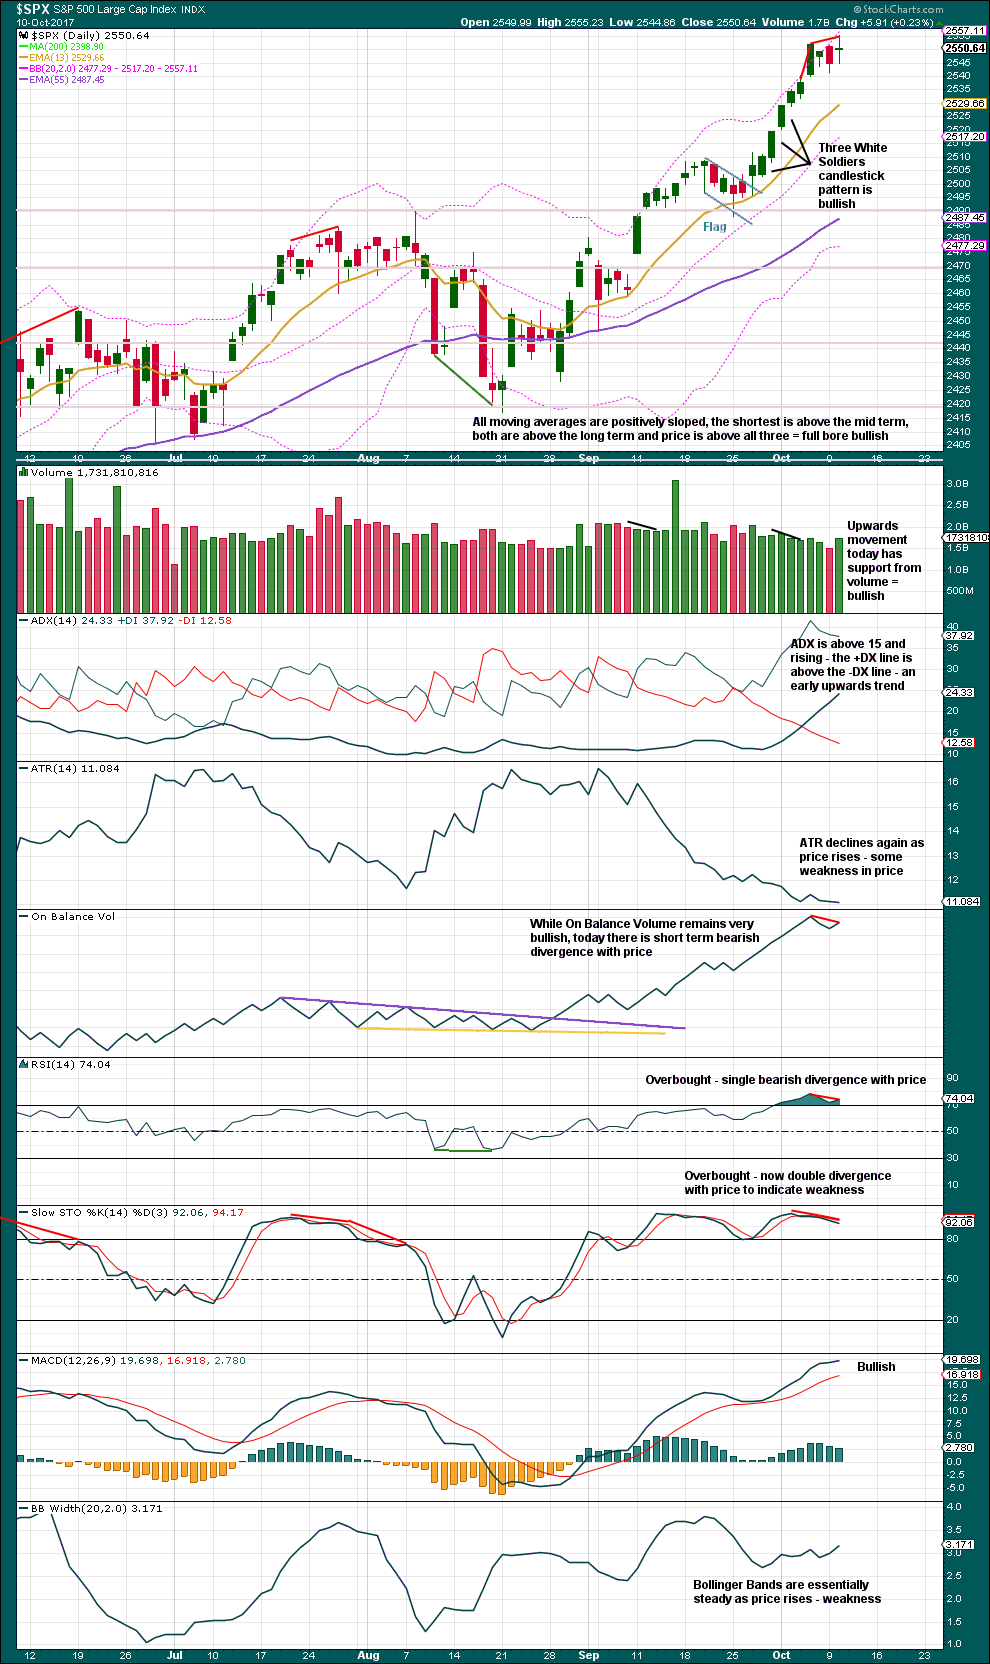
This chart remains very bullish, but with RSI now overbought for a little while the upwards trend may see a pullback soon to relive this overbought condition.
ADX is now again fully bullish at the weekly chart level as the black ADX line returns to below the directional lines.
The decline in volume for the last completed week is slightly bearish, but this bull run has done this before and yet price has continued higher. On its own this will not be taken as a sign that a pullback or consolidation must begin here. The bull run could continue yet for weeks.
DAILY CHART
Click chart to enlarge. Chart courtesy of StockCharts.com.
The short term volume profile remains bullish, but today there is now bearish divergence between price and RSI, and double bearish divergence with price and Stochastics. This offers some reasonable support to the Elliott wave count.
VOLATILITY – INVERTED VIX CHART
Click chart to enlarge. Chart courtesy of StockCharts.com.
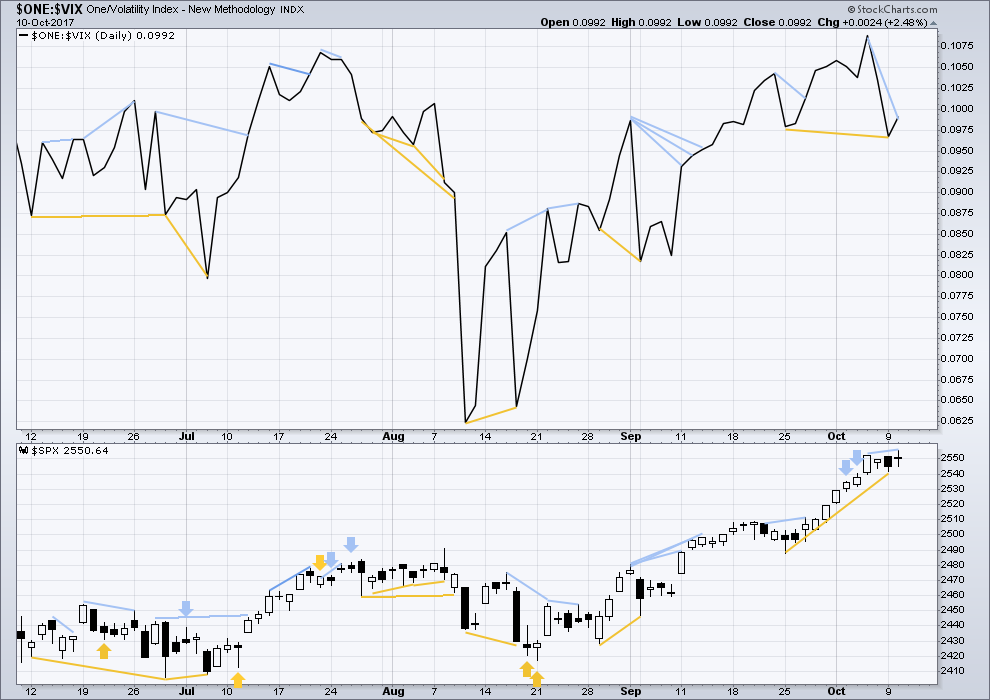
Normally, volatility should decline as price moves higher and increase as price moves lower. This means that normally inverted VIX should move in the same direction as price.
There is bearish divergence today between price and inverted VIX. The new all time high for price does not come with a normal corresponding decline in market volatility; the rise in price is weak.
BREADTH – AD LINE
Click chart to enlarge. Chart courtesy of StockCharts.com.
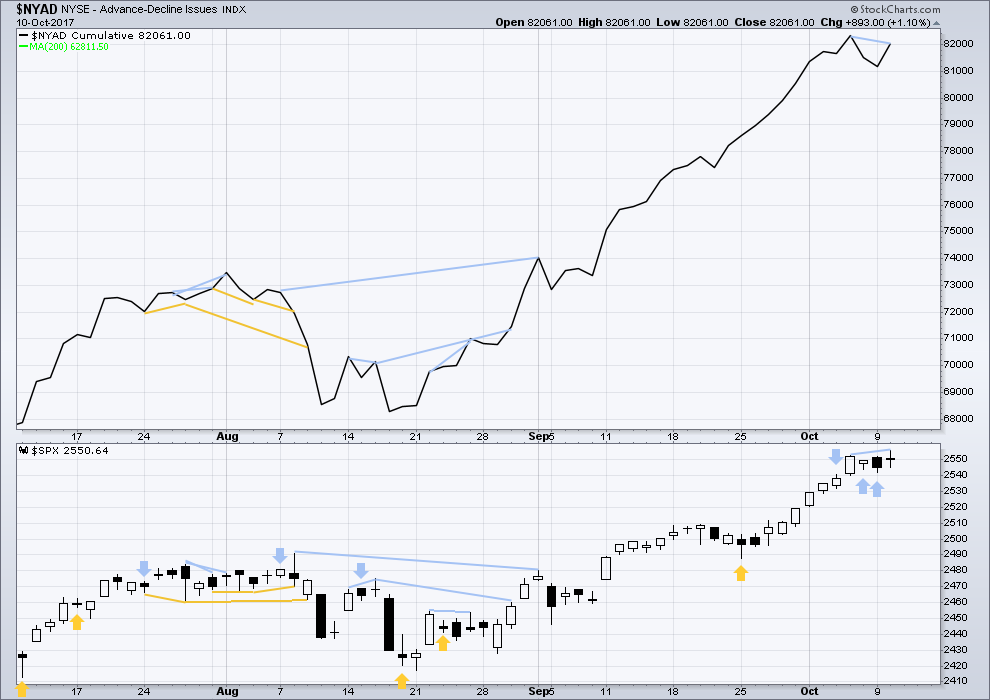
With the last all time high for price, the AD line also made a new all time high. Up to the last high for price there was support from rising market breadth.
There is normally 4-6 months divergence between price and market breadth prior to a full fledged bear market. This has been so for all major bear markets within the last 90 odd years. With no divergence yet at this point, any decline in price should be expected to be a pullback within an ongoing bull market and not necessarily the start of a bear market.
While price has made a new all time high today, the AD line has failed to make a corresponding new high. The rise in price today does not have support from rising market breadth, so the divergence is bearish.
Small, mid and large caps have all made new all time highs last week. The rise in price is supported in all sectors of the market.
Go with the trend. Manage risk.
DOW THEORY
All the indices are making new all time highs. The continuation of the bull market is confirmed.
The following lows need to be exceeded for Dow Theory to confirm the end of the bull market and a change to a bear market:
DJIA: 17,883.56.
DJT: 7,029.41.
S&P500: 2,083.79.
Nasdaq: 5,034.41.
Charts showing each prior major swing low used for Dow Theory are here.
Published @ 10:27 p.m. EST.
StockCharts data is now out and looks to be finalised, writing up the S&P analysis now.
And I’m going to now have to label minuette (iv) as over despite the problem of proportion.
The AD line has made a new ATH today. Weaker divergence now with price and RSI and no divergence with price and On Balance Volume.
Support today from volume and another longer lower candlestick wick. This looks pretty bullish.
Quite a serious “pop” today in XIV and SVXY. I managed to get in at the breakout. Hoping for a multi-day ride. Stop now just above my entry price. We shall see…
Goodness, it’s quiet in here!
Good morning everybody. Here’s your updated hourly chart for the session just before NY closes.
Minuette (iv) now looks very much like a combination so that’s how I’ll label it now. The target would see subminuette y end very close to subminuette w, giving the whole structure a sideways movement.
I still don’t want to label it over at the low of subminuette w, it would still be too brief and so disproportionate to minuette wave (ii).
I don’t think I have ever seen such a quiet forum!
Patiently eyeing puts on SVXY. I think an upper B band penetration should do it this time although that has in the past been less reliable. The Jan 2018 97.5 put would be a good buy under 10.00
SVXY isn’t looking as bullish as S&P500.
I can see On Balance Volume has failed to make a new high there, so not so bullish. Divergence with RSI still, overbought Stochastics for a reasonable while and exhibiting divergence, declining volume today with rising price, some divergence with RSI….
Watch the OBV trend line. If that’s broken it’s bullish, but if OBV turns down from there it’s bearish. If price moves higher that line could be reached tomorrow.
ADX looks very bullish though. This is the strongest signal it can give, rising from below both directional lines.
Thanks for the bonus! OBV has been a quite reliable indicator of late but I think I will look for multiple indicators of a trend change. The last bearish engulfing candle was a head-fake. What service!!! 🙂 🙂 🙂
Good luck everyone!