
A breach of the small channel indicated the alternate hourly Elliott wave count should be used. Thereafter, downwards movement was expected. The candlestick has closed red today.
Summary: A pullback or consolidation has most likely begun. It may be shallow, choppy, overlapping, and last only a few days. For the very short term, a little upwards movement may unfold tomorrow before another downwards day.
The trend remains up. Go with the trend. Corrections are an opportunity to join the trend. Only the most experienced and nimble of traders may consider trading a smaller correction short. Most traders should wait until the correction is complete before entering long.
Always trade with stops and invest only 1-5% of equity on any one trade.
Last monthly and weekly charts are here. Last historic analysis video is here.
MAIN ELLIOTT WAVE COUNT
WEEKLY CHART
Click chart to enlarge.
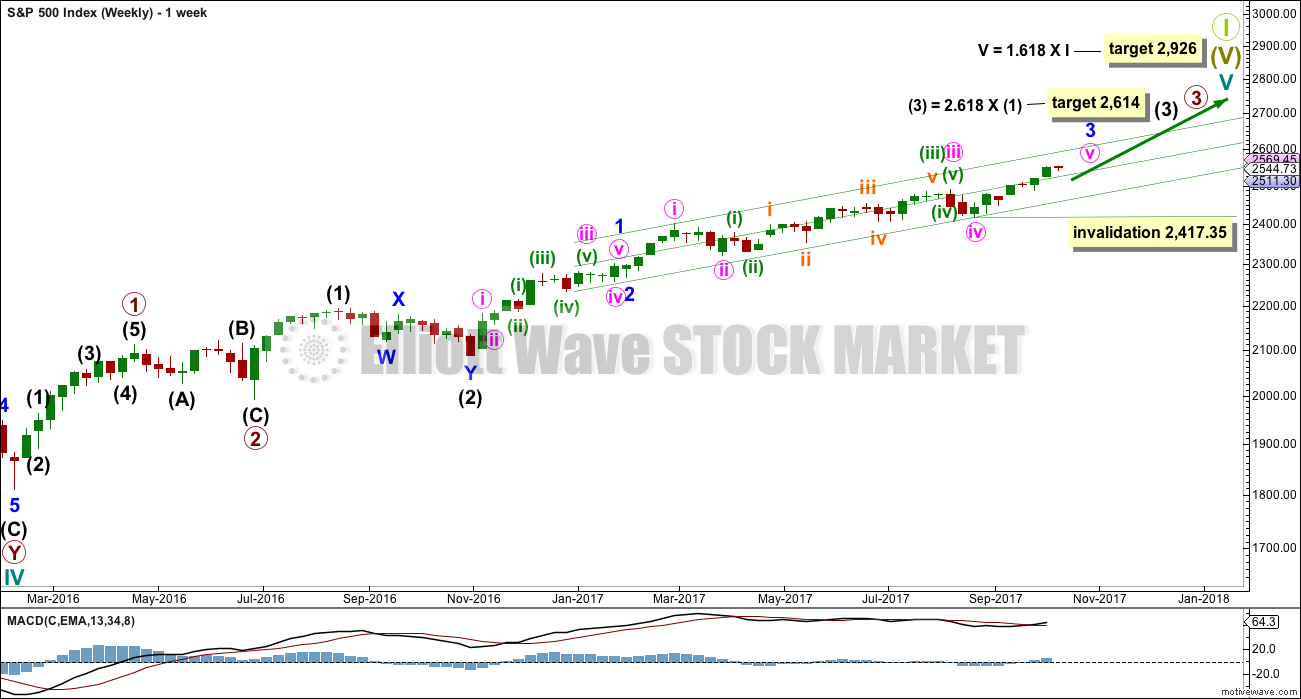
This wave count has strong support from another bullish signal from On Balance Volume at the weekly chart level. While classic analysis is still very bullish for the short term, there will be corrections along the way up. Indicators are extreme and there is considerable risk to the downside still.
As a Grand Super Cycle wave comes to an end, weakness may develop and persist for very long periods of time (up to three years is warned as possible by Lowry’s for the end of a bull market), so weakness in volume may be viewed in that larger context.
Within minute wave v, no second wave correction may move beyond the start of its first wave below 2,417.35.
The next reasonable correction should be for intermediate wave (4). When it arrives, it should last over two months in duration, and it may find support about the lower edge of this best fit channel. The correction may be relatively shallow, a choppy overlapping consolidation, at the weekly chart level.
DAILY CHART
Click chart to enlarge.
To see details of the whole of primary wave 3 so far see the analysis here.
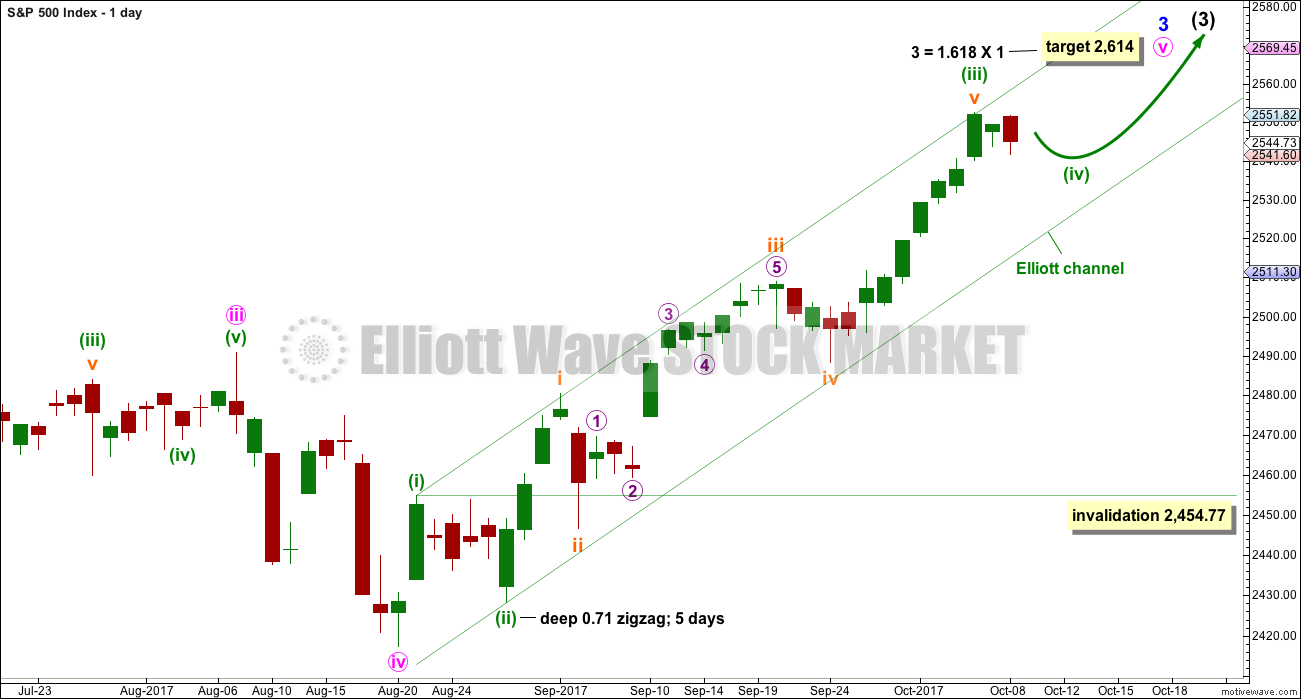
Minute wave v to complete minor wave 3 must subdivide as a five wave structure. It looks like an incomplete impulse. So far it looks like minuette waves (i), (ii) and now (iii) are all complete.
Minuette wave (iv) may not move back down into minuette wave (i) price territory below 2,454.77.
Given the guideline of alternation, minuette wave (iv) may be expected to be a combination, flat or triangle. Within all of these options, a new all time high is possible as part of an expanded flat, running triangle or combination. There is no upper invalidation point for this reason.
Minuette wave (iv) may last about a Fibonacci five or eight days to have good proportion to minuette wave (ii), so that the wave count has the right look. Minuette wave (iv) may find support about the lower edge of the green Elliott channel if it gets down that low.
HOURLY CHART
Click chart to enlarge.
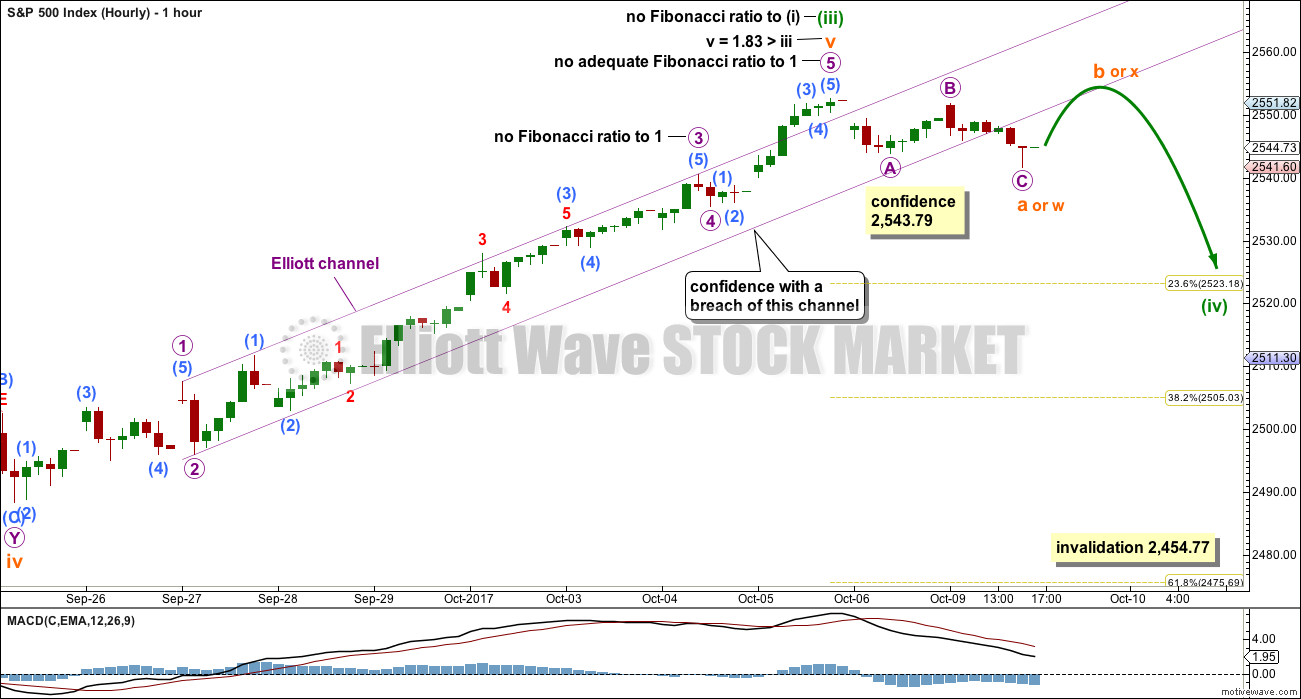
The structure of subminuette wave v and so all of minuette wave (iii) may now be complete.
A small violet channel drawn about subminuette wave v is breached by downwards movement, indicating that subminuette wave v is over and the next wave should be underway.
The next wave should be a consolidation or pullback for minuette wave (iv). Minuette wave (iv) may not move into minuette wave (i) price territory below 2,454.77.
There are more than 23 possible corrective structures that minuette wave (iv) may be. On the five minute chart, downwards movement from the last all time high subdivides neatly as a zigzag. This may be subminuette wave a or w of a flat, triangle or combination for minuette wave (iv).
If minuette wave (iv) unfolds as a flat correction, then within it subminuette wave b must retrace a minimum 0.9 length of subminuette wave a at 2,551.42. If minuette wave (iv) is the most common type of flat correction, an expanded flat, then subminuette wave b must be a minimum 1.05 length of subminuette wave a at 2,553.06. The most common length of subminuette wave b within a flat correction would be from 1 to 1.38 the length of subminuette wave a giving a range from 2,552.51 to 2,556.66.
If minuette wave (iv) unfolds as a combination, then the first structure in the double may be complete as a zigzag labelled subminuette wave w. Subminuette wave x should be deep and may make a new all time high. Thereafter, subminuette wave y would most likely be a flat correction.
If minuette wave (iv) unfolds as a triangle, then subminuette wave b may also make a new all time high as in a running triangle.
Once there is some structure within minuette wave (iv) to analyse, then alternate wave counts will be used to cover the various scenarios of how it may unfold. For corrections the Elliott wave focus should be on identifying when they may be complete, not on trying to identify the small sub-waves within them because there is too much variation possible.
Minuette wave (ii) was a deep zigzag lasting five days. Expect minuette wave (iv) to exhibit alternation and to be shallow, and most likely a flat, combination or triangle. It may last a total Fibonacci three, five or eight days.
TECHNICAL ANALYSIS
WEEKLY CHART
Click chart to enlarge. Chart courtesy of StockCharts.com.
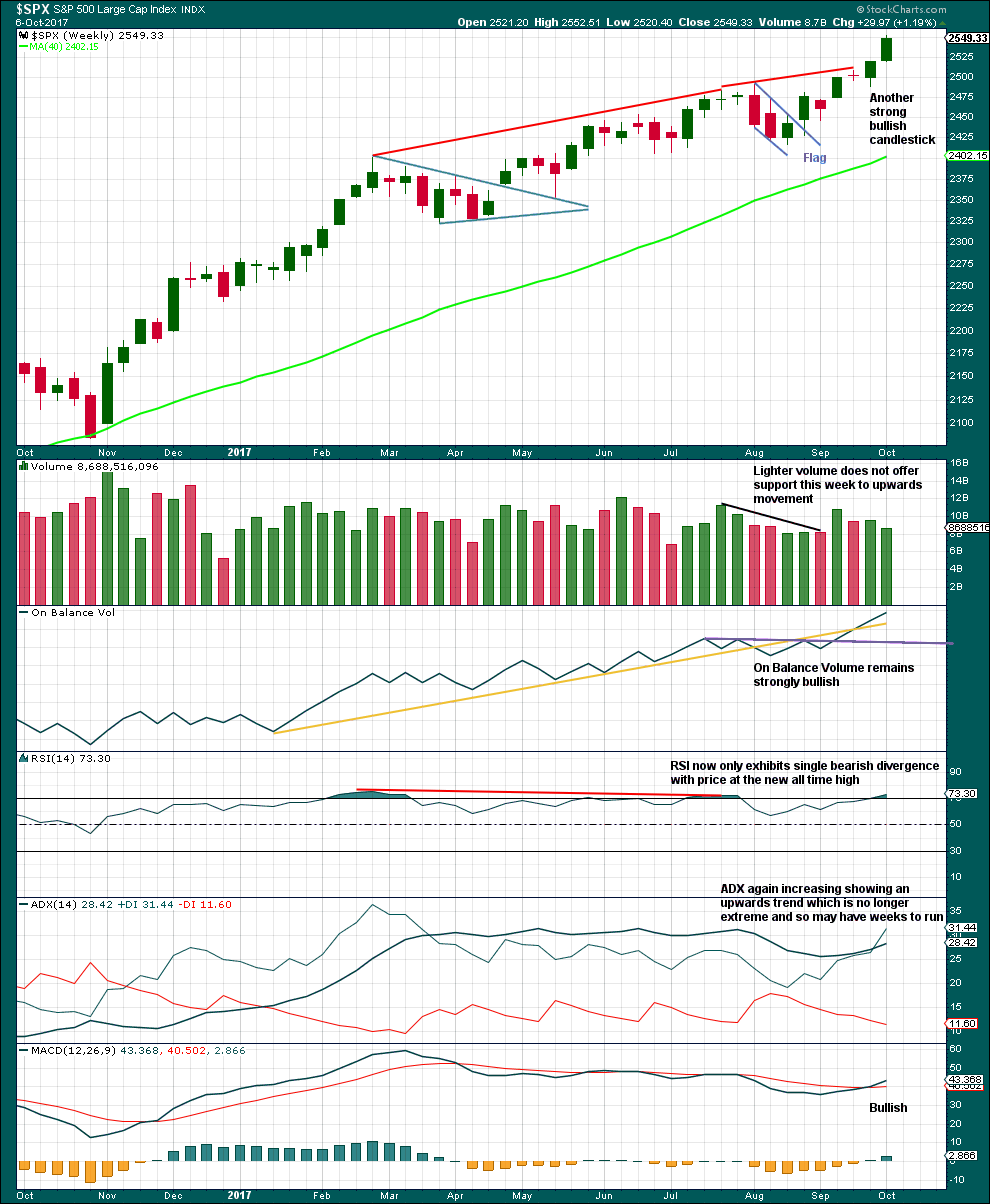
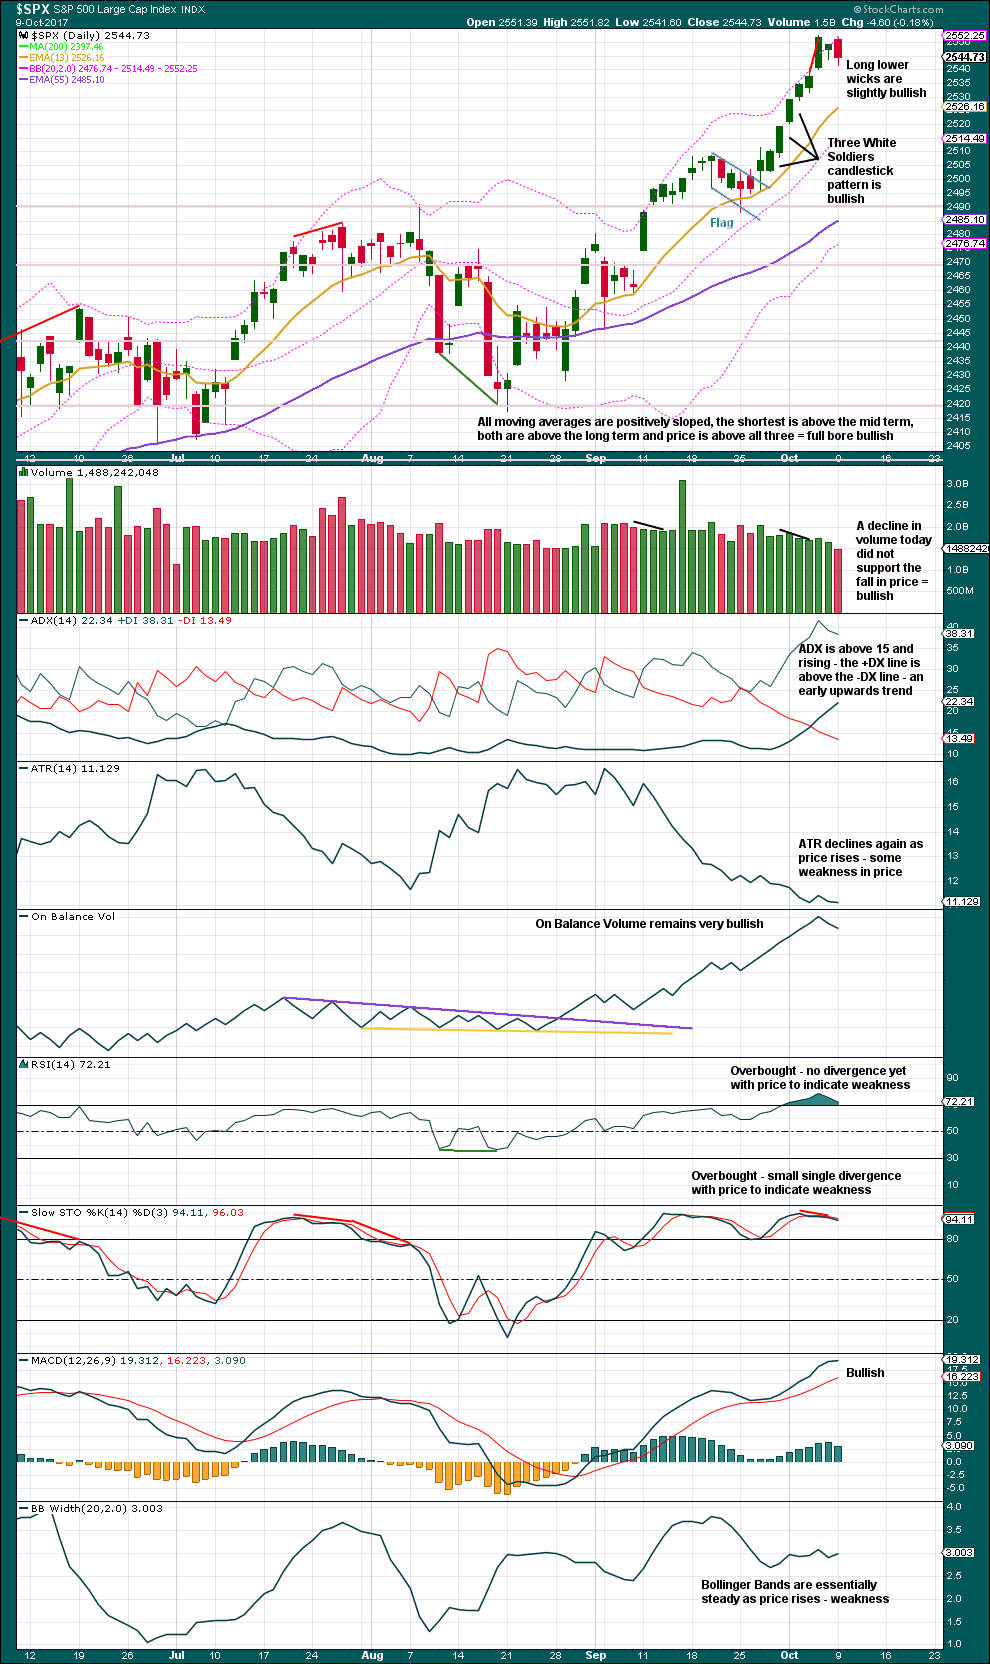
This chart remains very bullish, but with RSI now overbought for a little while the upwards trend may see a pullback soon to relive this overbought condition.
ADX is now again fully bullish at the weekly chart level as the black ADX line returns to below the directional lines.
The decline in volume for the last completed week is slightly bearish, but this bull run has done this before and yet price has continued higher. On its own this will not be taken as a sign that a pullback or consolidation must begin here. The bull run could continue yet for weeks.
DAILY CHART
Click chart to enlarge. Chart courtesy of StockCharts.com.
The short term volume profile remains bullish. The last two sessions have a balance of volume downwards and both exhibit declining volume. The market is falling of its own weight.
RSI still does not exhibit divergence with price; no weakness here is indicated. There is small weak single divergence with price and Stochastics. With a red candlestick, today it looks like a small pullback may have begun to relieve overbought conditions.
The strongest signal ADX can give is with the ADX line rising from a low level and below both directional lines. That has been the case here for ADX. With ADX at the weekly chart level no longer extreme, there is room for this bull run to continue for some time.
This chart is extremely bullish. The trend is up. While indicators are extreme and overstretched now, they can remain so for a while when this market has a strong bull move.
Always manage risk. It is the most important aspect of successful trading.
VOLATILITY – INVERTED VIX CHART
Click chart to enlarge. Chart courtesy of StockCharts.com.
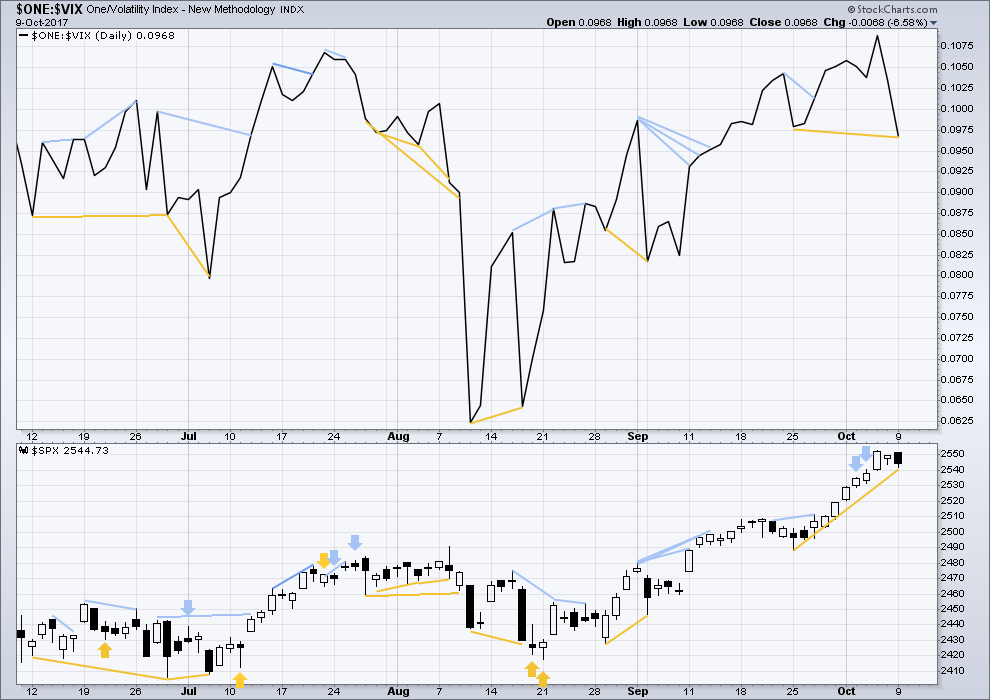
Normally, volatility should decline as price moves higher and increase as price moves lower. This means that normally inverted VIX should move in the same direction as price.
There is hidden bullish divergence today between price and inverted VIX. Downwards movement from price today did not come with a normal corresponding increase in volatility to the same point achieved several sessions ago. This indicates weakness in price. This divergence supports the short term expectation of a bounce for the hourly chart.
BREADTH – AD LINE
Click chart to enlarge. Chart courtesy of StockCharts.com.
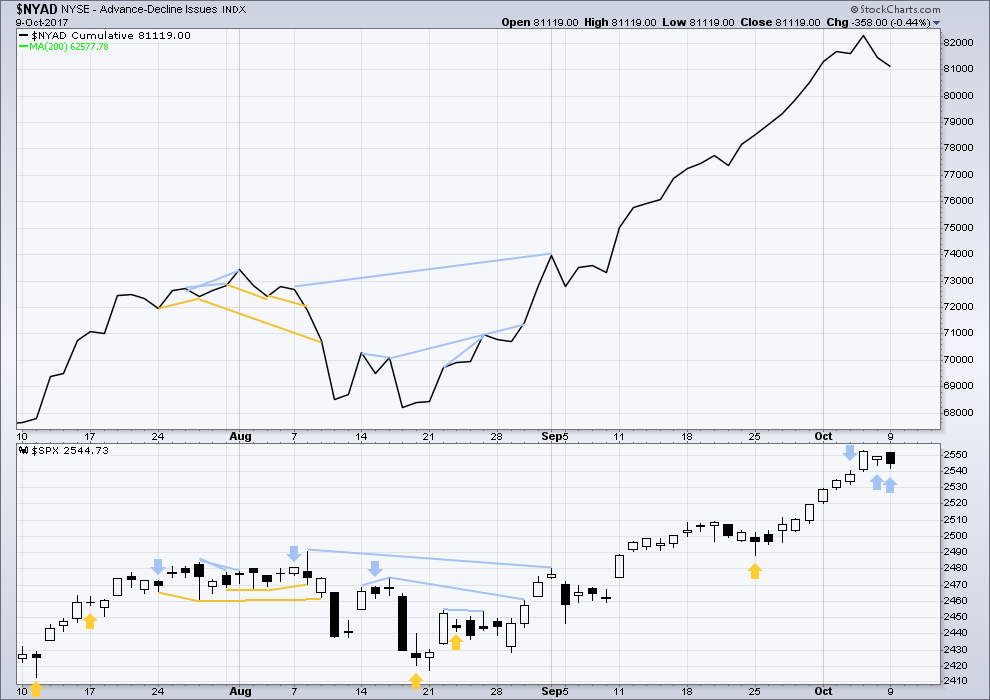
With the last all time high for price, the AD line also made a new all time high. Up to the last high for price there was support from rising market breadth.
There is normally 4-6 months divergence between price and market breadth prior to a full fledged bear market. This has been so for all major bear markets within the last 90 odd years. With no divergence yet at this point, any decline in price should be expected to be a pullback within an ongoing bull market and not necessarily the start of a bear market.
The AD line has made another new low below the low of three sessions ago, but price has not. As the AD line can be a leading indicator this divergence will be interpreted as bearish. This offers some overall support to the idea of a pullback or consolidation beginning here.
Small, mid and large caps have all made new all time highs last week. The rise in price is supported in all sectors of the market.
Go with the trend. Manage risk.
DOW THEORY
All the indices are making new all time highs. The continuation of the bull market is confirmed.
The following lows need to be exceeded for Dow Theory to confirm the end of the bull market and a change to a bear market:
DJIA: 17,883.56.
DJT: 7,029.41.
S&P500: 2,083.79.
Nasdaq: 5,034.41.
Charts showing each prior major swing low used for Dow Theory are here.
Published @ 09:45 p.m. EST.
Well, so far so good. But let’s see if it continues to go down from here…
It would appear that today’s candlestick is going to show some weakness because the gains of the first hour and gap up have been completely reversed. The gap is closed so it should be a pattern gap. Price is consolidating, which is what we expected.
But is it over?
I can’t yet see a complete structure, and for better proportion it should continue for another couple of days at least. But then…. the S&P just doesn’t always have nice proportions which does make it a rather difficult beasty to analyse.
And I still cannot tell you with any confidence which structure minuette (iv) may be taking. So far it could still be an expanded flat (most common so most likely), combination (still fairly common so still fairly likely) or triangle (less common than the first two, but still a reasonably common structure).
I can’t even say with a reasonable level of confidence that the EW structure isn’t complete because it could be over at the low labelled subminuette a or w 🙁
And the only reason I’m not labelling it as over is proportion. And a judgement based upon experience.
And so… how to trade all this uncertainty?
Either open a long position with a stop calculated using money management and allowing a little room for movement OR just below the last small swing low. Hold on, be prepared for a loss but if the correction is over you’ll have a great entry point.
OR
Open a hedge. Stop for the long just below the last swing low, stop for the short just above today’s high. Allow a little room for movement. Total potential loss should be only 1-5% of equity, with less experienced members risking only 1-3% of equity.
VIX flying another bull flag….shape of things to come.
I cannot believe I got in once gain below 10.00…!!!!
The markets are turning together. Gold up. Oil up. Dollar down. Yen up. Euro up. There’s only one asset class that hasn’t really yet joined the party in a significant way! The dollar rally the last few weeks failed to break bearish symmetry, which adds to my confidence that this turn is real, and all these asset classes will run at least a little bit, rather than just a synchronous head fake.
RUT may be finally rolling over after it’s 34-ish (nice number) day run up. I like the risk/reward profile here for a multi-day short, stopping at or near the ATH. On the other side, FXY has signals galore of a bottom.
While it appears that SPX has done an abc-X-a, with the b in progress and a sharp c down looming…it is possible that the 4 is over with the abc, and there is a 1 up this morning, a 2 down, and price is launching a 3. An alternate scenario. Learning from Lara to ALWAYS think about the most likely significant alternate, at all time frames.
Alternate idea is that expanded flat B wave is not complete and we are in C wave up to another new ATH to give 3 wave structure after first 3 wave down.
Yea…what did she say, 23 possible combinations? I hate corrections!!
Yep. Me too.
Gidyap Vol!
Hey Chris, you still nervous about us looking too slick by half? lol! 😀
Lol, having fun
Nasdaq printing a bearish engulfing candle today so it will be interesting to see if it leads a turn here. I am certainly not going to jump to any conclusions as we have certainly seen the remarkably resilience of this market in negating bearish signals, but along with VIX divergence we could be ready for a pullback of some kind. The question is…how big??!!
Morgan Stanley now coming out about stock valuations…
http://www.marketwatch.com/story/stock-record-ride-has-reached-epic-proportions-morgan-stanley-says-2017-10-10
A healthy correction might be good for the long term bull case but market probably has its own agenda.
The daily chart is now looking very reminescent of the period July 27- Aug 8. EW doesn’t call for such a large pullback as followed then, though. I have a cluster of decision points in SPX at the 2527.5 to 2530 area, including a 38% retrace fibo and a projection of the size of the corresponding ii. However, I will not be surprised by a significantly deeper pullback here, to the 62% around 2414, over the next week+. At the same time, I’ll take any break back up to the upside quite seriously, as a signal of major bull renewal.
I mostly agree. I do think however a break of 2470 would be very bearish…
Kevin,
Is that figure of 2414 a typo? I am guessing you meant 2514 and are measuring the move from 2490 to 2550 or thereabouts. As always, thanks for your comments.
Thanks Ron, yes, typo, thanks for the correction. Definitely meant 2514!! I agree with Verne completely, anything getting down below 2500 and a fresh take on the situation is needed.
Thanks for the sharp eye Rodney! 🙂
SPX price clearly following Lara’s most likely call of an expanded flat, with a high exactly where price turned this morning. Bingo!! Too bad EW is just “gooblygook”, as a few of my trading friends claim. Lol!!!
Interesting divergences unfolding with price and volatility…
Exiting XLU at full profit objective
Sweet! Why can’t I do that?
RR_001 October 10, 2017 at 8:25 am
Verne,
If lara is seeing 3-4 months of bullishness given the technicals, do you not agree perhaps a better time for buying put options will be sometime mid to late december 2017? I just don’t want time decay to work too much against my positions. Also, some of the chinese momo stocks are going insane as well. Thoughts?
I re-posted this from the last thread as I did not see it until this morning and you do have a point. In fact I am expecting more upwards movement short term which is why I am using such a generous stop. The ultimate rationale for the trade do is the extreme valuations and my expectation of some kind of price mean reversion. I like the the risk reward ratio. Depending on how price behaves going forward, I may also opt to lower cost basis if we begin to see signs of an imminent reversal. There is definitely some risk in that position considering the general bullishness we are seeing, even so, some kind of correction soon is very likely.
I added UVXY at 18.40 on top of the VIX position; aggressive but I’m very very confident at this point. Adding SQQQ as well.
He! He! I am eyeing SVXY on the bearish side with the same intentions.
Bought back VIX at the morning’s low…
I took a tiny bite of VXX. Since this 4 isn’t expected to go all that deep, I didn’t want to overextend, given the horrendous time-value decay of VXX and UVXY due to contango of the VIX futures market that their price is based on.
Tagged out at 19, reloading now. I agree the decay is ridiculous, however, the math gets pretty silly in its favor in backwardation, which will be inevitable sometime soon.
Also, I enjoy day trading it around my core VIX position. It’s one of the easiest instruments to trade on both sides.
I’m more than a little suspicious that XIV and SVXY benefit from inverse-contango, implying that there’s a huge statistical edge on the long side of these issues. Compare the price of these instruments across time at various points where the value of the VIX is the same. You’ll see a monotonically increasing price! One could argue, if true, that these instruments are virtually, in the long haul, guaranteed winners for any trade; they will ALWAYS end up higher, at some point. As insane as that may sound, the fact is, the XIV price graph 100% supports that hypothesis throughout it’s life, to date. Thoughts?
They do grab about 4%ish from inverse-contango, however both products listed in 2011, have only been in backwardation twice, and both will go to near zero, or be de-listed once we see some real VOL.
Yep. You can take it to the bank….or reverse splits
That has been true for the duration of this bull run, as has been the case for simply being long equities. It will be interesting to see if roles reverse during the bear market and these instruments end up being the one to see multiple reverse splits. They have not been around long enough to know how they behave in a bear market.
I’m expecting 4-6 months absolute minimum, and 2-3 years as entirely possible.
Of this bull market that is.
With corrections along the way, two of them big and time consuming.
yo,,,, woo hoo