
Upwards movement was expected but price has moved sideways for Friday to complete an inside day.
The short term Elliott wave count is slightly adjusted at the hourly chart level today.
Summary: Assume the trend remains up while price remains within the violet channel on the hourly charts. The new target is now at 2,586 to 2,589.
A breach of that channel and then a new low below 2,543.79 now would indicate a pullback or consolidation has begun. It may be shallow and last only a few days.
The trend remains up. Go with the trend. Corrections are an opportunity to join the trend. Only the most experienced and nimble of traders may consider trading a smaller correction short. Most traders should wait until the correction is complete before entering long.
Always trade with stops and invest only 1-5% of equity on any one trade.
Last monthly and weekly charts are here. Last historic analysis video is here.
MAIN ELLIOTT WAVE COUNT
WEEKLY CHART
Click chart to enlarge.
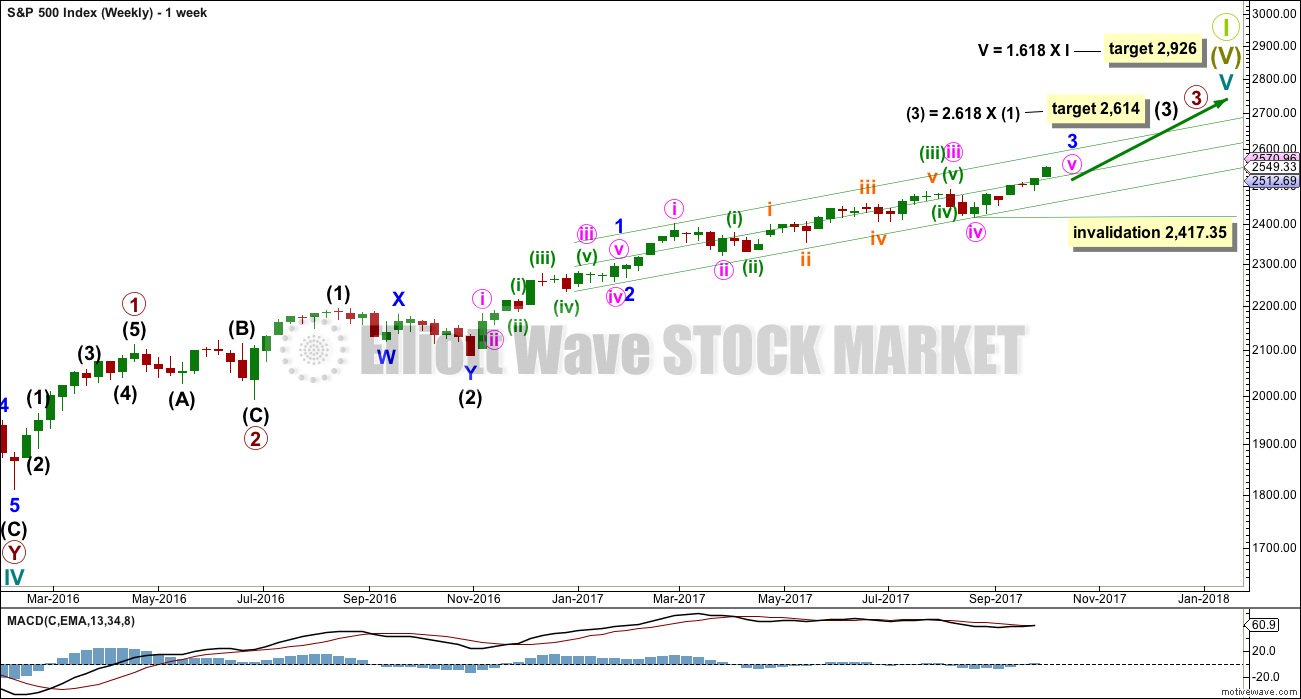
This wave count has strong support from another bullish signal from On Balance Volume at the weekly chart level. While classic analysis is still very bullish for the short term, there will be corrections along the way up. Indicators are extreme and there is considerable risk to the downside still.
As a Grand Super Cycle wave comes to an end, weakness may develop and persist for very long periods of time (up to three years is warned as possible by Lowry’s for the end of a bull market), so weakness in volume may be viewed in that larger context.
Within minute wave v, no second wave correction may move beyond the start of its first wave below 2,417.35.
The next reasonable correction should be for intermediate wave (4). When it arrives, it should last over two months in duration, and it may find support about the lower edge of this best fit channel. The correction may be relatively shallow, a choppy overlapping consolidation, at the weekly chart level.
DAILY CHART

Click chart to enlarge.
To see details of the whole of primary wave 3 so far see the analysis here.
Minute wave v to complete minor wave 3 must subdivide as a five wave structure. It looks like an incomplete impulse. So far it looks like minuette waves (i) and (ii) are complete with minuette wave (iii) now very close to completion.
When minuette wave (iii) is complete, then minuette wave (iv) may not move back down into minuette wave (i) price territory below 2,454.77.
So far minuette wave (iii) has lasted 27 sessions. If it exhibits a Fibonacci duration, then it may continue now for another 8 sessions to total a Fibonacci 34.
HOURLY CHART
Click chart to enlarge.
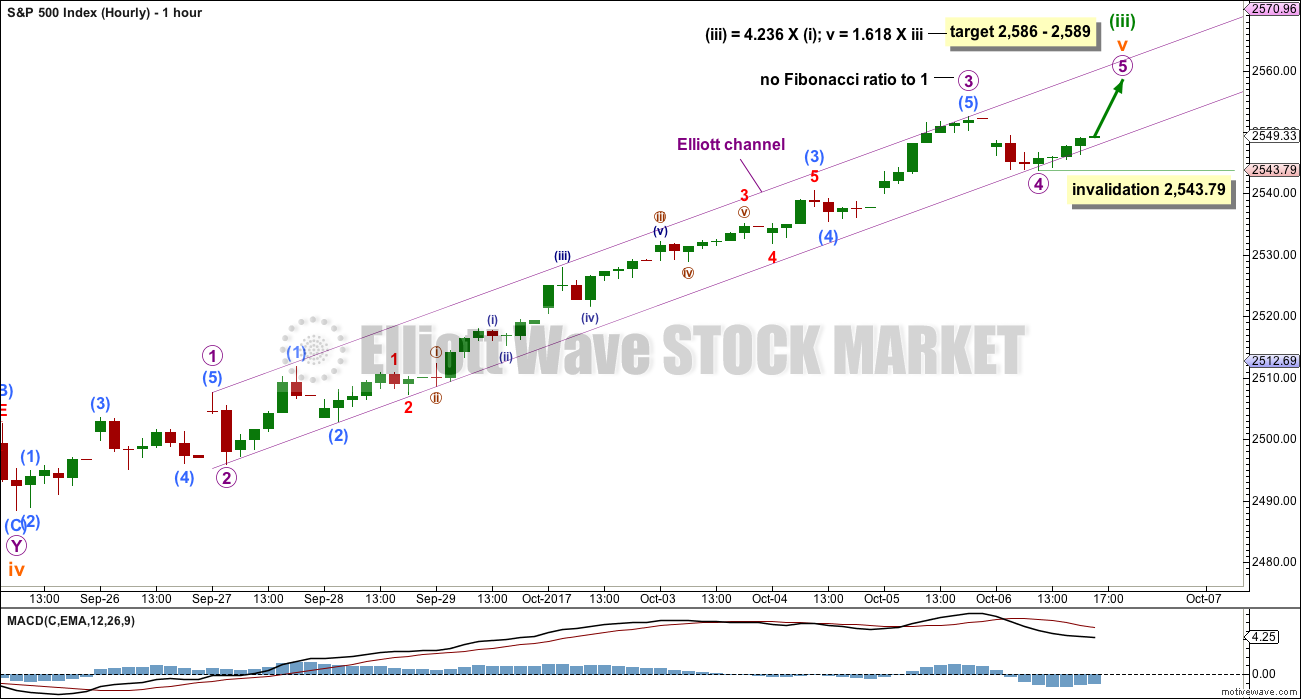
At 2,586 minuette wave (iii) would reach 4.236 the length of minuette wave (i). At 2,589 subminuette wave v would reach 1.618 the length of subminuette wave iii. There would be no Fibonacci ratio at micro degree within this target zone with the new labelling.
Labelling of subminuette wave v is changed on this hourly chart today. The channel as drawn previously did not work; with this new labelling, it looks more correct. There is still no Fibonacci ratio between micro waves 3 and 1. The end of micro wave 3 corresponds with the strongest momentum as evidenced by MACD.
This three point target zone should still have a reasonable probability.
Within micro wave 5, sub-micro wave (2) may not move beyond the start of sub-micro wave (1) below 2,543.79.
ALTERNATE HOURLY CHART
Click chart to enlarge.
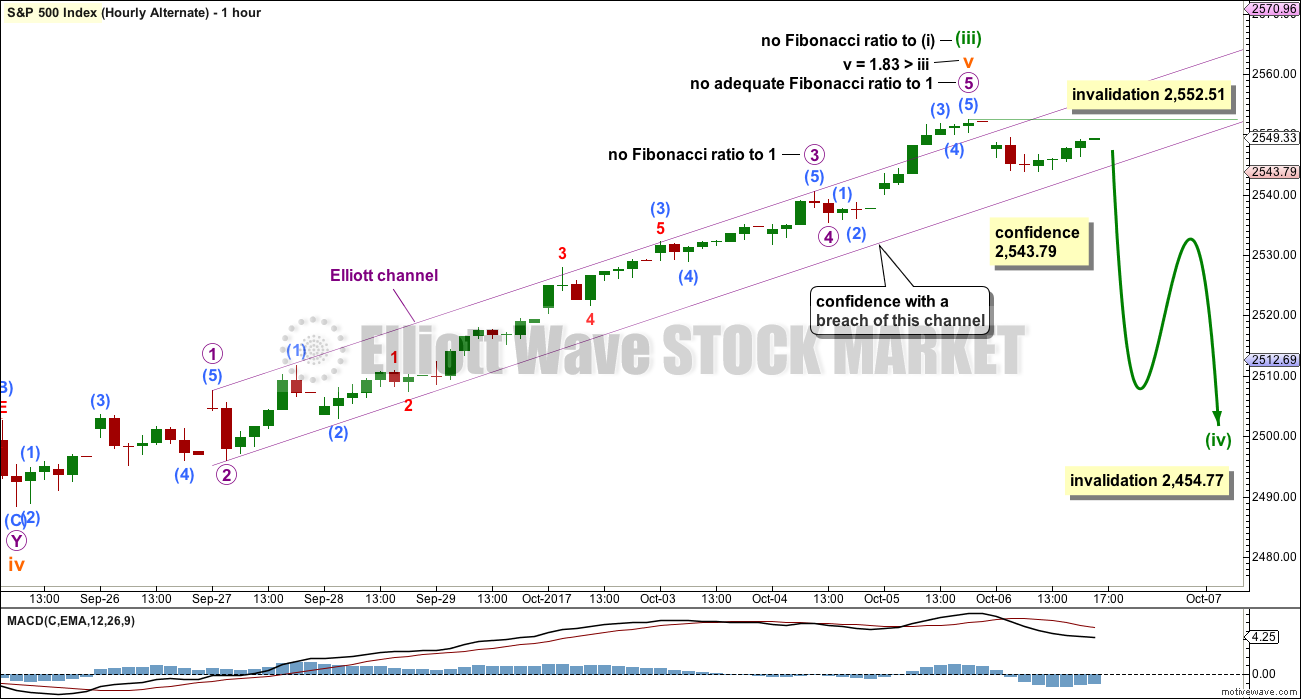
This alternate remains the same as published in yesterday’s analysis.
The structure of subminuette wave v and so all of minuette wave (iii) may now be complete.
A small violet channel is drawn about subminuette wave v. When this channel is breached by downwards movement, it shall be indicating that subminuette wave v is over and the next wave should be underway.
The next wave should be a consolidation or pullback for minuette wave (iv). Minuette wave (iv) may not move into minuette wave (i) price territory below 2,454.77.
A new low below 2,543.79 would invalidate the main hourly wave count above and provide some confidence in this alternate wave count.
There are more than 23 possible corrective structures that minuette wave (iv) may be. It should begin with a small five down at the hourly chart level. While that is incomplete, the first small second wave correction within it may not move beyond the start of its first wave above 2,552.51.
Once there is some structure within minuette wave (iv) to analyse, then alternate wave counts will be used to cover the various scenarios of how it may unfold. For corrections the Elliott wave focus should be on identifying when they may be complete, not on trying to identify the small sub-waves within them because there is too much variation possible.
Minuette wave (ii) was a deep zigzag lasting five days. Expect minuette wave (iv) to exhibit alternation and to be shallow, and most likely a flat, combination or triangle. It may last a total Fibonacci three, five or eight days.
TECHNICAL ANALYSIS
WEEKLY CHART
Click chart to enlarge. Chart courtesy of StockCharts.com.
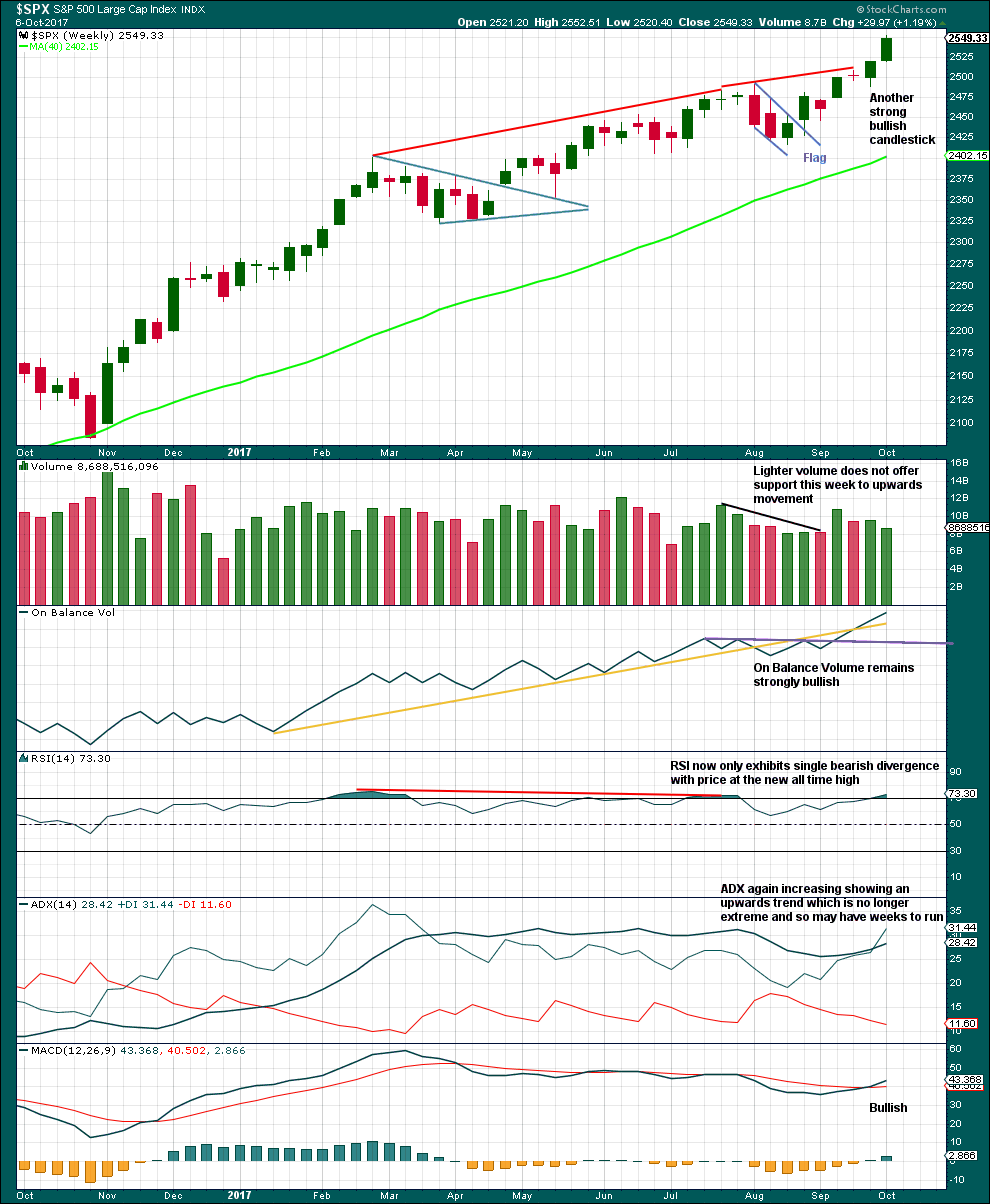
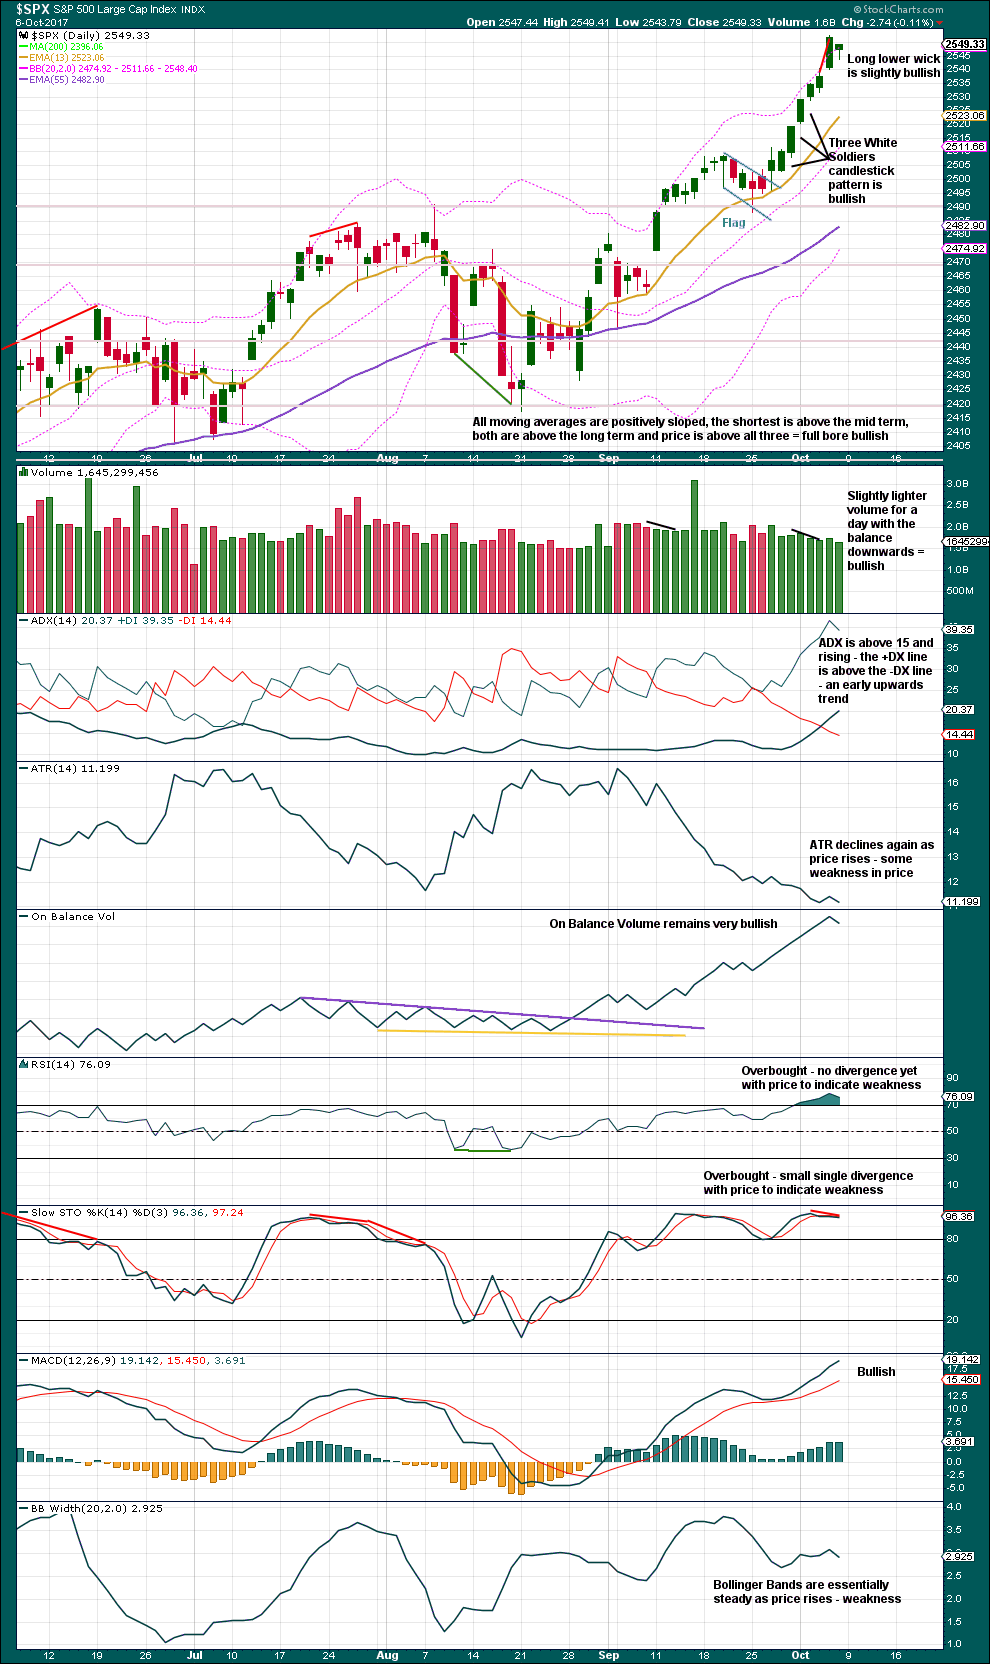
This chart remains very bullish, but with RSI now overbought for a little while the upwards trend may see a pullback soon to relive this overbought condition.
ADX is now again fully bullish at the weekly chart level as the black ADX line returns to below the directional lines.
The decline in volume for the last completed week is slightly bearish, but this bull run has done this before and yet price has continued higher. On its own this will not be taken as a sign that a pullback or consolidation must begin here. The bull run could continue yet for weeks.
DAILY CHART
Click chart to enlarge. Chart courtesy of StockCharts.com.
The short term volume profile remains bullish. With less support for volume on Friday, which had a balance of volume downwards, expect a green daily candlestick to begin the next week. This supports the main hourly Elliott wave count.
RSI still does not exhibit divergence with price; no weakness here is indicated. There is small weak single divergence with price and Stochastics, but this is not enough yet to indicate any real weakness which may lead to an immediate pullback here.
The strongest signal ADX can give is with the ADX line rising from a low level and below both directional lines. That has been the case here for ADX. With ADX at the weekly chart level no longer extreme, there is room for this bull run to continue for some time.
This chart is extremely bullish. The trend is up. While indicators are extreme and overstretched now, they can remain so for a while when this market has a strong bull move.
Always manage risk. It is the most important aspect of successful trading.
VOLATILITY – INVERTED VIX CHART
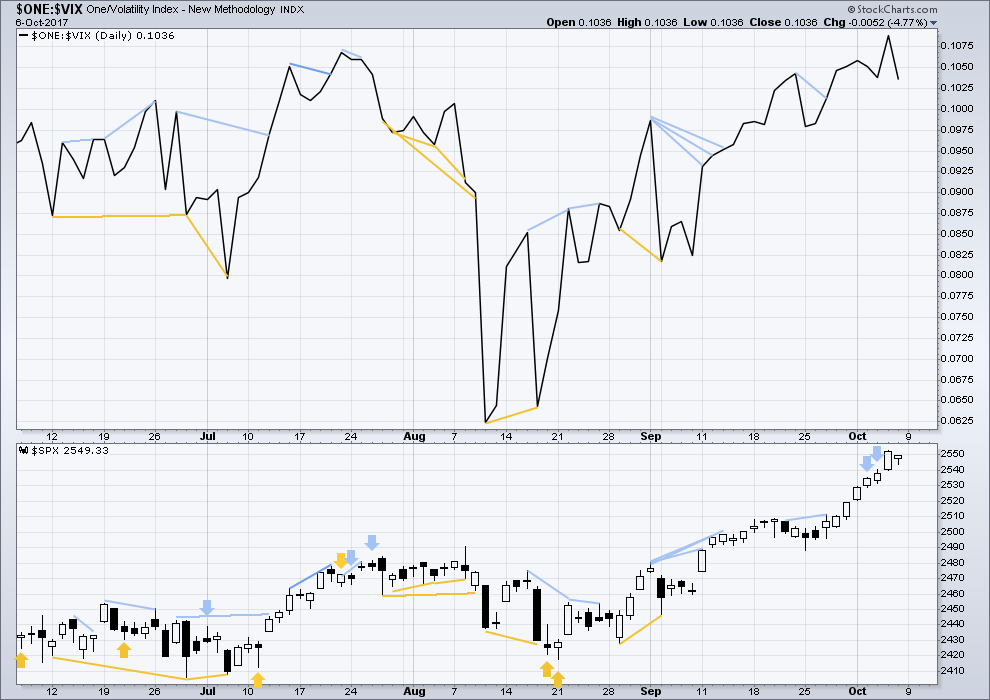
Click chart to enlarge. Chart courtesy of StockCharts.com.
Normally, volatility should decline as price moves higher and increase as price moves lower. This means that normally inverted VIX should move in the same direction as price.
Any short term divergence between lows in price and inverted VIX for Friday may be too weak to note.
BREADTH – AD LINE
Click chart to enlarge. Chart courtesy of StockCharts.com.
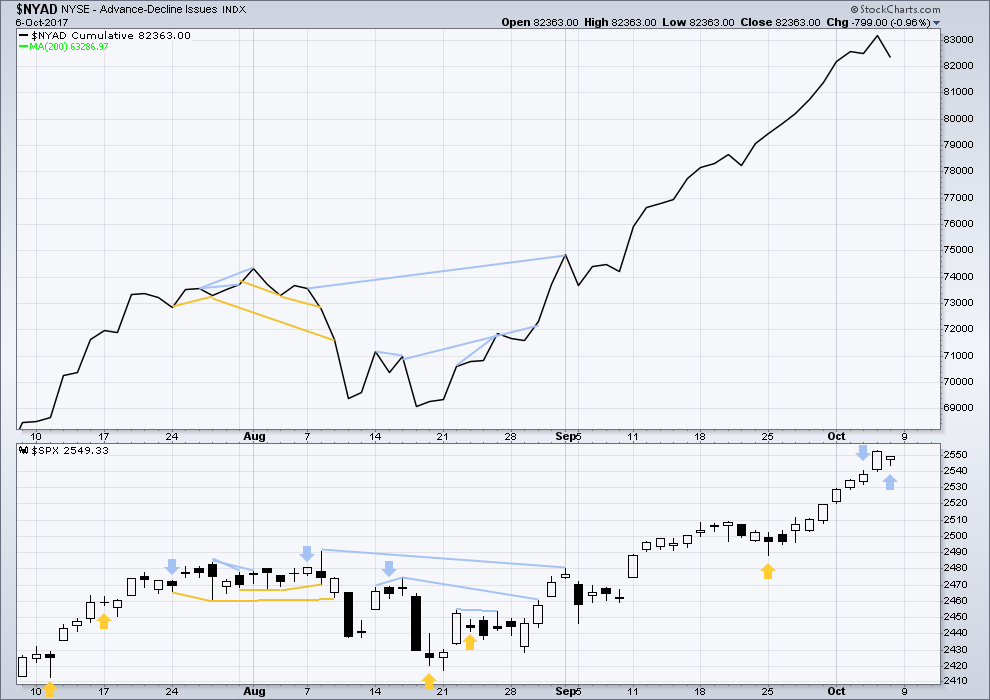
With the last all time high for price, the AD line also made a new all time high. Up to the last high for price there was support from rising market breadth.
There is normally 4-6 months divergence between price and market breadth prior to a full fledged bear market. This has been so for all major bear markets within the last 90 odd years. With no divergence yet at this point, any decline in price should be expected to be a pullback within an ongoing bull market and not necessarily the start of a bear market.
The conventional interpretation of a small divergence between lows from price and the AD line for Friday would be as hidden bullish divergence. However, I am changing how I interpret this indicator to be more in line with Lowry’s, considering they are the experts on market breadth. The AD line has made a slight new low today, below the low of two sessions ago, but price has not. This will be interpreted as a bearish leading indicator. This supports the alternate hourly Elliott wave count today.
Small, mid and large caps have all made new all time highs this week. The rise in price is supported in all sectors of the market.
Go with the trend. Manage risk.
DOW THEORY
All the indices are making new all time highs. The continuation of the bull market is confirmed.
The following lows need to be exceeded for Dow Theory to confirm the end of the bull market and a change to a bear market:
DJIA: 17,883.56.
DJT: 7,029.41.
S&P500: 2,083.79.
Nasdaq: 5,034.41.
Charts showing each prior major swing low used for Dow Theory are here.
Published @ 09:46 p.m. EST.
NFLX is also another excellent short candidate, probably even better than MSFT. Unlike the latter, which although trading at ludicrous evaluations has a healthy balance sheet, NFLX in addition to laughable evaluations is loosing money by the billions and up to its digital eyeballs in debt. That parabola is also eventually going back to its beginning…..
A number of stocks are now trading at ridiculous distances from important moving averages. Some of the extremes are truly startling. The last time MSFT traded this far from an annual EMA was in 1999. The law of mathematics applied to equity price movement makes this a no-brainer trade. Buying April 2018 MSFT 75 strike puts for 3.60 per contract. My expectation is that MSFT will tag that MA line around 55 sometime in the next six months. Generous 20% stop at 2.90 per contract. With ten contracts, risking 1.5K for possible return of 15K. (round numbers, of course! ) 🙂
Verne,
If lara is seeing 3-4 months of bullishness given the technicals, do you not agree perhaps a better time for buying put options will be sometime mid to late december 2017? I just don’t want time decay to work too much against my positions. Also, some of the chinese momo stocks are going insane as well. Thoughts?
sorry I didn’t see the previous chart and comments – internet playing up!
No worries Nick 🙂
Yeh, I also went short but not sure what wave degree we are in. Not sure Lara’ s hourly alternate is still valid?
Looks like the alternate hourly is correct and a small consolidation or pullback has begun.
Because minuette (ii) was deep we should expect alternation and minuette (iv) to be shallow. So a small sideways chop lasting about five or eight days is now expected. At its lows it should offer a nice entry opportunity to join an established upwards trend.
This may relieve overbought conditions, giving price the perfect environment to rise further.
chart here
Well, Verne now we are really in a spot. Trade is working too well too quickly……
I’ll go ahead and jinx us now 🙂
Yup. I took some profits when VIX hit my 10.50 target briefly today.
I was expecting a warm-up mini spike before new 52 week lows ahead of the real fireworks, so things right on schedule!
I have the 18 wheelers backed up and ready for the next smash down, which I think will be the entry sweet spot of the year…. 🙂
The market makers did not like the size of my TZA trade last Friday and came at me with a 2X4 at the open- a new 52 week low won’t you know!
Reminds me of DeNiro’s line in taxi driver:
“Are you talkin’ to me??!!” 🙂
Yup, we reduced a touch a the highs. Methinks it could rise into new highs as VOL has done before ahead of a terminal move. Of course it likely gets taken to wood shed before hand at least one more time.
I am counting on it…! 🙂
We should see an upper B band penetration the next day or two ahead of what I think will be the final smack-down of this wave up; perhaps an even more significant low going forward….
Wow, that was fast!!!
Like greased lightening LOL
I had to get the analysis done quick because I’m flying home to New Zealand today.
Woohoooo! Kiwis can fly!
They can but they prefer mono-hulls over cats with foils.
🙂