A new high in the first hour of the session gave confidence to a target at 2,548 to 2,550. Upwards movement for the session reached 2,552.51.
Summary: Assume the trend remains up while price remains within the violet channel on the hourly charts. The new target is now at 2,586 to 2,589.
A breach of that channel and then a new low below 2,535.37 would indicate a pullback or consolidation has begun. It may be shallow and last only a few days.
The trend remains up. Go with the trend. Corrections are an opportunity to join the trend. Only the most experienced and nimble of traders may consider trading a smaller correction short. Most traders should wait until the correction is complete before entering long.
Always trade with stops and invest only 1-5% of equity on any one trade.
Last monthly and weekly charts are here. Last historic analysis video is here.
MAIN ELLIOTT WAVE COUNT
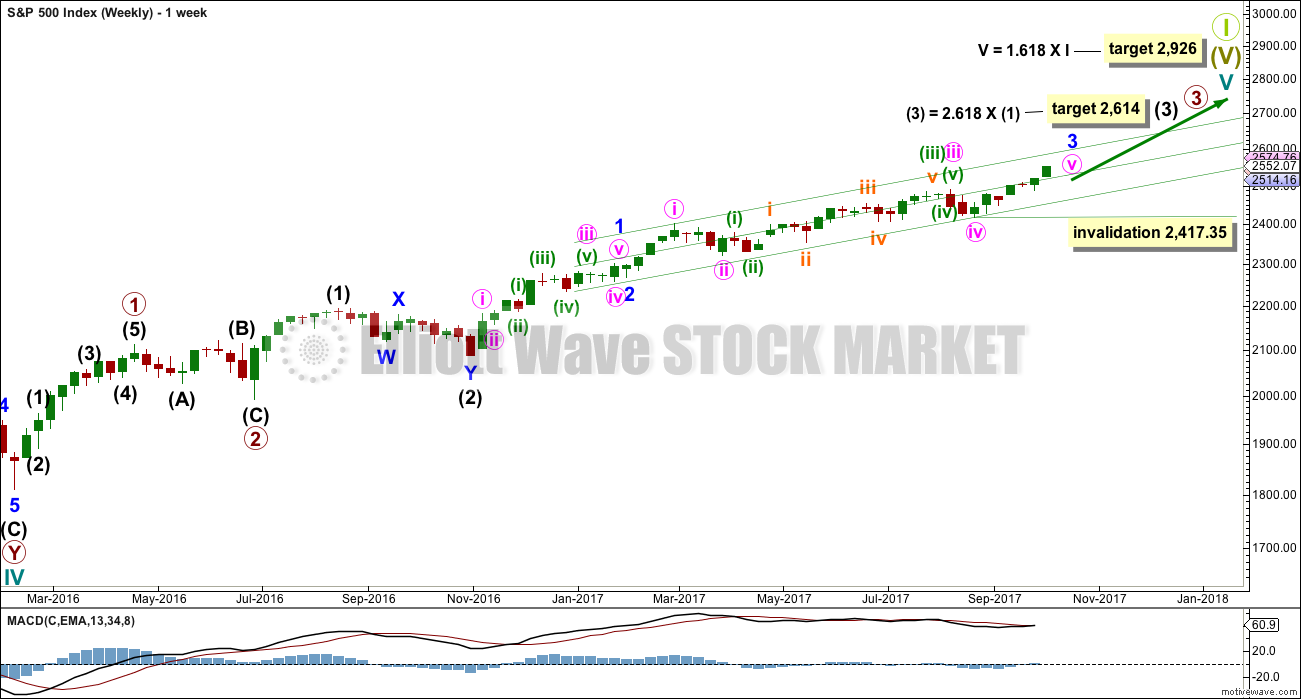
WEEKLY CHART
This wave count has strong support from another bullish signal from On Balance Volume at the weekly chart level. While classic analysis is still very bullish for the short term, there will be corrections along the way up. Indicators are extreme and there is considerable risk to the downside still.
As a Grand Super Cycle wave comes to an end, weakness may develop and persist for very long periods of time (up to three years is warned as possible by Lowry’s for the end of a bull market), so weakness in volume may be viewed in that larger context.
Within minute wave v, no second wave correction may move beyond the start of its first wave below 2,417.35.
The next reasonable correction should be for intermediate wave (4). When it arrives, it should last over two months in duration, and it may find support about the lower edge of this best fit channel. The correction may be relatively shallow, a choppy overlapping consolidation, at the weekly chart level.
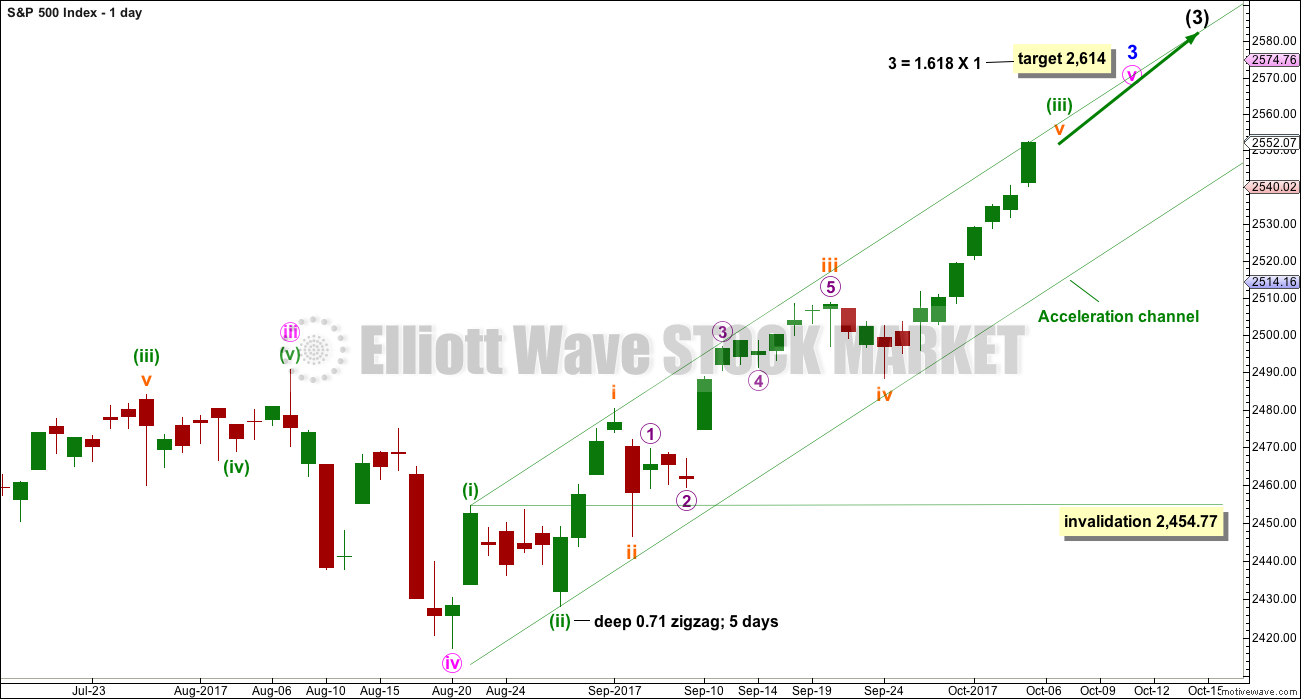
DAILY CHART
To see details of the whole of primary wave 3 so far see the analysis here.
Minute wave v to complete minor wave 3 must subdivide as a five wave structure. It looks like an incomplete impulse. So far it looks like minuette waves (i) and (ii) are complete with minuette wave (iii) now very close to completion.
When minuette wave (iii) is complete, then minuette wave (iv) may not move back down into minuette wave (i) price territory below 2,454.77.
So far minuette wave (iii) has lasted 26 sessions. If it exhibits a Fibonacci duration, then it may continue now for another 9 sessions to total a Fibonacci 34.
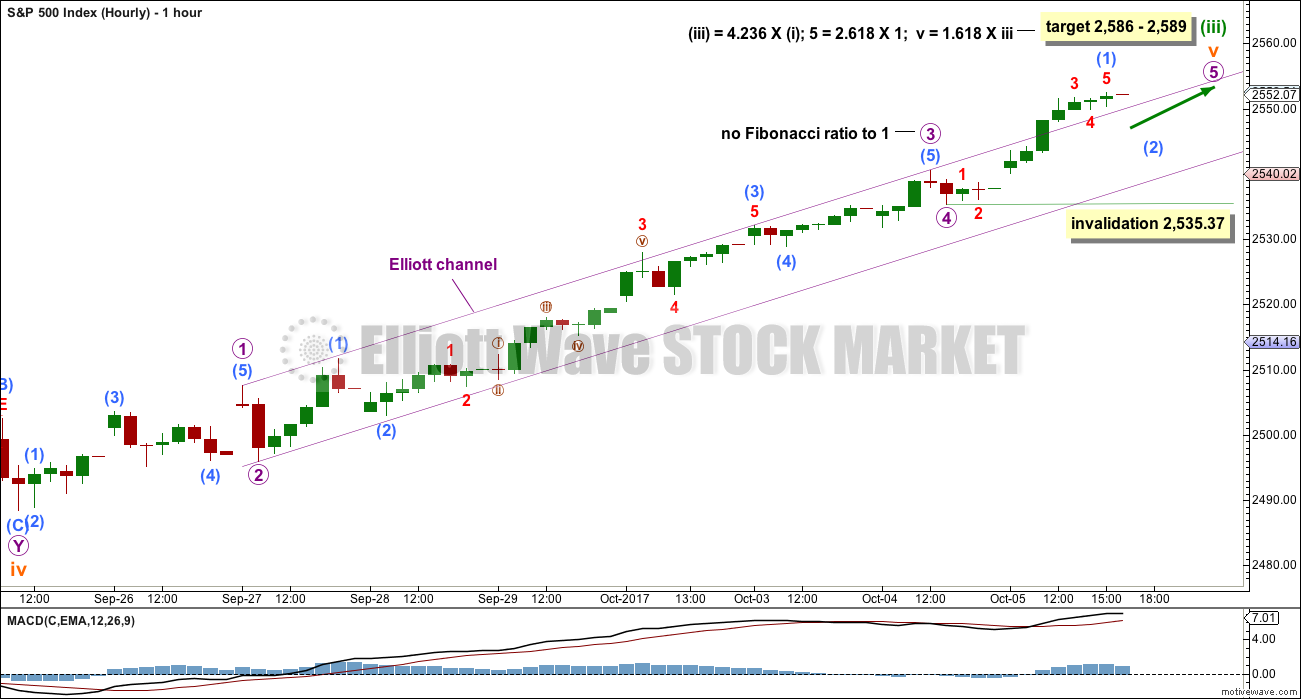
HOURLY CHART
A new target is calculated for minuette wave (iii) to end. At 2,586 minuette wave (iii) would reach 4.236 the length of minuette wave (i), and also at this price point micro wave 5 would reach 2.618 the length of micro wave 1. At 2,589 subminuette wave v would reach 1.618 the length of subminuette wave iii.
This three point target zone is a small cluster of Fibonacci ratios which has a reasonable probability.
Within micro wave 5, sub-micro wave (2) may not move beyond the start of sub-micro wave (1) below 2,535.37.
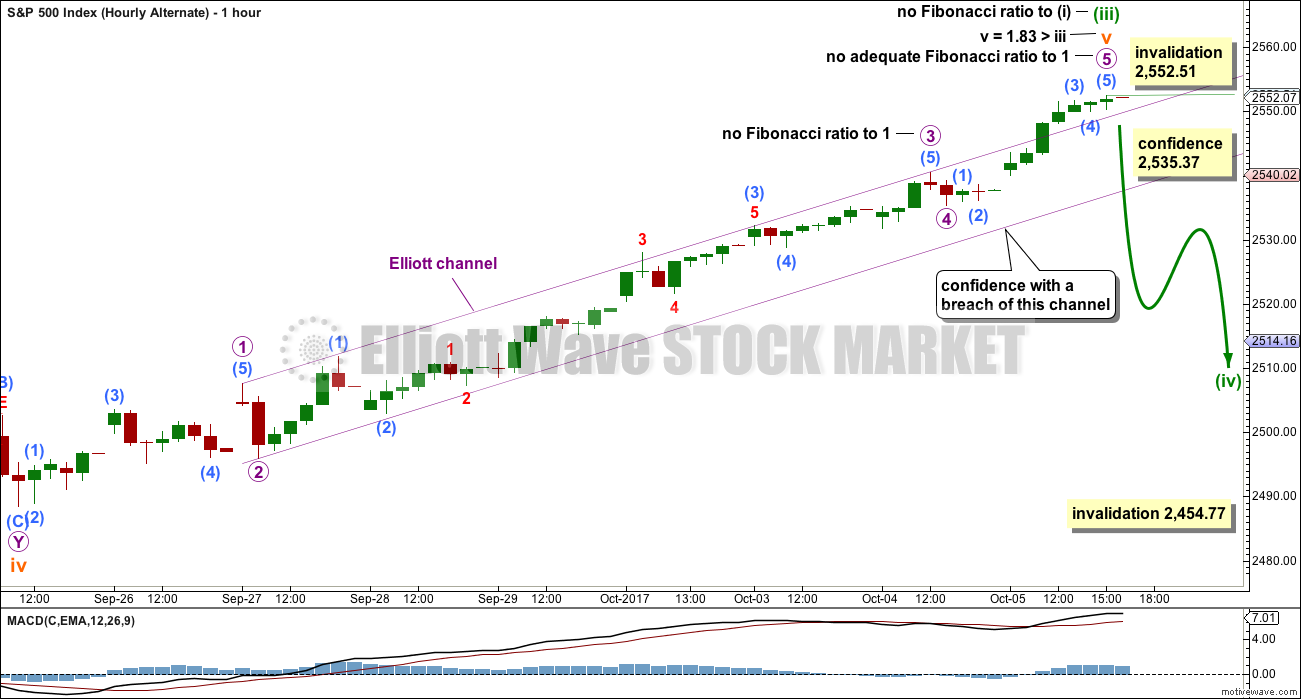
ALTERNATE HOURLY CHART
The structure of subminuette wave v and so all of minuette wave (iii) may now be complete.
A small violet channel is drawn about subminuette wave v. When this channel is breached by downwards movement, it shall be indicating that subminuette wave v is over and the next wave should be underway.
The next wave should be a consolidation or pullback for minuette wave (iv). Minuette wave (iv) may not move into minuette wave (i) price territory below 2,454.77.
A new low below 2,535.37 would invalidate the main hourly wave count above and provide some confidence in this alternate wave count.
There are more than 23 possible corrective structures that minuette wave (iv) may be. It should begin with a small five down at the hourly chart level. While that is incomplete, the first small second wave correction within it may not move beyond the start of its first wave above 2,552.51.
Once there is some structure within minuette wave (iv) to analyse, then alternate wave counts will be used to cover the various scenarios of how it may unfold. For corrections the Elliott wave focus should be on identifying when they may be complete, not on trying to identify the small sub-waves within them because there is too much variation possible.
Minuette wave (ii) was a deep zigzag lasting five days. Expect minuette wave (iv) to exhibit alternation and to be shallow, and most likely a flat, combination or triangle. It may last a total Fibonacci three, five or eight days.
TECHNICAL ANALYSIS
WEEKLY CHART
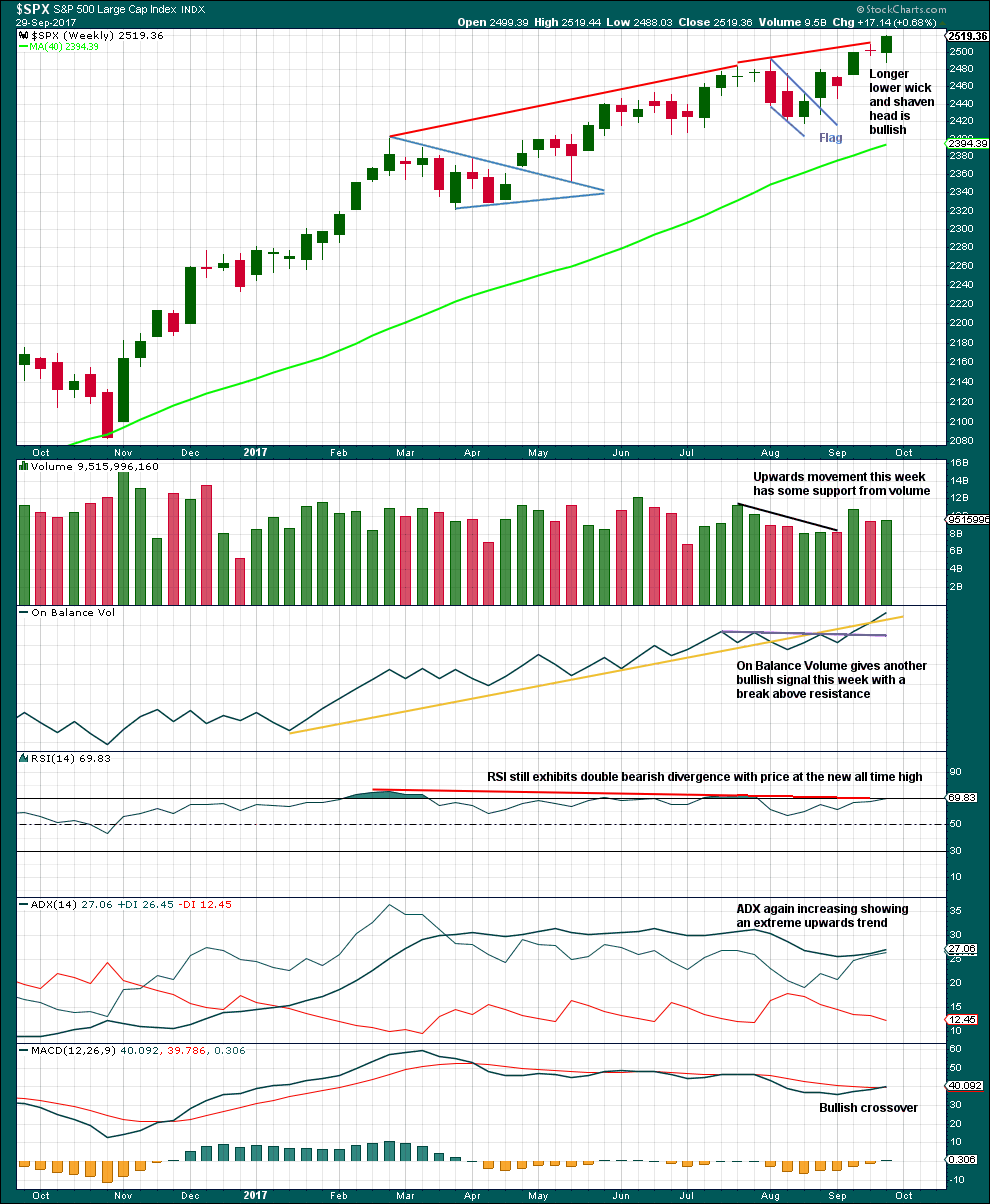
Click chart to enlarge. Chart courtesy of StockCharts.com.
The candlestick is bullish. On Balance Volume is very bullish. MACD is now bullish. ADX remains bullish.
ADX is extreme but not by much.
This analysis strongly supports the main Elliott wave count. The trend is up. Keep all trades with the trend. Always use stops as there is always risk to the downside. Invest only 1-5% of equity on any one trade to manage risk.
From the small flag pattern, using the measured rule gives a target about 2,520; this is nicely close to the Elliott wave target.
DAILY CHART
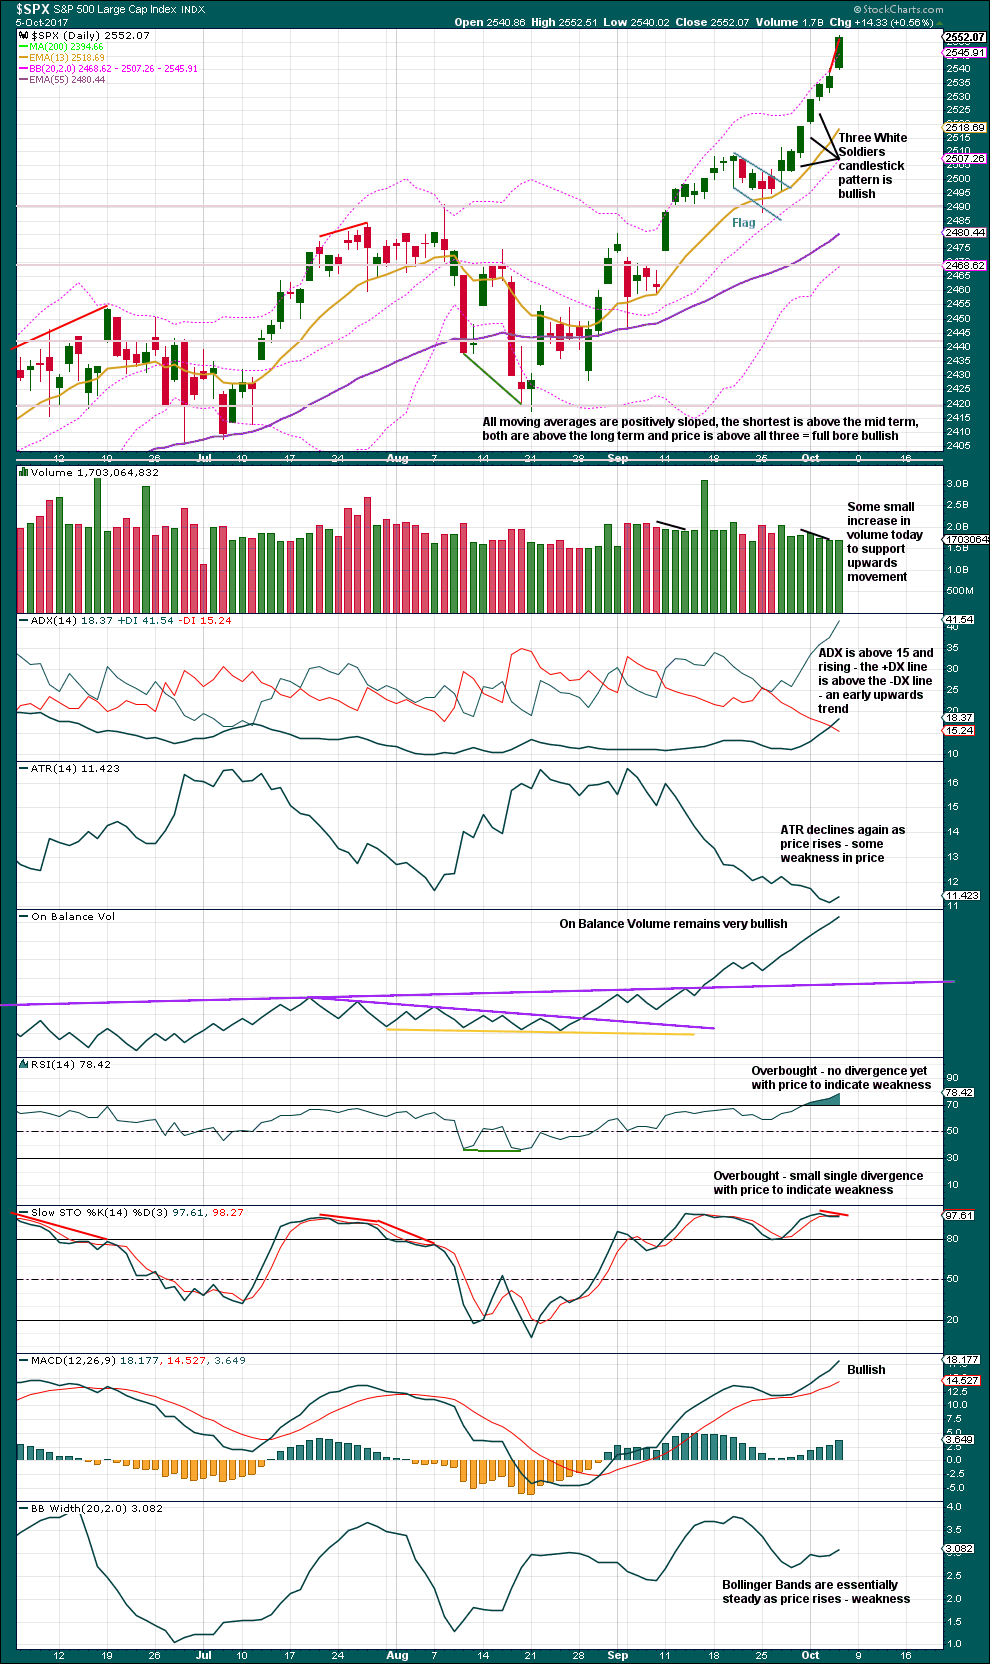
Click chart to enlarge. Chart courtesy of StockCharts.com.
Another strong upwards day today has some support from volume.
RSI still does not exhibit divergence with price; no weakness here is indicated. There is small weak single divergence with price and Stochastics, but this is not enough yet to indicate any real weakness which may lead to an immediate pullback here.
This chart is extremely bullish. The trend is up. While indicators are extreme and overstretched now, they can remain so for a while when this market has a strong bull move.
Always manage risk. It is the most important aspect of successful trading.
VOLATILITY – INVERTED VIX CHART
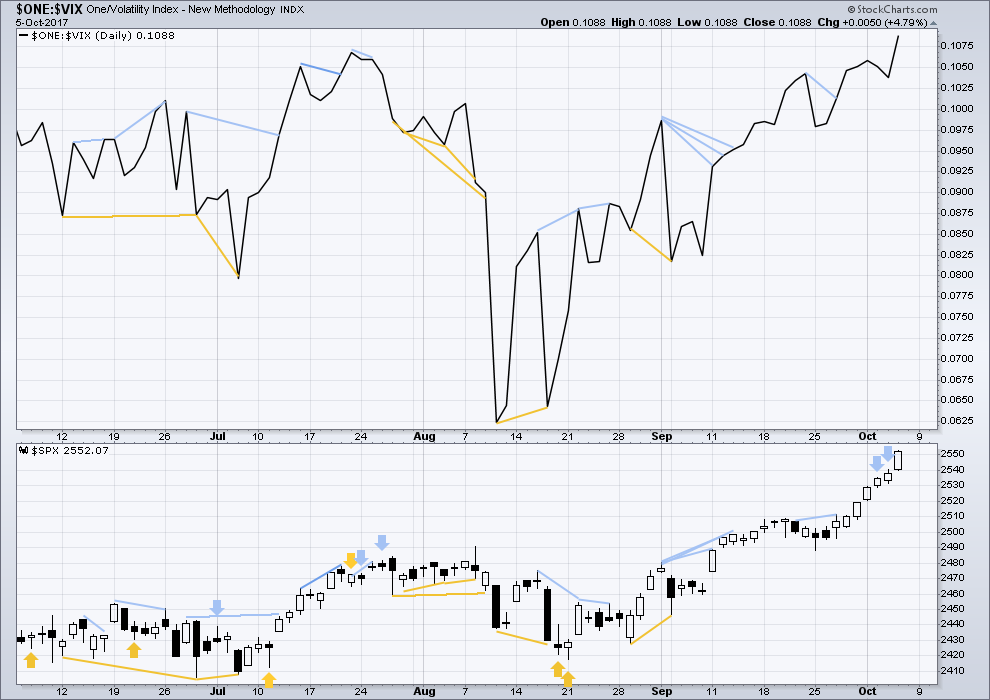
Click chart to enlarge. Chart courtesy of StockCharts.com.
Normally, volatility should decline as price moves higher and increase as price moves lower. This means that normally inverted VIX should move in the same direction as price.
Mid term divergence between price and inverted VIX has now disappeared. There is no longer any divergence with price and VIX; the rise in price comes with a normal corresponding decline in volatility.
BREADTH – AD LINE
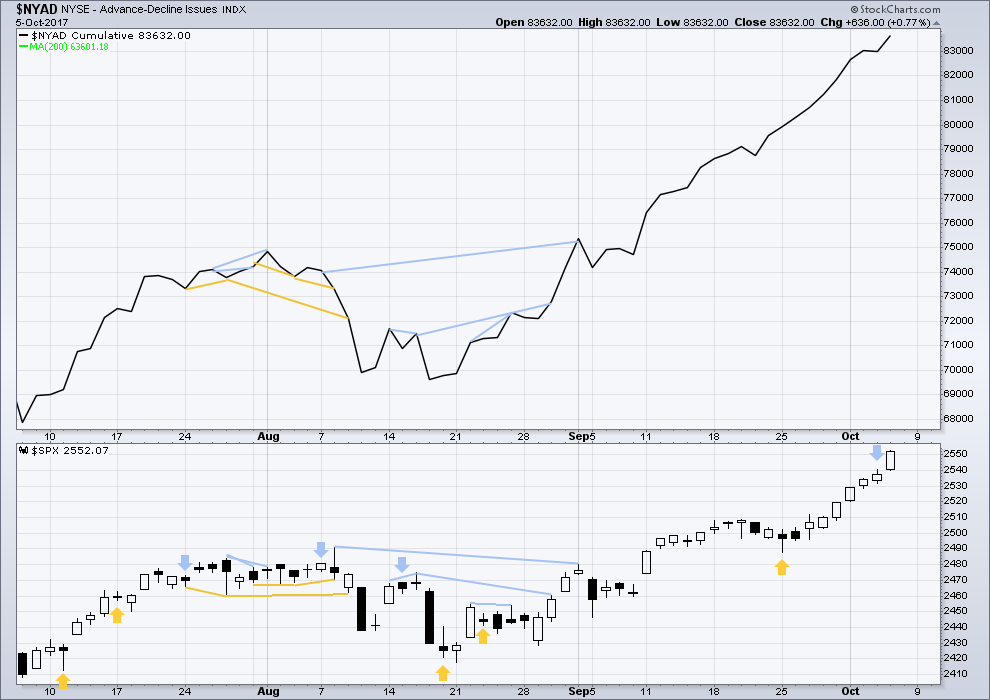
Click chart to enlarge. Chart courtesy of StockCharts.com.
With the last all time high for price, the AD line also made a new all time high. Up to the last high for price there was support from rising market breadth.
There is normally 4-6 months divergence between price and market breadth prior to a full fledged bear market. This has been so for all major bear markets within the last 90 odd years. With no divergence yet at this point, any decline in price should be expected to be a pullback within an ongoing bull market and not necessarily the start of a bear market.
The small bearish divergence noted yesterday has failed. This indicator does tend to work more often than it fails, but it will not work all the time. This is one of those times.
The AD line today has made a new all time high with price. The rise in price is again supported by a rise in market breadth. This is bullish.
The mid and small caps have also made new all time highs. The rise in price is supported in all sectors of the market. Lowry’s measures of supply and demand continue to show expanding demand and contracting supply, which is more normal for an early bull market. This market shows reasonable internal health.
Go with the trend. Manage risk.
DOW THEORY
The S&P’s new all time high is confirmed by DJIA and Nasdaq also making new all time highs. DJT has also now made new all time highs, so the continuation of the bull market is now confirmed.
The following lows need to be exceeded for Dow Theory to confirm the end of the bull market and a change to a bear market:
DJIA: 17,883.56.
DJT: 7,029.41.
S&P500: 2,083.79.
Nasdaq: 5,034.41.
Charts showing each prior major swing low used for Dow Theory are here.
Published @ 09:17 p.m. EST.

Well that’s an interesting conversation, well done everybody for keeping it civil. Lots to ponder and learn there.
I’m flying home to New Zealand today. I have enjoyed my time in Hong Kong and I’ll be back again one day. But I’m looking forward to going home.
Back to normal next week, I’ll again be able to jump in before the New York session closes and give you an update on the short term outlook for those who like to adjust their positions.
Thank you all very much for your patience this week while I have not been able to provide that extra level of support.
Hey, Lara, no problem. We like it when you have times of fun and adventure. It is good for the heart and soul. Yes, today was quite a conversation. Hmmmm. Thanks to all contributors.
Have a great weekend. I am going to see my granddaughter play soccer tomorrow. Last game she scored 11 goals! I’ve had to tell her dad, “She is only five years old. So, lets slow down and see how she does at 10 and 15 years old before we claim her soccer supremacy.”
LOL That’s awesome Rodney 🙂
Yeah, best to not get too excited over what kids can do… they change so much!
My son did learn to surf about age 7-9 and got quite good for a grommet, but now he’s a teenager completely different. Thanks to Steven Spielburg and Jaws (true story 🙁 )
Have a great weekend Rodney.
Poor goalie! 🙂
A really insightful narration by Tim Knight about the idea of “Normalcy Bias”.
The first minute of the video….
https://www.tastytrade.com/tt/shows/trading-the-close-with-tim-knight
Looking for maybe a small degree C wave drop on Monday AM. Or something more complex for a couple days. Maybe… or not…
The hourly chart looks ripe for a C wave, but I expect green come Monday morning. China and Korea will be playing catch up and spearhead the move forward.
Buying January 2018 TZA 14.00 strike calls for 0.94
Looking for gap closure at 14.70 from September 26
Have a great weekend all!
Looks like Lara would call today’s action (2) on the hourly chart. So are we finished with (2) or just A of (2)?
Could also be early in (iv) on the alternate chart. Patience.
I have to say I am a little surprised to be in the green on my sub-10 VIX trades. They are out of few months and I thought it would take a much bigger move for them to pop.
Sometimes an out-sized move in premiums ahead of an actual market move can be a nice heads-up. Should I stay…, or should I go??!! 🙂 🙂
Hey Chris, make up my mind for me will ya? 😀
Gotta pay me for that Verne, lol. You know as a PM of a fund I can’t give advice. For what it’s worth, we appear to have nice crosses on Stochastics and MACD, as well as positive divergence, and throw in an engulfing candle for good measure.
I like it….! 🙂
In addition, see commitment of traders report from Tuesday evening update. You can thank me later 🙂
Yowza…!!!!
All I gotta say is I would never place capital in the short vol trade at this point. So much to loose, so little to gain.
Short vol is now undoubtedly the most crowded trade in the history of markets…
It looks like this move is corrective, some sort of fourth wave probably. We are going to have to wait until next week for our VIX spike methinks….one more wave up…..
Key short term level for VIX is 10.50. If we clear it today we will probably hit my target….
I am looking for an initial spike in VIX to cash in on some trades. We will probably see a serious smash-down after that initial spike; possibly even to new all time lows…that will be the signal I think.
Anyone look at the Fear Greed Index lately. It is at 95 – Extreme Greed. You do not see readings this how very often. This 95 reading is the highest in at least the last 2.5 years. Is it time to give some haircuts to the greedy?
I did notice that. Market Breadth also at 2.5 yr high. I was trying to find some historical Fear Greed Index but couldn’t…. any insight?
Lara,
Any idea if you will be doing NDX analysis anytime soon?
It’s quite possible now that I’m flying home to New Zealand today.
I will keep this request in mind for next week.
The kind of sentiment being expressed by many market participants is starting to approach levels of outright mania, and this is very characteristic of market tops. That precise sentiment is also now being reflected in the chart profile – we have a parabolic rise underway. The thing that made me smile recently was a comment dismissing the idea of the principle of mean reversion. Think about it!
This argument posits that the S&P 500’s historical average PE of 15 over the last 100 years tells us nothing about what we might expect going forward with a current PE of better than 25. Just stating that makes me smile again. 🙂
Absolutely remarkable!
None of us can accurately predict the future and this market may well continue to run higher longer than some of us expect. Having said that, there are few things worth keeping in mind.
Parabolas when traced out by advancing price do not generally correct…they collapse.
The principle of mean reversion is not based on some whimsical notion of what market price OUGHT to do, it is based on a mathematical reality of what price DOES.
The famous magazine cover signal again famously (the Economist) heralded the Dollar’s slump earlier this year and US markets recently graced its cover.
Be careful out there…
What’s the current mean the market should revert to Verne? And how do you compute it?
In percentage terms, it should be between 30-40%. Computed using PE, CAPE, and history. If you adjust for the tomfoolery, inflation, GDP, debt etc then you get the super-cycle/generational wave down, blah blah blah. My expectation is a test of the 2270 pivot swiftly (11-12%), and not looking to be a hero front running a giant (potentially) bear.
You mean, a “reversion to the mean” in price should take price down 30-40%? Maybe. Of course price will someday go down, and go down a lot. The question is, what is this “mean” that Verne insists exists? Mean of WHAT?
Let’s be clear here: I said there is no “reversion to the mean principle” that applies to PRICE (exclusively).
If we start talking about other metrics like Price/Earnings, things get more complicated and “different”, because now there are two variables. PE itself (say, for the SPX index) isn’t particularly stable: see this graph:
http://www.macrotrends.net/2577/sp-500-pe-ratio-price-to-earnings-chart
While a PE mean can be computed, I’d argue that it looks like that mean floats around over time. With respect to PRICE ONLY, who is to say the price will adjust to get the PE back to a “mean”? How about earnings changing instead? That rather explains the fact that the SPX has been in a long term uptrend for it’s entire existence. No reversion to the mean in price in the total history of the index, that’s patently obvious. Maybe this reversion to the mean of price is a new phenomena? I don’t see any evidence. What we can get confused about is the tendency of price to move in WAVES: yes, it goes up, it goes down. There mere fact that occurs provides zero support to any reversion to mean theory re: price (alone).
Thanks Chris. You got to that before I say the query.
The question I think highlights how little awareness there is of the severity of the price distortions we are seeing. Some overbought conditions are now more extreme than we have seen in twenty years….
You’re welcome. Up modestly on VIX trade, likely I’ll wuss out and exit at 13, while it’s on its way to 22.
Me too. My initial target is 12.75 to take some money off the table and then wait for the inevitable smash down…. 😉
Again, what is the mean of price right now that you expect the SPX to revert to, and how did you compute it? (Essentially, over what period do you compute the mean to which price always reverts?). I’m all ears. And please don’t twist my claim of no reversion to mean principle active in price to claim I:
– don’t understand market risk
– don’t understand that price moves in waves
– don’t understand that price is extended
etc. Let’s focus on this reversion to mean of price (not P/E) issue. If you can’t define a consistent mean, all you are really saying is “price will come down at some point”.
Well. Yes.
Well, I did try… 🙂
In all fairness, we COULD see an absolute explosion in earnings going forward with price remaining elevated…… 🙂 🙂 🙂
Oops! Earnings have been FALLING the last six quarters…
Initial target: 2105
Probable target: 1608
Bear Market target 1428
Math is both fundamental and technical.
25-14/25=.44=44% to get back to average in PE terms 2550 x.44=1428
2550-666=1884
1884x.236=444.624, 2550-444.62=2105.3
1884x.382=719, 2550-719=1830.32
1884x.50=942, 2550-942=1608
Next time I’m sending a bill….
See? That was not so difficult.
Chris I admire your easy-going demeanor. I was afraid Kevin might think I was trying to impugn his math skills if I threw up those calculations….
Then again, I am quite confident that he would not have any trouble whatsoever computing those results. I think we just happen to disagree on the matter of how they may affect market price going forward. That is perfectly O.K. It is always great to have differing points of view on a forum like this. That is the way we all learn from one another imho…. 🙂
Earnings falling for 6 quarters? Here’s data on a monthly basis for the last several years. Earnings per share for the SPX. Definitely rising, not falling. Maybe you meant the earnings/price ratio is falling for 6 quarters?? I don’t know. This data is from multpl dot com. Just FYI.
Mar 31, 2017 101.00
Feb 28, 2017 99.15
Jan 31, 2017 97.53
Dec 31, 2016 96.15
Nov 30, 2016 94.33
Oct 31, 2016 92.34
Sep 30, 2016 90.60
Aug 31, 2016 90.08
Jul 31, 2016 89.42
Jun 30, 2016 88.54
May 31, 2016 88.67
Apr 30, 2016 88.87
Mar 31, 2016 89.12
Feb 29, 2016 89.54
Jan 31, 2016 89.64
Dec 31, 2015 89.82
In addition to the specific comments from Chris below Kevin, if the historical mean of the last 100 years is 15, and the current reading is 25, the percentage change to achieve mean reversion is pretty straightforward….you probably were overthinking it…. 🙂
I never said anything about P/E ratios and reversion of P/E to means. I said PRICE doesn’t have a MEAN, and it doesn’t. That’s all. Sorry if it was so upsetting. THANK YOU CHRIS for all the computations around P/E’s. I’d suggest to you that “average” PE’S over the last 100 years aren’t necessarily reflective of a current “norm” for PE’s. That “mean value” isn’t really stable over the years. Of course the PE level is “relatively high” now, and will at some point come down. So will price. And earnings will go up (perhaps very dramatically in a year, if tax changes are put in place). That could “revert P/E to the mean” quickly, without requiring price to change whit.
I’ll get back to being complacent and ignoring risk etc. now, Peace Out!!
Not upsetting in the least. You asked for the math, so I provided it based on fundamentals and technicals.
It seems to me that is EXACTLY the idea behind a mean calculation. It IS supposed to smooth out perturbations over time…. 🙂
Even though you did not mention P/E, it does have a DIRECT correlation with price. Therefore any argument that is presented with regard to P/E will apply to price. Does that make sense?
OK I will quit now! 🙂
So price doesn’t revert to a mean (there is no mean to which it can revert!). Macro economic metrics revert to means, and affect (effect??) price. We can agree on that.
You are right Kevin I mis-spoke. I should have said REVENUE instead of earnings. The P/E has indeed been boosted by the share-buybacks…my bad!
I surf and play music Verne, 90% of the time I’m on cruise control speed, while 10% of the time the Irish part of me shows his rage. Certainly, never having to do with money or markets. Both are fungible and relatively simple to earn and navigate. Much love to everyone who is taking the commitment to the markets seriously. And remember it is always a ZERO SUM GAME!
Indeed! 🙂
It’s not a zero sum game. You could take the argument to investopedia (which certainly isn’t the voice of truth, BUT on general subjects is pretty reasonable), which in an article on “zero-sum game” re: the stock market, the following: “A common misconception held by some is that the stock market is a zero-sum game. It isn’t, since investors may bid share prices up or down depending on numerous factors such as the economic outlook, profit forecasts and valuations, without a single share changing hands.” I personally have no interest in debating it here, only to point out that it is not necessarily, or even probably, correct.
At this site, many of us have been looking for a major long term top in the equity markets for several years now. In all that time, what I have been looking for and not seen is a ‘blow off’ top. Many if not most major tops in commodities have some form of blow off top. The SPX often acts like a commodity. One famous blow off top was in the NASDAQ in 2000. Therefore, I am not surprised to see this manic buying and lack of concern about risk. Parabolic patterns are prone to strong reversal and retracing most of the parabola.
Certainly I wish I had held my long positions for this ride up. However, no one here expected to see 2580 without any meaningful corrections. Now, I won’t go long but rather am looking to stay on the sideline and let the dust settle. Or, I may just have a shot to catch the correction depending on how all this develops.
Bottom line for me: We may be seeing a top with long term implications leading to a strong and swift correction. Having said that, Lara rightly places a lot of weight on Lowry’s work and they are not indicating such a top. The Alternate Hourly Count may be the one that plays out.
We may get a 2% sell off this afternoon; it can and will come out of nowhere. A bear market and declines of 10%-20% or more take more time to develop; there will be plenty of heads up and warnings, in my opinion. Currently, there is zero indication of any topping. Zero. That could change any moment. But the drumbeat of “this market must go down” is nothing short of silly. Of course it must, and it will. But it’s not yet, it going UP. Every indicator says UP. Elliottwave says UP. Etc. Trade the trend and ignore the bears. They will have their day. Just not today.
How old are you?
There were No warning signs at all!… in October of 1987. This one I lived through and lost a good amount of money.
There were plenty of warning signs in 2008… but nobody was listening to those signs then.
I would venture a guess there were no warning signs at all in October of 1929 either. With all the people jumping out of windows after that event as proof of that.
58.7, a mere lad.
We are the same age… So you lived through 1987 as well. How did you do during that?
Only the buy and hold crew did well.
I was not trading in 1987.
Well Joseph, I’m 36 and have been managing money since age 22 and trading since 14. So in market years, 130?!!? 2000 also had no warnings signs as well. We won’t have a warning IMHO here as well. All assets topping together at once…..
Here’s an SPX chart of 1999-2003. I see clear and compelling early signals that the market sentiment was changing, soon after the top, myself.
I tried to post a chart of the 1999-2003 period of the SPX, but it went into moderation, so it won’t show up here. That said, take a look at one. I did. Lots of warnings that the market was shifting from a bull mode to a bear mode. It took 2.5 years or so for the bear to unwind. The signals were there after about 2 months as it started. Just in my opinion. I expect (I am confident we will see) similar signals when the next bear awakens.
Even if there were, it does not necessarily follow that the market will behave in exactly the same way as it did previously imho….
Nothing can break this market at this point. It’s crashing up on nothing more than its own momentum. Bullishness breeds bullishness. It will end eventually obviously but the traditional technicals indicate the market is speeding up and not looking back for now.
It’s not advancing “on momentum”, it’s advancing due to greater buying than selling pressure. Money flow is “in”. It’s “in” because there’s lots of credit in the world, and it seeks the highest returns. The US stock market is providing good returns (as perceived by the investors). Wave theory tells us clearly it WILL turn/oscillate (not to be confused with reverting to a non-existent mean). This market will be falling soon enough. Meanwhile, it’s one of the great bull runs in history and despite the constant drum beat of how it’s all going to come crashing down Any Moment Now that we have here in this forum, the MOMENTUM IS STRONGLY UP. So I would urge everyone to follow Lara’s advice: use pullbacks to get positioned, use risk management, and make some money in this fantastic bull market. It won’t last forever…maybe a month, maybe a week, maybe a day, maybe a minute. No one knows. But the EVIDENCE that Lara lays out so thoroughly tells the story: BULL MARKET. Trade it long and be careful. My $0.02.
Kevin,
Is it because US Markets are considered a safe bet and probably being used as a hedge against currency devaluation. South East Asia is going through the turmoil and some calling for drop in Indian Stock Market to get more pronounced. Latin America is in similar situation. Some other technical analyst are looking for a market top between Oct 03 to Oct 09.
Personally, I am just waiting to see how long can this madness go on. But to Rodney’s point it has been a long an painful wait as the magic hand always holds the market up in critical situation (more recent being the day after US election results). I know the pain as I lost a good chunk despite making the right call.
Verne – Hope you are keeping well, I have been away but reading and watching from side lines since the loss from last trade.
There is really no selling pressure in the market, and has not for some time….
Lowrys see an expansion of buying power and contraction of selling pressure.
Conducive to a bull run to last at least 4 months, and quite possibly another 2-3 years.
Lara, how long do you anticipate holding a trade once you get in? Hours, days, weeks? I’ve tried intraday SPY /QQQ/IWM/AAPL option trading (instant gratification!) but profit/loss over time is a wash. I’m now trying to move to Daily chart reading to hold a trade 2-3-4 days. Leary of holding over the weekend in this environment. Still a work in progress.
I would prefer to hold for weeks, but that is not always how it works out.
I’m better at picking entry points than exit points, and both are just as important.
For this market at this time I’d hold it for a few days using a trend line and / or gaps to pull stops up.
I have no problem holding a position over the weekend at all, but my broker does allow me almost 24 hour access so I don’t get locked out. The fees are low.
I hate being in and out, I think focus on too small movements at the hourly chart level means we’re focussing on volatility that should be ignored.
I’m also happy to see an underwater position for the first few days.
But full disclosure: while I’ve been here in Hong Kong I have not been trading. I simply haven’t got the time to do it all this week.
Lara’s early tonite! Solid report as always.
Thanks Ron!