
The short term target for upwards movement was 2,540 to 2,541 on the hourly chart. Price moved up to sit right within this small one point zone, to 2,540.53.
Summary: Another day with divergence from VIX and now divergence with the AD line is bearish for the short term. Look out for a pullback here. Confidence may be had in a pullback or small consolidation underway if price makes a new low below 2,528.85.
A new high above 2,540.53 would indicate a pullback has not begun; a new short term target is at 2,548 to 2,550.
The trend remains up. Go with the trend. Corrections are an opportunity to join the trend. Only the most experienced and nimble of traders may consider trading a smaller correction short. Most traders should wait until the correction is complete before entering long.
Always trade with stops and invest only 1-5% of equity on any one trade.
Last monthly and weekly charts are here. Last historic analysis video is here.
MAIN ELLIOTT WAVE COUNT
WEEKLY CHART
Click chart to enlarge.
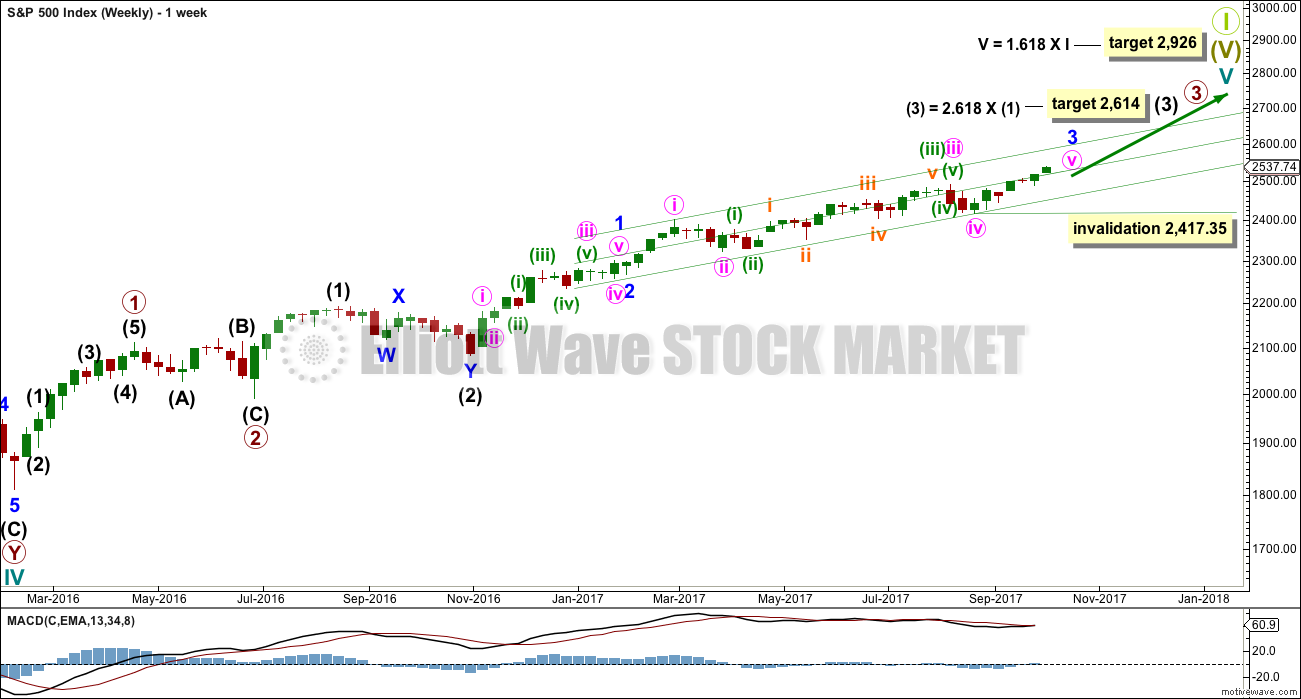
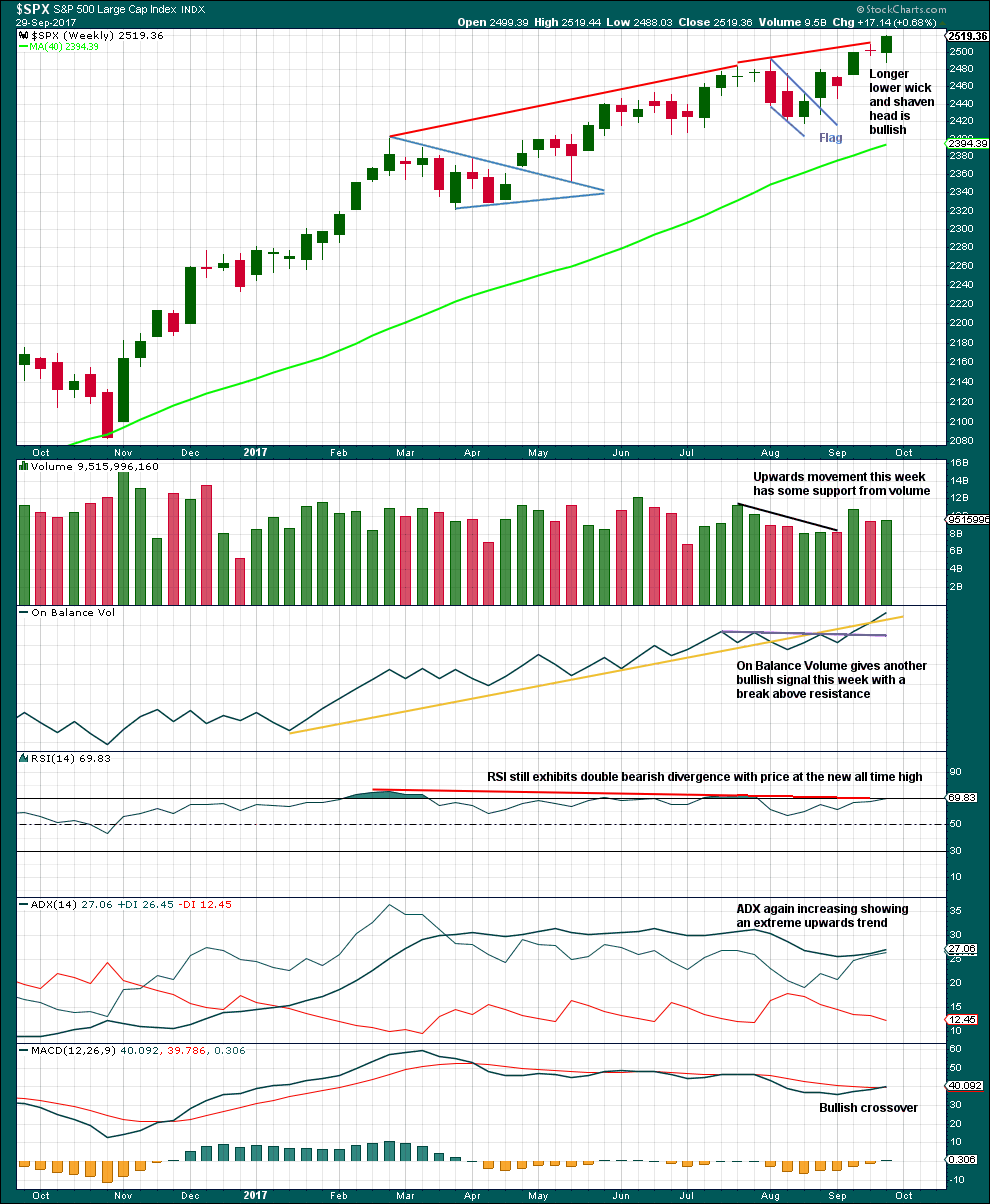
This wave count has strong support from another bullish signal from On Balance Volume at the weekly chart level. While classic analysis is still very bullish for the short term, there will be corrections along the way up. Indicators are extreme and there is considerable risk to the downside still.
As a Grand Super Cycle wave comes to an end, weakness may develop and persist for very long periods of time (up to three years is warned as possible by Lowry’s for the end of a bull market), so weakness in volume may be viewed in that larger context.
Within minute wave v, no second wave correction may move beyond the start of its first wave below 2,417.35.
The next reasonable correction should be for intermediate wave (4). When it arrives, it should last over two months in duration, and it may find support about the lower edge of this best fit channel. The correction may be relatively shallow, a choppy overlapping consolidation, at the weekly chart level.
DAILY CHART
Click chart to enlarge.
To see details of the whole of primary wave 3 so far see the analysis here.
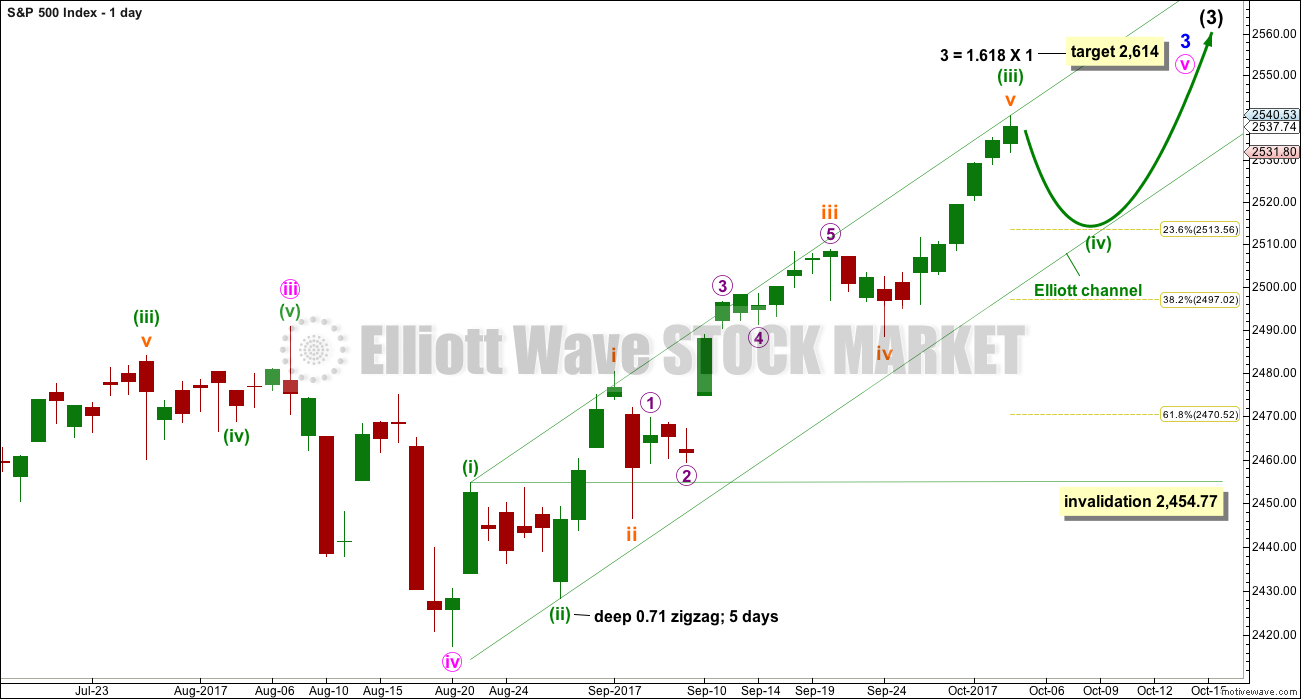
Minute wave v to complete minor wave 3 must subdivide as a five wave structure. It looks like an incomplete impulse. So far it looks like minuette waves (i) and (ii) are complete with minuette wave (iii) now very close to completion.
When minuette wave (iii) is complete, then minuette wave (iv) may not move back down into minuette wave (i) price territory below 2,454.77.
A new target is calculated for minuette wave (iii) to end. The target would see no Fibonacci ratio at minuette degree, but it would see a ratio at subminuette degree within minuette wave (iii).
So far minuette wave (iii) has lasted 25 sessions. The structure may now be complete at the hourly chart level.
HOURLY CHART
Click chart to enlarge.
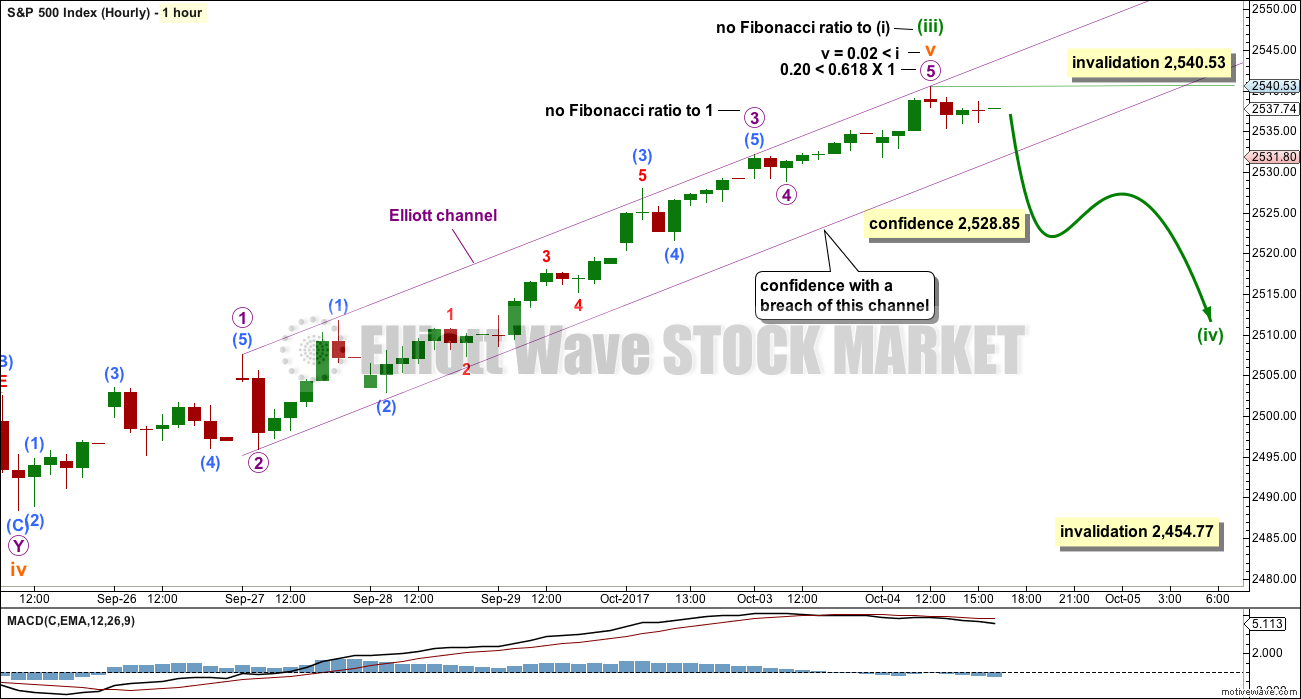
The structure of subminuette wave v and so all of minuette wave (iii) may now be complete.
A small violet channel is drawn about subminuette wave v. When this channel is breached by downwards movement, it shall be indicating that subminuette wave v is over and the next wave should be underway.
The next wave should be a consolidation or pullback for minuette wave (iv). Minuette wave (iv) may not move into minuette wave (i) price territory below 2,454.77.
A new low below 2,528.85 would invalidate the alternate hourly wave count below and provide some confidence in this main wave count.
There are more than 23 possible corrective structures that minuette wave (iv) may be. It should begin with a small five down at the hourly chart level. While that is incomplete, the first small second wave correction within it may not move beyond the start of its first wave above 2,540.53.
Once there is some structure within minuette wave (iv) to analyse, then alternate wave counts will be used to cover the various scenarios of how it may unfold. For corrections the Elliott wave focus should be on identifying when they may be complete, not on trying to identify the small sub-waves within them because there is too much variation possible.
Minuette wave (ii) was a deep zigzag lasting five days. Expect minuette wave (iv) to exhibit alternation and to be shallow, and most likely a flat, combination or triangle.
ALTERNATE HOURLY CHART
Click chart to enlarge.
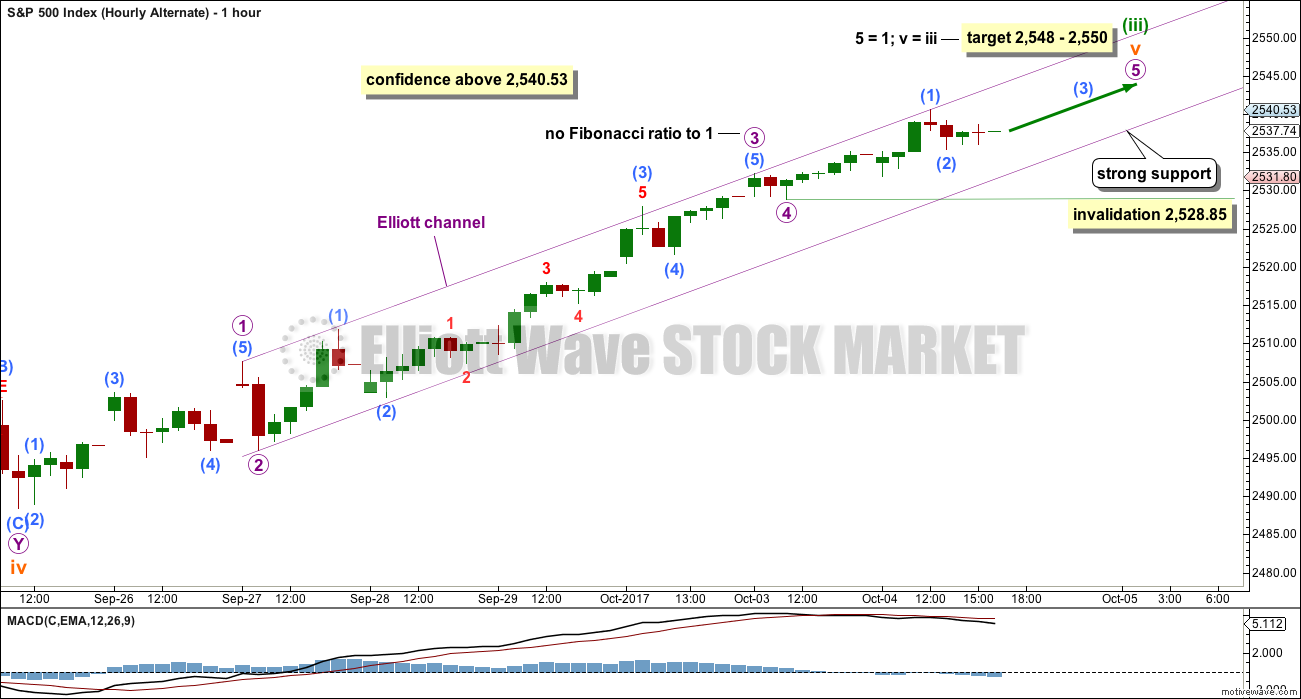
By simply moving the degree of labelling within micro wave 5 down one degree, it is possible that minuette wave (iii) is not yet over.
Sub-micro wave (2) may not move beyond the start of sub-micro wave (1) below 2,528.85.
TECHNICAL ANALYSIS
WEEKLY CHART
Click chart to enlarge. Chart courtesy of StockCharts.com.
The candlestick is bullish. On Balance Volume is very bullish. MACD is now bullish. ADX remains bullish.
ADX is extreme but not by much.
This analysis strongly supports the main Elliott wave count. The trend is up. Keep all trades with the trend. Always use stops as there is always risk to the downside. Invest only 1-5% of equity on any one trade to manage risk.
From the small flag pattern, using the measured rule gives a target about 2,520; this is nicely close to the Elliott wave target.
DAILY CHART
Click chart to enlarge. Chart courtesy of StockCharts.com.
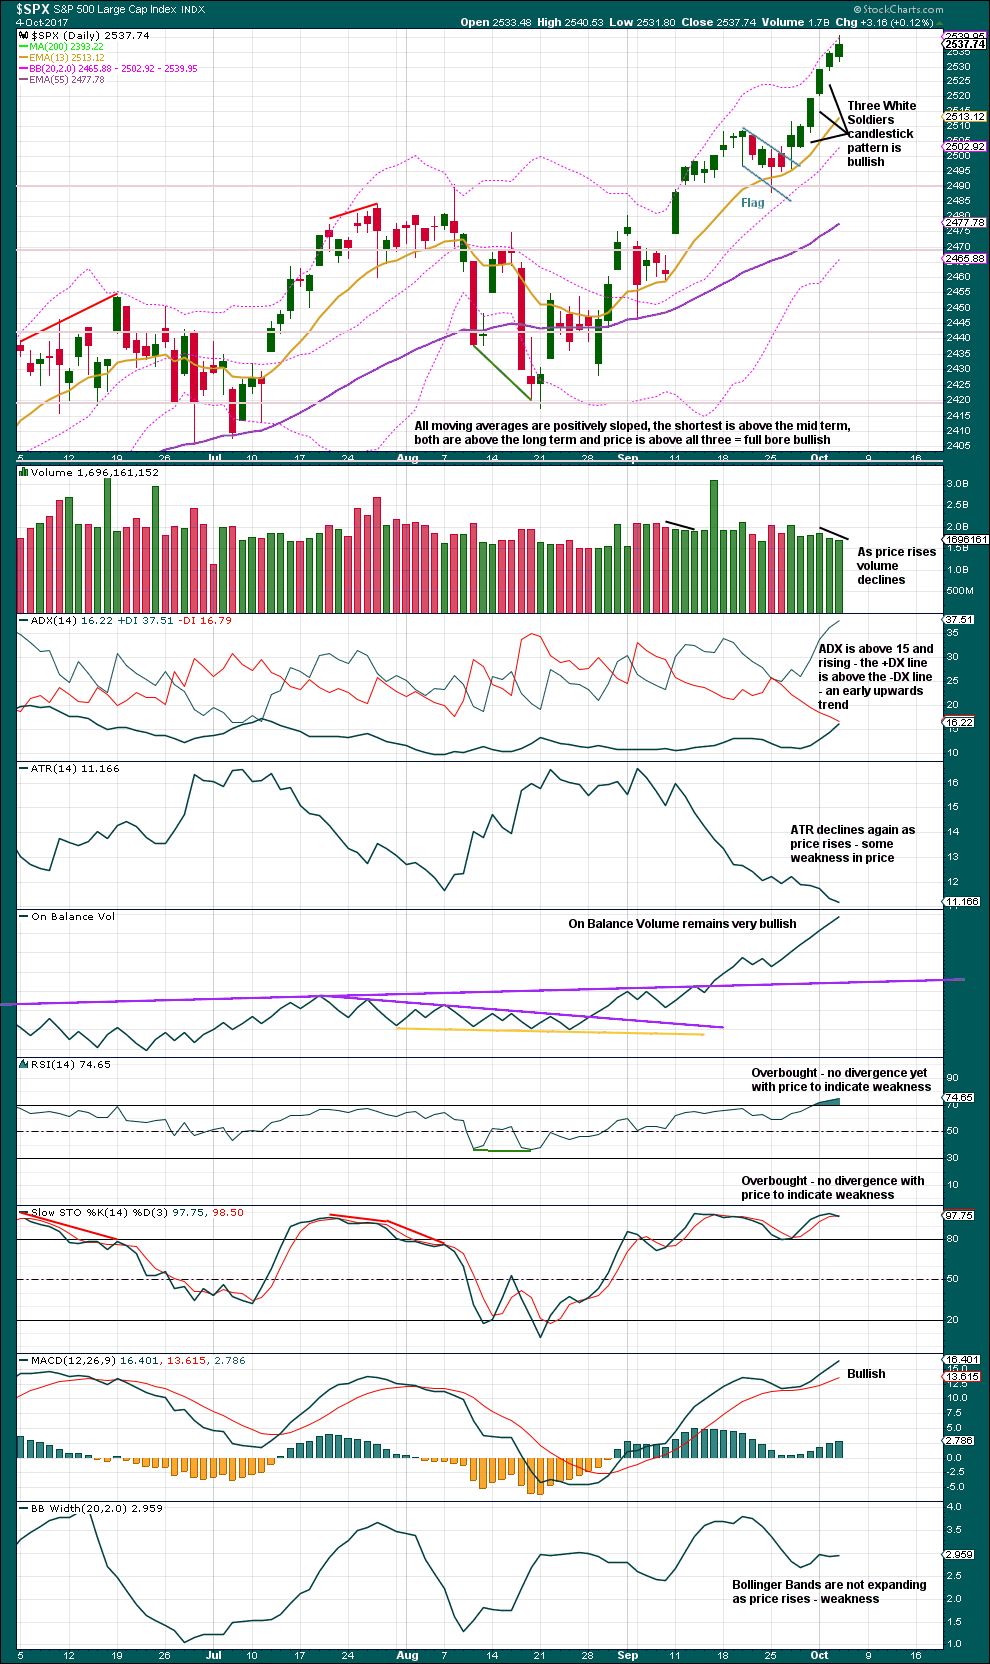
Although RSI and Stochastics do not yet exhibit divergence today with price to indicate any weakness, there is divergence with VIX and the AD line noted below.
A decline in volume for two days supports the main hourly Elliott wave count.
While the Three White Soldiers pattern is bullish, it can make no comment on how far price may move upwards after it appears.
ADX rising from a low level and below both directional lines is the strongest signal it can give. It is giving a strong signal here that a bull trend is in the early stages. This makes no comment on when a small consolidation or pullback may appear, so it should be used as an opportunity to join an established upwards trend if that happens.
The trend is up.
VOLATILITY – INVERTED VIX CHART
Click chart to enlarge. Chart courtesy of StockCharts.com.
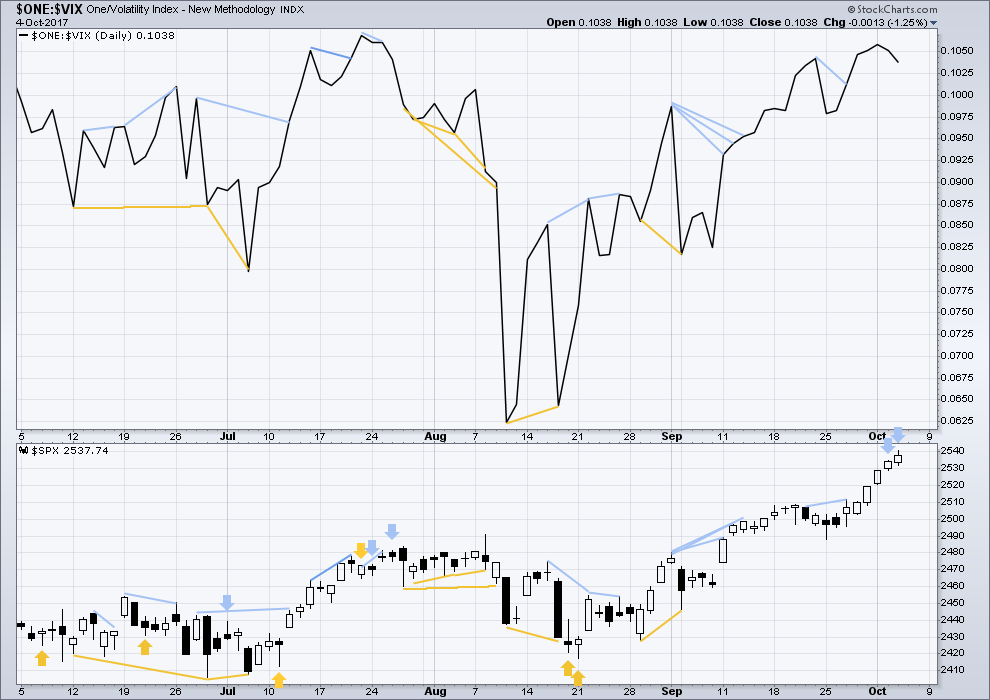
Normally, volatility should decline as price moves higher and increase as price moves lower. This means that normally inverted VIX should move in the same direction as price.
There is still mid and longer term bearish divergence, but it has been noted in the past that divergence over a longer term does not seem to work as well for VIX. Short term bearish divergence has disappeared.
Price has moved higher for two days in a row now, but volatility has not shown a normal corresponding decline: inverted VIX has moved lower. This indicates weakness within price and is bearish.
BREADTH – AD LINE
Click chart to enlarge. Chart courtesy of StockCharts.com.
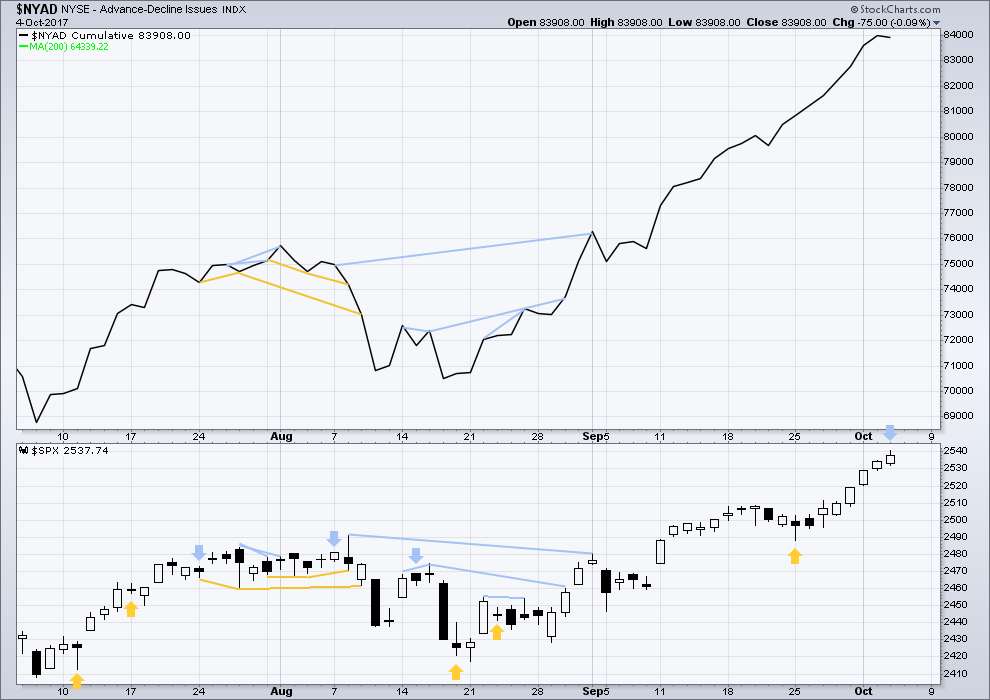
With the last all time high for price, the AD line also made a new all time high. Up to the last high for price there was support from rising market breadth.
There is normally 4-6 months divergence between price and market breadth prior to a full fledged bear market. This has been so for all major bear markets within the last 90 odd years. With no divergence yet at this point, any decline in price should be expected to be a pullback within an ongoing bull market and not necessarily the start of a bear market.
The rise in price today is not supported by a rise in market breadth. The AD line should be treated as a leading indicator, and today it shows weakness in price. This divergence is bearish and supports the main hourly Elliott wave count.
The mid and small caps have also made new all time highs. The rise in price is supported in all sectors of the market. Lowry’s measures of supply and demand continue to show expanding demand and contracting supply, which is more normal for an early bull market. This market shows reasonable internal health.
Go with the trend. Manage risk.
DOW THEORY
The S&P’s new all time high is confirmed by DJIA and Nasdaq also making new all time highs. DJT has also now made new all time highs, so the continuation of the bull market is now confirmed.
The following lows need to be exceeded for Dow Theory to confirm the end of the bull market and a change to a bear market:
DJIA: 17,883.56.
DJT: 7,029.41.
S&P500: 2,083.79.
Nasdaq: 5,034.41.
Charts showing each prior major swing low used for Dow Theory are here.
Published @ 12:05 a.m. EST on 5th October, 2017.
With Korea and mainland China closed this week, Sunday night should start off with a bang as Asia plays catch up. Hang Seng is on the verge of an all time high. The Nikkei 225 is on the verge of a 21 year high.
Although the S&P been up for 8 days in a row (with the last 6 being ATHs), the all time record is 14 green days in a row. It is very possible we could have all green days next week too (though I am not necessarily counting on it).
I didn’t realise it was Golden Week this week until I got here to Hong Kong.
The place is still insanely crowded, everything is open except banks and offices.
A great time to visit this mad town!
And you’re right Jimmy. We certainly could see more green candlesticks next week. This bull has strength. Despite that bearish signal yesterday from the AD line and Vix, it just keeps on going.
A wee increase in volume today offers a little support. The AD line is again fully bullish, and On Balance Volume is extremely bullish. Calculating new targets.
I am now fully long vol, even with my emergency dry powder. I am undoubtedly the last bear, at least with respect to volatility, standing! 🙂
Have a great evening everyone!
I’m with you Verne, got executed at 9.26!!!!
Good luck guys!
To any new members reading this, please understand these guys are experts with decades of experience doing what they do. Read, follow, learn… but please if you choose to copy manage your risk! What they’re doing is extremely risky, but they’re managing that risk to ensure their accounts don’t get wiped out.
Kids, don’t try this at home 🙂 would be my warning.
Awesome to watch you guys when you post your trades, you have nerves of steel.
Yes indeed. We will probably endure some short term pain as VIX prints a new 52 week low but I am expecting a swift reversal. I took positions several months out just in case… 😉
Thank you Lara, big wave surfing helps with the nerves. And as always, the disciplined, systematic deployment of capital always wins throughout all market conditions. On a non-disciplined, personal opinion note; it would be completely and utterly negligent as a portfolio manager of large sums of client capital, to not be a contrarian here.
Interesting article on sentiment at zero hedge…
http://www.zerohedge.com/news/2017-10-05/there-are-no-bears-left-none-not-soul
Zero Hedge has been wrong for 9 years running.
It’s an asset bubble based upon debt of that I am pretty confident.
But over the years I’ve learned the hard way that trying to pick when a bubble is going to burst is a fools game. They can inflate much more and last much longer than any participants and observers conceive.
We will have corrections along the way, but if this bubble is like all other bubbles in the last 92 years, then it will exhibit some warning signs before it bursts. There will be divergence over at least 4-6 months with market breadth, there will be an expansion of selling pressure and a contraction of buying power, and there will be weakness first in small caps then mid caps and finally large caps.
At this stage there is absolutely none of the above. So my conclusion is yes, it’s a bubble, but it’s likely got at least 4 months to run and fairly likely even 2-3 years.
Unless we get an exogenous event…
This is the problem. There would have to be an exogenous event with a lot of staying power. Almost nothing short of full out war would give us that.
I agree with Lara that it’s an asset bubble based on debt. In the past, debt bubbles were propped up by banks that eventually overplayed their hand and failed. But now the big banks are propped up by the federal government. The banks were able to deleverage because Uncle Sam picked up the tab. All across the world, Central Banks have figured out that it is possible to perpetually expand the money supply without risk of inflation via debt monetization. Debt monetization ties the expanded money supply to the global economy where there is an insatiable desire for U.S. dollars and a revitalized appetite for Euros.
There can’t be a crisis again until there is a major default. But when that happens, the world will just get even hungrier. I think eventually the U.S. will default on its debt in what will signal the end of a Grand Supercycle, but I don’t think it will be for many decades in the future (perhaps even several generations).
The market has bravely run the gauntlet of the seasonally bearish months of May and September. I am curious to see how it does this October. There are some intriguing historical October events from 1987 and 2007, years also ending in seven….. 🙂
This is astounding. I give up trying to do anything but go long in this market. It’s 1995 again.
If you think an extended bull run is unfolding, now is precisely the wrong time to jump on board if you were not already long, Rodney has it right in waiting for a pull-back to get positioned. I have long contended if we did not get a normal pullback after the last run-up from overbought conditions, we were not going to get a correction but a collapse. I could be completely wrong! 🙂
Does anyone else find it interesting that this ramp higher is coming on the heels of a CB balance sheet reduction announcement? Curioser and curioser!
Put a fork in it!
When the SPX was beneath 2500, we were asking ourselves if the 2500 ceiling would be tagged or slightly penetrated only to reverse back towards 2400. We also noted that it could put on a move to shatter the ceiling. Which would it be? Well, I think we have our answer. SPX has blasted through the 2500 round number resistance area. After the initial move to 2509, SPX took a 4 day breather and returned to 2488. Since then, SPX has rocketed to 2550 and not looked back.
This may be a blow off top, or not. It is reaching the upper channel line going back to April. What I can say is that this is one powerful move. The bulls are in firm control. More buyers than sellers every day. money is flowing in from somewhere.
Now that the daily SPX has reached its upper Bolinger Band, it may close above it today. A Revert To Mean trade is to be considered. If VIX would only reach its lower BB as well, we would have a great setup for at least a short term correction. Just my opinion of course.
However, we must heed Lara’s warning in her introduction to 10/4/17 analysis:
“The trend remains up. Go with the trend. Corrections are an opportunity to join the trend. Only the most experienced and nimble of traders may consider trading a smaller correction short. Most traders should wait until the correction is complete before entering long.”
Here’s a weekly of the SPX, with the intermediate term trend channel drawn in, and with my own custom version of Bollinger/Keltner bands. It’s a Trump (i.e, corporate shill) rally for sure, just massive since the rigged election. There’s no sign of bearishness anywhere on this chart. The hope of massive tax cuts for businesses has to be a key drive overall, and in the most recent surge. What happens if that tax cut stalls out…well, be ready. Note the current push well past the upper band, and note the “four wave” type action that followed on the two other such pushes on this chart (though one took two more weeeks of up and a hit on the upper channel line first!). A decent size four should be very close at hand, IMO.
Exactly Rodney. There is absolutely no way anyone should be entering any short trades ATM.
Trading against the trend is a sure way to lose money. And we’re all here to make money, not lose it.
60 points in 8 trading days.
130 points in 7 weeks.
We haven’t seen these types of moves since the 2100 run.
Maybe it’s all a blow-off top in process. Maybe. Meanwhile, it’s paying my bills. My new target for this move’s top before we get some kind of 4 is now 2552. Wild day!!
2552 almost here. (this is crazy)
Seven days in a row of green bars, which each bar resulting in new highs. I can’t quickly find another set of daily bars like it on the SPX. Seven greens yes, not 7 in a row with sequential new highs. In terms of higher highs, it’s 8 bars, a nice fibo #.
Alternate hourly in play I think – should turn around 2550?
Think that may just have been a temporary top. Saw sudden surge in volatility buying just near recent top. Nice 2548 call by Lara.
I have a (more bullish actually) take on the hourly chart. Note I use notation instead of circle. I think subminuette isn’t over, and we are in wave 5 of subminuette , as shown. Probably wrong as usual but FWIW, another point of view…
Oops, my use of angle brackets caused HTML interpretation issues and the message above just deleted them!! I suspect subminuette 3 isn’t over, and price is in wave 5 of subminuette 3.
Another oops, I think my naming is wrong, the circle waves on the hourly are (I think?) one level below sub-minuette’s, so…micro I guess. It’s challenging at this level of scale and this level of sub waves of sub waves, I’m constantly confusing myself. I’ve got a minimal target on this move of 2546.1 (5 = 1), and a higher target of 2547 (5 = 1.618 of 1-3 projected from the bottom of 4). At which point, time for a subminuette 4…per my count, which is probably wrong.
Yep… It’s all over!
ALL Over!
woo hoo,, wheres my prize
Another gap and go day is your prize. haha.
Nasdaq futures just ran off and now…. Earnings season is basically here once again.
All the talk about the July crash, then August crash, then a for sure Sept. crash… all down the drains.