
Bullishness in On Balance Volume and rising market breadth all have pointed recently to higher prices.
And in yesterday’s analysis it was noted there was a Three White Soldiers candlestick pattern on the daily chart, so higher prices today were completely expected.
Summary: On Balance Volume and the AD line remain very bullish, supporting the Elliott wave count. The next short term target is at 2,540. A mid term target for members with a longer horizon is at 2,614.
Some slight weakness today in volume and an increase in VIX today suggests this current upwards wave may be nearing its end, but the high does not look like it is in place quite yet with no divergence yet between price and Stochastics and RSI. This slight weakness and overbought RSI now indicates that traders should be particularly diligent with risk management at this time.
The trend remains up. Go with the trend.
Always trade with stops and invest only 1-5% of equity on any one trade.
Last monthly and weekly charts are here. Last historic analysis video is here.
MAIN ELLIOTT WAVE COUNT
WEEKLY CHART
Click chart to enlarge.
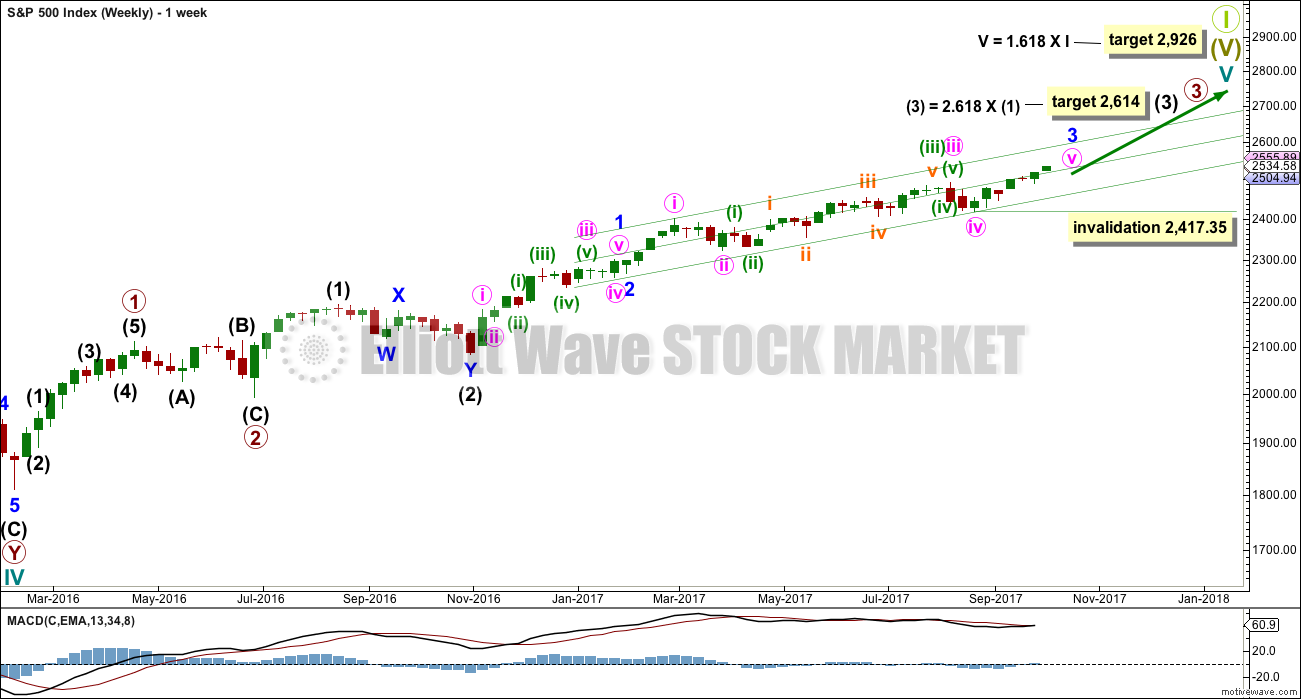
This wave count has strong support from another bullish signal from On Balance Volume at the weekly chart level. While classic analysis is still very bullish for the short term, there will be corrections along the way up. Indicators are extreme and there is considerable risk to the downside still.
As a Grand Super Cycle wave comes to an end, weakness may develop and persist for very long periods of time (up to three years is warned as possible by Lowry’s for the end of a bull market), so weakness in volume may be viewed in that larger context.
Within minute wave v, no second wave correction may move beyond the start of its first wave below 2,417.35.
The next reasonable correction should be for intermediate wave (4). When it arrives, it should last over two months in duration, and it may find support about the lower edge of this best fit channel. The correction may be relatively shallow, a choppy overlapping consolidation, at the weekly chart level.
At this stage, the alternate Elliott wave count will now be discarded based upon a very low probability.
DAILY CHART
Click chart to enlarge.
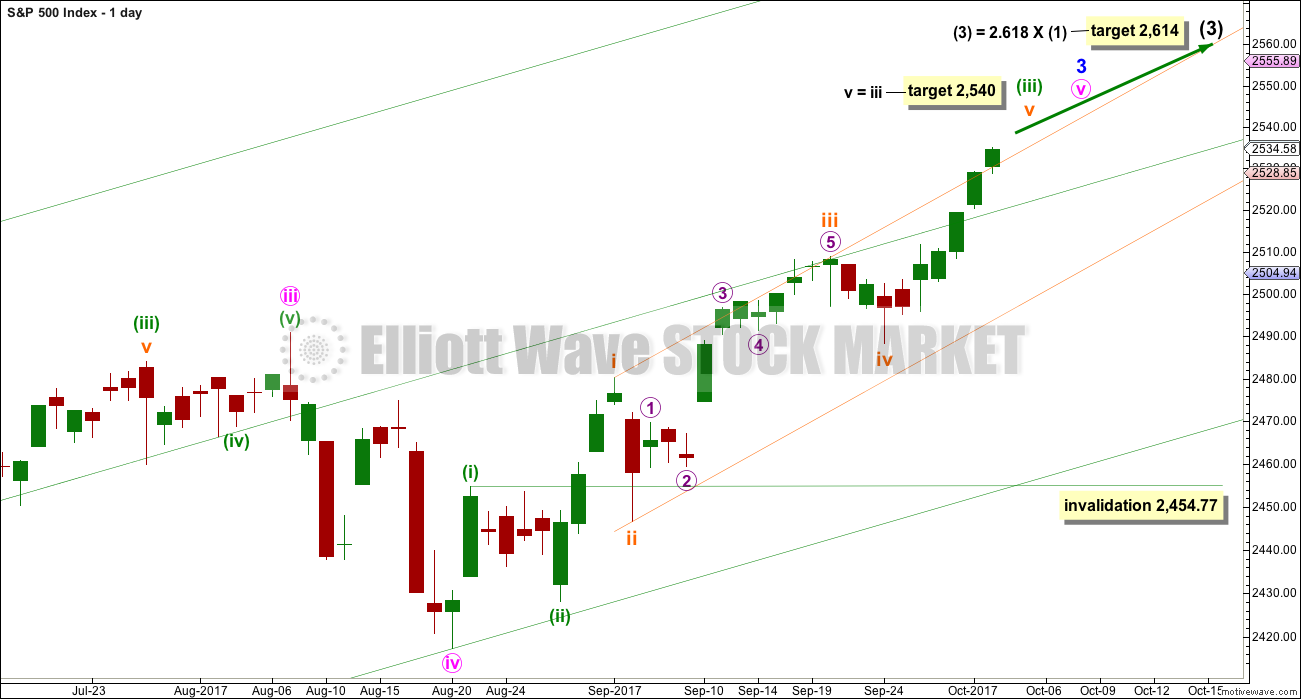
To see details of the whole of primary wave 3 so far see the analysis here.
Minute wave v to complete minor wave 3 must subdivide as a five wave structure. It looks like an incomplete impulse. So far it looks like minuette waves (i) and (ii) are complete with minuette wave (iii) now very close to completion.
When minuette wave (iii) is complete, then minuette wave (iv) may not move back down into minuette wave (i) price territory below 2,454.77.
A new target is calculated for minuette wave (iii) to end. The target would see no Fibonacci ratio at minuette degree, but it would see a ratio at subminuette degree within minuette wave (iii).
So far minuette wave (iii) has lasted 24 sessions. The structure is still incomplete at the hourly chart level, so it may not exhibit a Fibonacci duration.
HOURLY CHART
Click chart to enlarge.
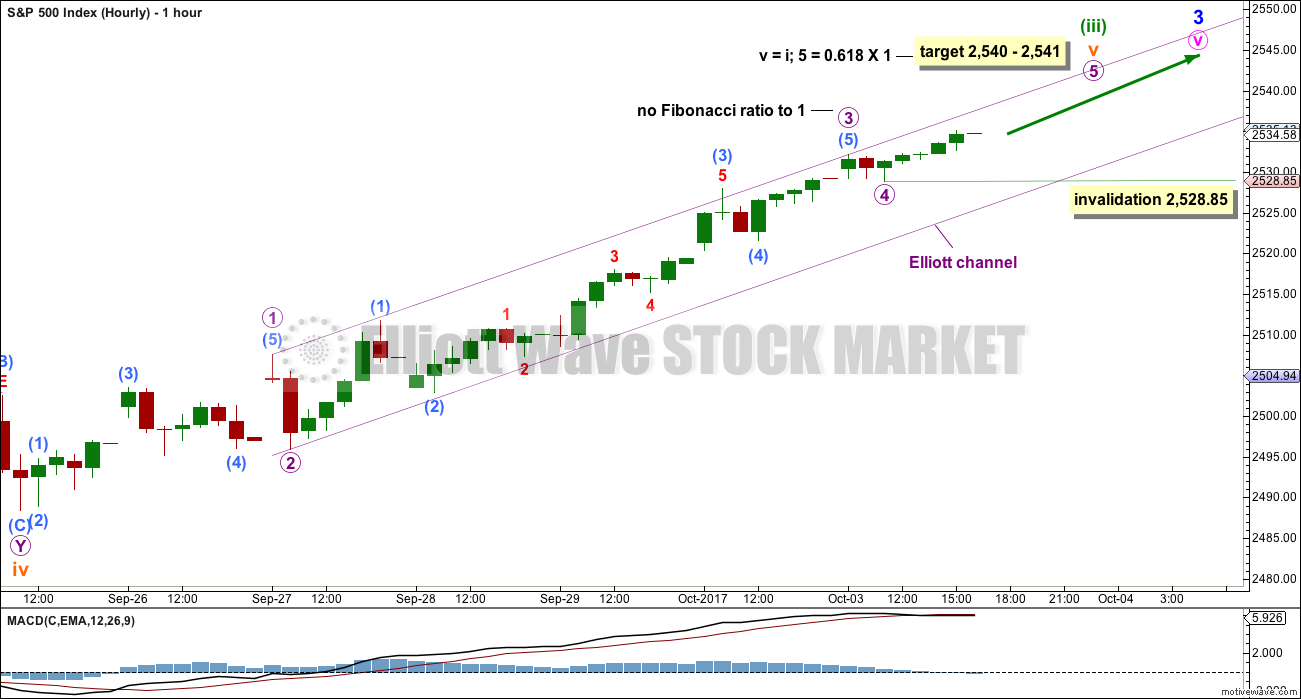
The target is widened now to a 1 point zone calculated at two wave degrees. It would see the most common Fibonacci ratio of equality between subminuette waves v and i, and a less common ratio at micro degree for micro wave 5.
Within micro wave 5, no second wave correction may move beyond the start of its first wave below 2,528.85.
The orange Elliott channel about minuette wave (iii), which can be seen on the daily chart, is here removed from the hourly chart because it is no longer showing where price is finding resistance along the way up. The smaller violet channel about subminuette wave v may now be a better guide. Micro wave 5 may end at the upper edge of this channel. When this channel is breached by downwards movement, that shall be the earliest indication that minuette wave (iii) may be over and minuette wave (iv) may have begun.
When minuette wave (iii) is over, then minuette wave (iv) may last about five to eight sessions. It would most likely be a shallow sideways consolidation to exhibit alternation with the deep zigzag of minuette wave (ii).
TECHNICAL ANALYSIS
WEEKLY CHART
Click chart to enlarge. Chart courtesy of StockCharts.com.
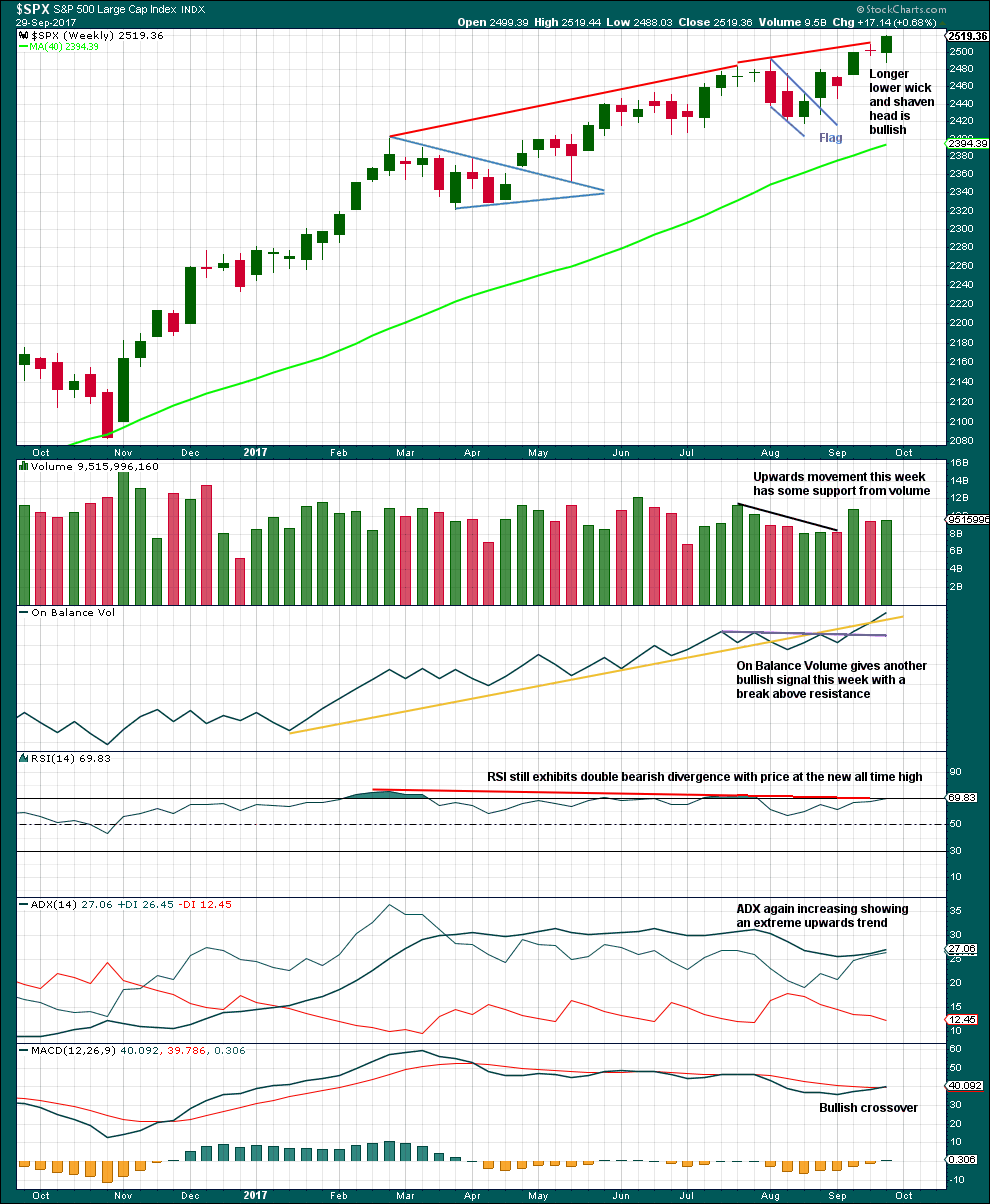
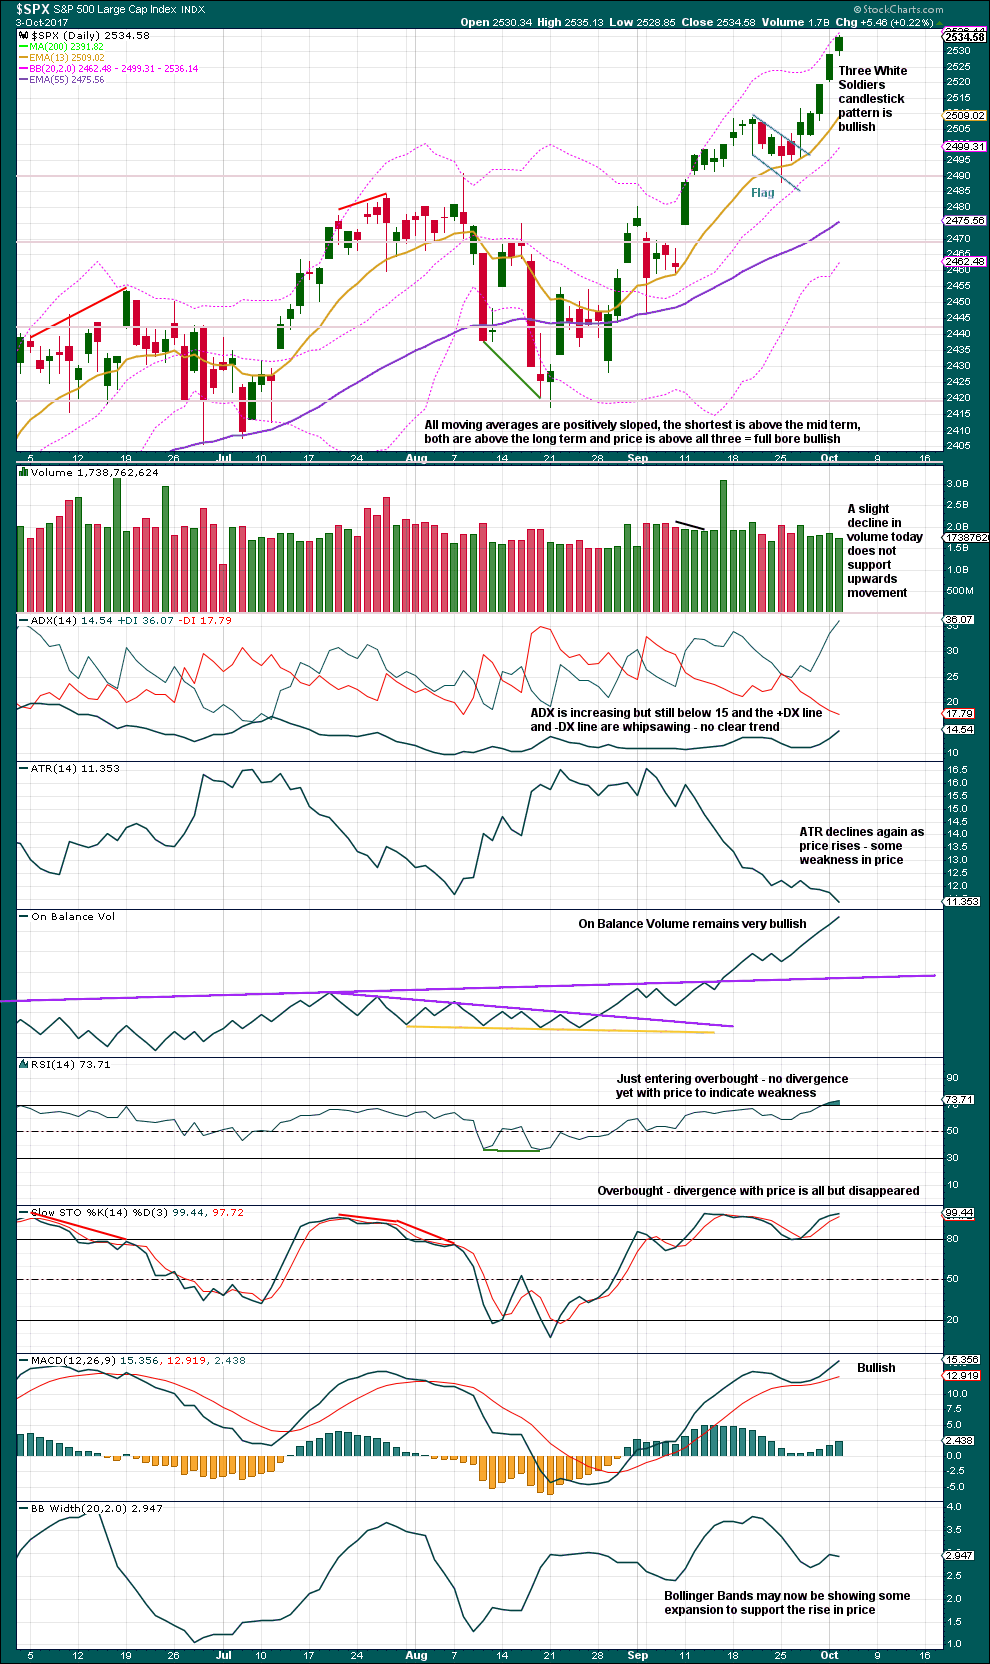
The candlestick is bullish. On Balance Volume is very bullish. MACD is now bullish. ADX remains bullish.
ADX is extreme but not by much.
This analysis strongly supports the main Elliott wave count. The trend is up. Keep all trades with the trend. Always use stops as there is always risk to the downside. Invest only 1-5% of equity on any one trade to manage risk.
From the small flag pattern, using the measured rule gives a target about 2,520; this is nicely close to the Elliott wave target.
DAILY CHART
Click chart to enlarge. Chart courtesy of StockCharts.com.
This chart remains very bullish. Only a slight decline in volume today indicates any weakness. This slight decline on its own should not be taken as a sign that a high is in place.
The Three While Soldiers is a bullish candlestick pattern. Each candlestick is closing at or near its highs, showing a steady increase in price. The pattern, which shows some strength ahead, appears after a small consolidation. The only note of caution from Nison would be that it is not appearing at an area of low prices, quite the opposite.
Stochastics may remain extreme for long periods of time for this market when it is in a strong bull trend. Wait for RSI to now begin to show some divergence with price while overbought before looking out for a trend change. There is no indication today of a high in place. There is no divergence between price and RSI and RSI has only just entered overbought.
With RSI now overbought, traders should be disciplined with risk management. There will be a correction coming up, probably not quite yet, but when it does arrive soon it may begin with a violent downwards movement.
VOLATILITY – INVERTED VIX CHART
Click chart to enlarge. Chart courtesy of StockCharts.com.
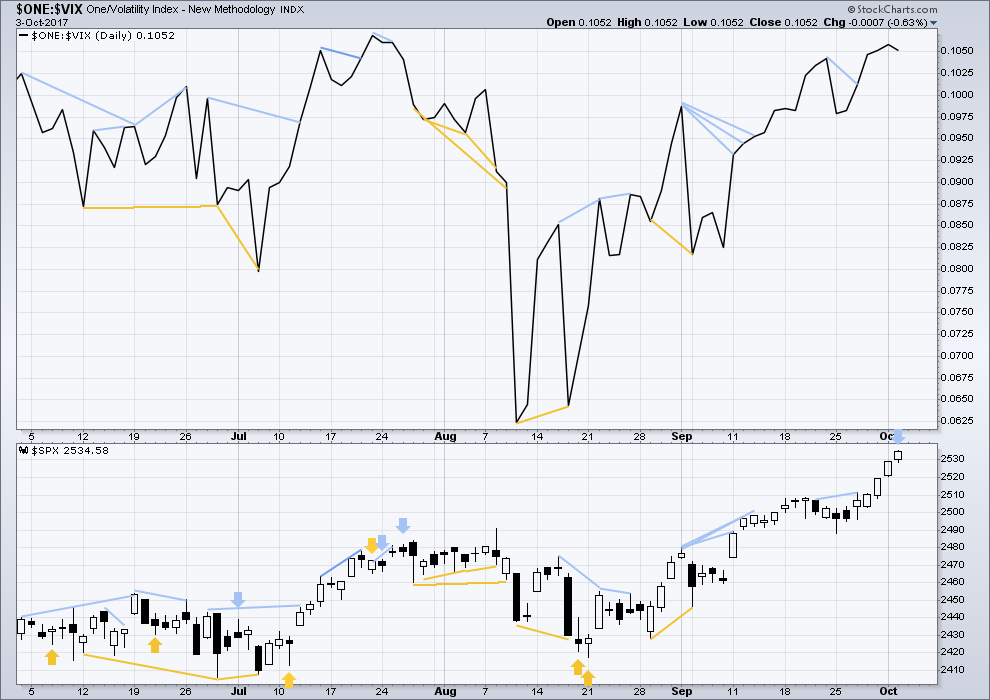
Normally, volatility should decline as price moves higher and increase as price moves lower. This means that normally inverted VIX should move in the same direction as price.
There is still mid and longer term bearish divergence, but it has been noted in the past that divergence over a longer term does not seem to work as well for VIX. Short term bearish divergence has disappeared.
There is single divergence today with price and inverted VIX: volatility increased while price moved higher. This indicates some weakness within price and will be interpreted as bearish.
BREADTH – AD LINE
Click chart to enlarge. Chart courtesy of StockCharts.com.
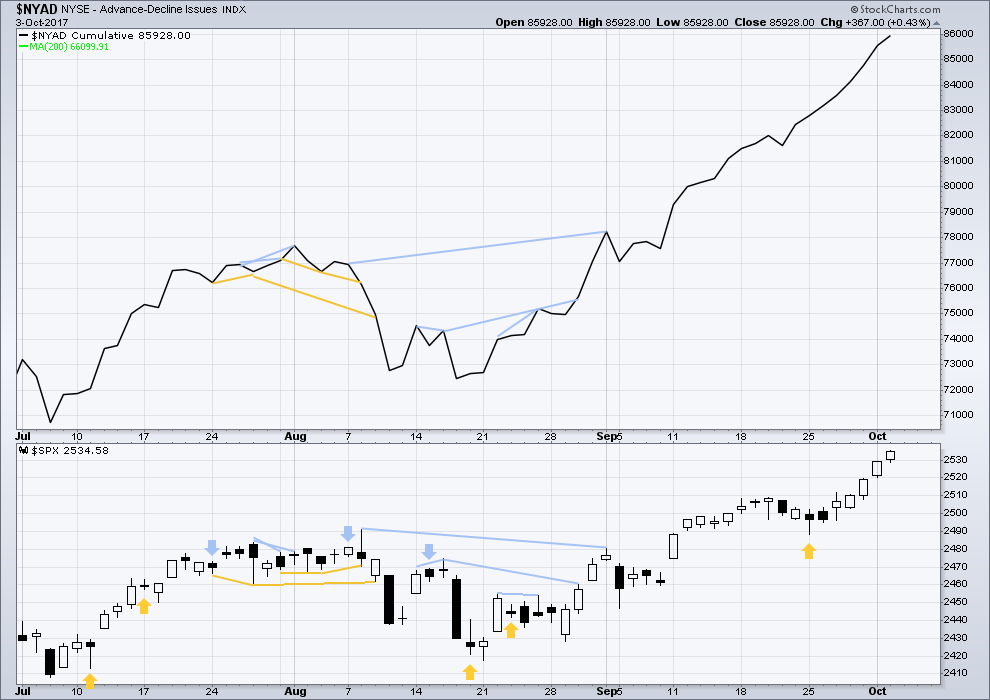
With the last all time high for price, the AD line also made a new all time high. Up to the last high for price there was support from rising market breadth.
There is normally 4-6 months divergence between price and market breadth prior to a full fledged bear market. This has been so for all major bear markets within the last 90 odd years. With no divergence yet at this point, any decline in price should be expected to be a pullback within an ongoing bull market and not necessarily the start of a bear market.
The rise in price today is again supported by a rise in market breadth. The AD line continues to remain very bullish.
The mid and small caps have also made new all time highs. The rise in price is supported in all sectors of the market. Lowry’s measures of supply and demand continue to show expanding demand and contracting supply, which is more normal for an early bull market. This market shows reasonable internal health.
Go with the trend. Manage risk.
DOW THEORY
The S&P’s new all time high is confirmed by DJIA and Nasdaq also making new all time highs. DJT has also now made new all time highs, so the continuation of the bull market is now confirmed.
The following lows need to be exceeded for Dow Theory to confirm the end of the bull market and a change to a bear market:
DJIA: 17,883.56.
DJT: 7,029.41.
S&P500: 2,083.79.
Nasdaq: 5,034.41.
Charts showing each prior major swing low used for Dow Theory are here.
Published @ 10:32 p.m. EST.
It’s all over!
What is….life as we know it, or worse? 🙂
Not quite yet… I’ve still two more days left…..
but yeah, I’m curious to see if they do or don’t stop pumping $$ into this market
if they stop, then we should know soon… but I guess it’s still possible that price could just drift up slowly higher and higher on weaker and weaker volume for a while, before it realises the floor has gone from underneath it
Any insights here on the possibility of gold having reached a bottom of this multi-week pullback? It’s showing me signs of various sorts.
It does look like Gold has put in at least an interim low.
It could be bouncing in a C wave of an expanded flat, or it could be up onto new highs.
My money will be on the expanded flat. My target for the bounce is 1,330 – 1,334.
Firmly back in the green on my KSS puts. They were relentless in trying to squeeze out shorts and I happily averaged cost down as they ramped it higher. As I said, if thinking it is a 40 dollar stock is delusional, at 45 is full blown insanity! 🙂
NDX triple top while RUT, SPX and DJI all blast to new highs. Now it’s time for a market pullback, and I like NDX for a short, given it’s very significant relative weakness. Possibly on a break below today’s lows.
Assuming minuette iii is complete…if minuette iv is as deep as minuette ii, price retraces to 2514.5 or so over the next 2-5 sessions. There’s so much nesting (so many extensions) in this move from Sept 25 that I think it’s really easy to get lost in the count, and I’m not at all certain minuette iii IS complete. But likely.
Keep an eye on VIX. It is continuing to stealthily diverge in the face of daily all-time highs being printed in all the indices. Do we have a possible double bottom in place?
Looking for a break above falling wedge around 10.25 with back-test Let’s see if they can smash in back into the red before the close. If they cannot that would be IMHO noteworthy…. 🙂
More than any eye on it, I bought some VXX. Market has hit target!! Time for a pullback. I also took profit on almost all my long positions, leaving 1/2 here and there with tight stops…but generally cashed. Here’s to a little “reversion to the mean” right about now!
Verne,
Here is a 5 Min chart of VIX and /VX from the recent 10 trading days. You can see that VIX started climbing since this Monday whereas /VX is staying Flat. How do you interpret this difference ? Should we take the strength in VIX seriously or wait till /VX joins the moves ?
I honestly do not know why we often see these stark divergence among various volatility instruments. I think it is safe to expect all other instruments to eventually follow the lead of VIX.
Futures markets anticipate (lead, most of the time), and the actual instruments follow. This is true of SPX and SPX futures, and of VIX and VIX futures. VIX in and of itself doesn’t particularly anticipate future moves: it is a function of the historical action, almost exclusively. It won’t move until price moves, mostly. The futures market and the derived ETF’s will somewhat anticipate price moves and VIX moves. That’s my understanding, I could be wrong.
I have seen it go both ways. VIX technically speaks to the 30 day window for implied vol. I have seen VIX turn up sharply while the futures instruments lagged, with sometimes the exact opposite happening so how they react to market price is not always consistent and I have no idea why.
When traders think of mean reversion, I seriously doubt esoteric mathematical equations are what come to mind. Of course we need such formulae to know whether we are talking 1, 2 or three standard deviations.
Most experienced traders I know think of mean reversion in terms of displacement (or velocity). We know bear markets unfold much more quickly than bull markets. A velocity of ten kilometers per hour will take you 10 hours to travel 100 kilometers. At 100 KPH you will do it in 1 hour. If we are in a corrective wave at high degree, the entire move since 2009 will ultimately be re-traced, new all time highs notwithstanding. Some of you are going to say: What on earth is he rambling about?
Some are going to say…Aha! 🙂
Verne it could also very easily be stated in terms of fundamentals; to which there is no debate. From these valuations; 10 year returns are 2 percent at best and negative 30 to mean revert back to long term averages.
Yes Chris. Excellent points on historical market returns. Earnings per share has been seriously distorted by share buybacks, but if you look at price to sales ratio, you get a true sense of how insane valuations are. I just smile when I hear folk contending there is anything normative about what we are seeing, and thus no expectation of mean reversion…
Re: reversion to the mean: there is no such principle that applies to random INDEPENDENT events, such as flipping a coin. If you flip 100,000x, and the sum is +500 tails…there is no “reversion to zero” principle that applies to future flips. On the other hand, the balance of high to low cards (K-T vs. 3-6’s) in a deck of cards (blackjack), when out of balance after dealing 20 cards (say, 3 extra K-T’s) WILL revert to the mean by the time the entire deck is dealt. In between these two absolute examples are things like baseball: if a hitter is career and season .280 hitter, and suddenly for 10 games is batting .400, it ain’t gonna continue. Where the stock market is in all of this is anyone’s guess, but note the long term history of the market: it’s UP. No reversion any mean (if one could even be defined). So IMO, such a concept doesn’t really apply to the market.
So…are you saying that you believe the movement of markets to be both random and independent? 🙂
Nope. Just no reversion to mean principle. Although somewhere out on the web is a graphing program showing the graphed results of flipping coins many thousands or even millions of times. The graphs have awesome trends, patterns, etc. They look just like stock charts. Don’t know what that means though.
If you are correct in that viewpoint then I am in big trouble it would seem. I put on a few trades based soley on that mean reversion principle you so blithely disparage, namely that sometime in the next ninety days VIX will trade above 13.50
I guess I am going to have to just get rid of my Bollinger bands. 😉
You’re okay, brownian motion will still save you!
Actually, re: “volatility” meaning VIX which really means the price of options on SPX…YES, that clearly wobbles around some kind of mean. And when it’s at extremes (which it is now, but it’s the bullish extreme and can last for very periods of time!), it is arguably an “easy trade”, because it will revert, pretty much guaranteed. I once pushed scaled in $400k into XIV on that theory as it fell from $70 to $17. My average was $36. I was out about $220k at the worst…but I held. I held under the theory “volatility will settle back down!!”. It did, and I exited break even at $36. Oops. You know the rest of the story: peaked a year later at $97. Good theory, bad execution!! Lol!!! Oh to see it at $17 again…I would put EVERY PENNY I OWN into it, because that WILL “revert to the mean”.
The volatility mean (VIX) has been declining for years now so the smart trade during that period has been to short volatility. The spikes have been short lived and hitting lower highs. That pattern will eventually go the opposite direction and it will be interesting to see how long it takes the herd to recognize that has happened.
I’ve been thinking about the comment made yesterday by Curtis regarding how quickly sentiment can change on this forum. I think it happens when we have a switch of the main (preferred) wave count with an alternate that is diametrically opposed to the main count. This happened recently as we switched out the count calling for a substantial correction as a fourth wave for the current count calling for the completion of a equally large third wave. We went from expecting to see a correction towards sub 2400 to a continuing bull market towards plus 2600. So as members digest and accept the change, sentiment shifts and can do so quickly. EW can do this and do it often. Thanks Curtis for your observation and insight.
My thoughts – I am looking for at least a short term top any day now. I will accumulate some bearish positions and add to them if we see confidence / confirmation points. The trouble is if we enter a longer protracted 4th wave correction that has 23 possible structures. These can be brutal to trade. Right now, I am 100% on the sidelines.
Have a great day to all.
I banked a small profit on Friday. Could have stayed in for more, but that’s okay. I’m out too, right now, waiting for another pull-back to rejoin the trend.
I too banked some profits recently as I closed out my longs just above SPX 2500. I too could have waited longer. But I was going out of town for a week and did not want to leave it at risk. Better to have the profit in the bank than to see it vanish. I continue to heed Vern’s caution, we could see the start of some large correction any day.
By my amateur count at the 15 minute bar level, it appears that price completed a small 4 this morning, and is very close to completing the circle 3 right around the target price area (I have 2538.5, Lara has 2540), and the circle 4 should (per Hoyle, Elliott and Lara) take price back over 3-8 days to the 2522-2528 area (the area of the 4 of the circle 3 wave). Then another 5 wave up. I will continue to aggressively work the long side.
Welp, I am the first today woohoo!
Anyway it does seem that there is more room upwards to go. The strength of this upward thrust continues to astound.