Price continues higher as expected, well exceeding the last Elliott wave target and a classic analysis target using the measured rule.
Summary: On Balance Volume and the AD line remain very bullish, supporting the main Elliott wave count. The next short term target is at 2,540. A mid term target for members with a longer horizon is at 2,614.
Always trade with stops and invest only 1-5% of equity on any one trade.
Last monthly and weekly charts are here. Last historic analysis video is here.
MAIN ELLIOTT WAVE COUNT
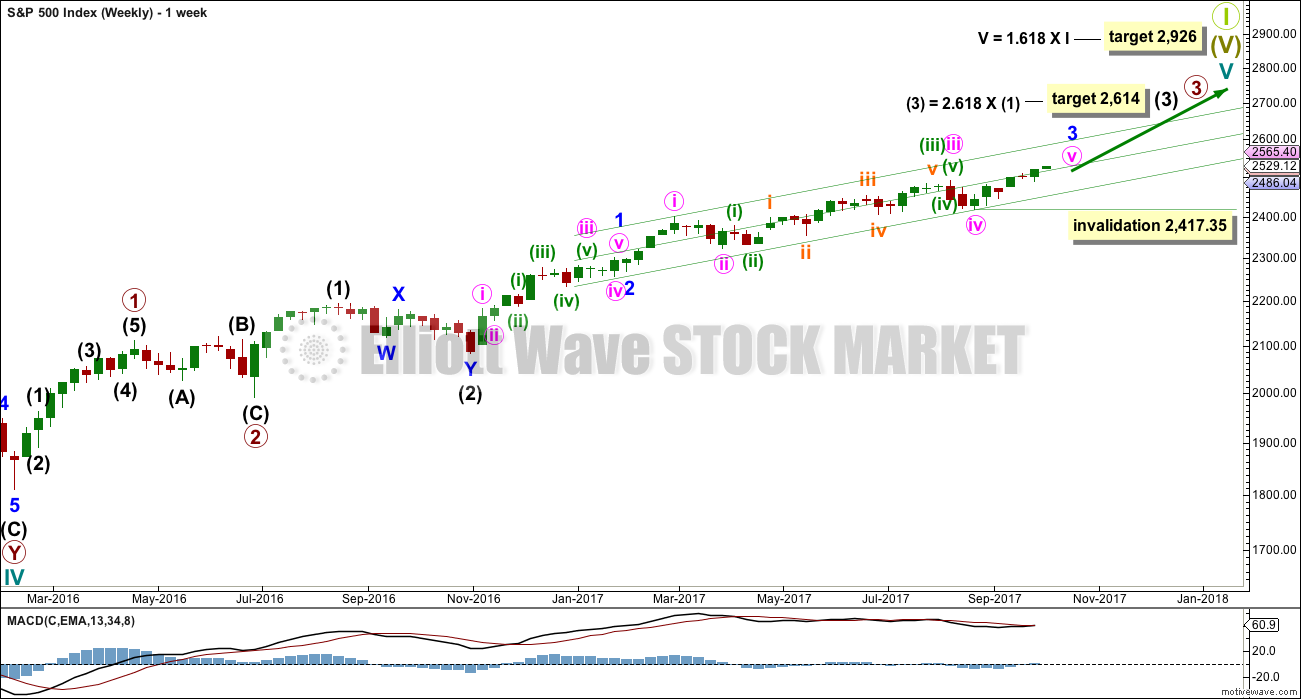
WEEKLY CHART
This wave count has strong support from another bullish signal from On Balance Volume at the weekly chart level. While classic analysis is still very bullish for the short term, there will be corrections along the way up. Indicators are extreme and there is considerable risk to the downside still.
If primary wave 3 isn’t over, then how would the subdivisions fit? Would it fit with MACD? What would be the invalidation point and would the Fibonacci ratios be adequate?
Of several ideas I have tried, this one has the best fit in terms of subdivisions and meets all Elliott wave rules.
Despite this wave count appearing forced and manufactured, and despite persistent weakness in volume and momentum for this third wave, On Balance Volume does now strongly favour it. It may be that as a Grand Super Cycle wave comes to an end, that weakness may develop and persist for very long periods of time (up to three years is warned as possible by Lowry’s for the end of a bull market), so this weakness may be viewed in that larger context.
Within minute wave v, no second wave correction may move beyond the start of its first wave below 2,417.35.
The next reasonable correction should be for intermediate wave (4). When it arrives, it should last over two months in duration, and it may find support about the lower edge of this best fit channel. The correction may be relatively shallow, a choppy overlapping consolidation, at the weekly chart level.
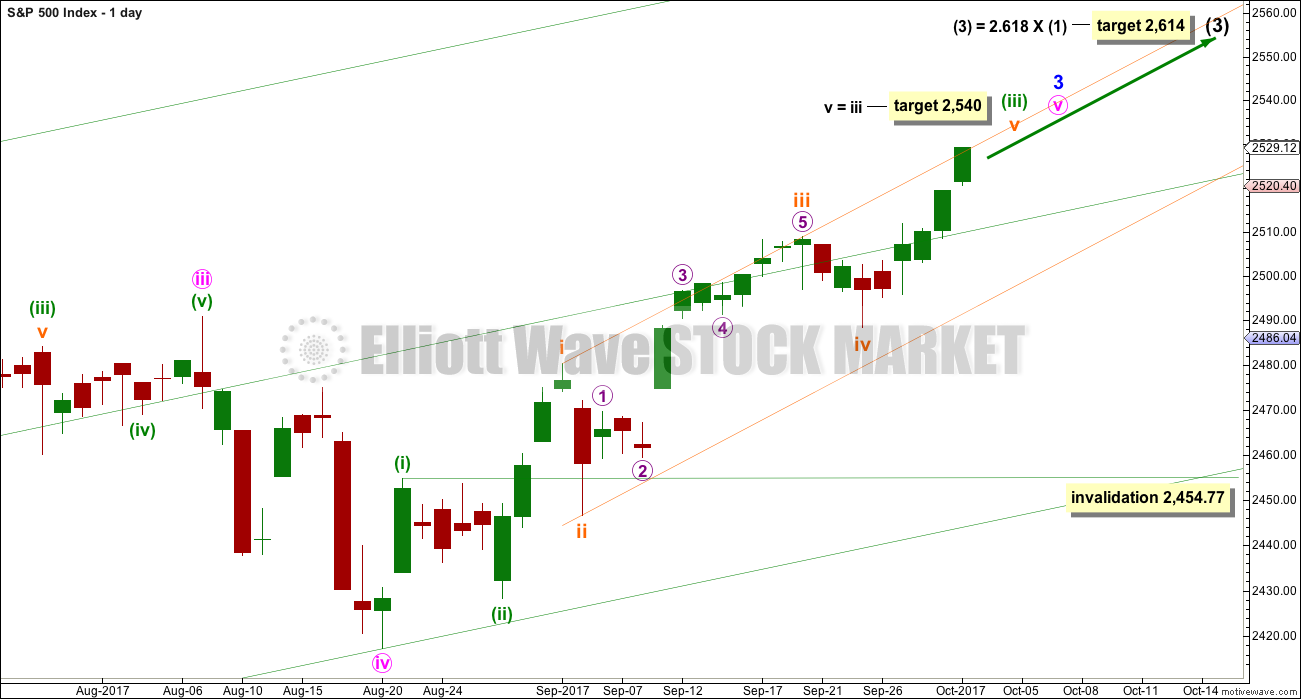
DAILY CHART
To see details of the whole of primary wave 3 so far and compare and contrast with the alternate wave count, see the analysis here.
Minute wave v to complete minor wave 3 must subdivide as a five wave structure. It looks like an incomplete impulse. So far it looks like minuette waves (i) and (ii) are complete with minuette wave (iii) now very close to completion.
When minuette wave (iii) is complete, then minuette wave (iv) may not move back down into minuette wave (i) price territory below 2,454.77.
A new target is calculated for minuette wave (iii) to end. The target would see no Fibonacci ratio at minuette degree, but it would see a ratio at subminuette degree within minuette wave (iii).
So far minuette wave (iii) has lasted 23 sessions. The structure is still incomplete at the hourly chart level, so it may not exhibit a Fibonacci duration.
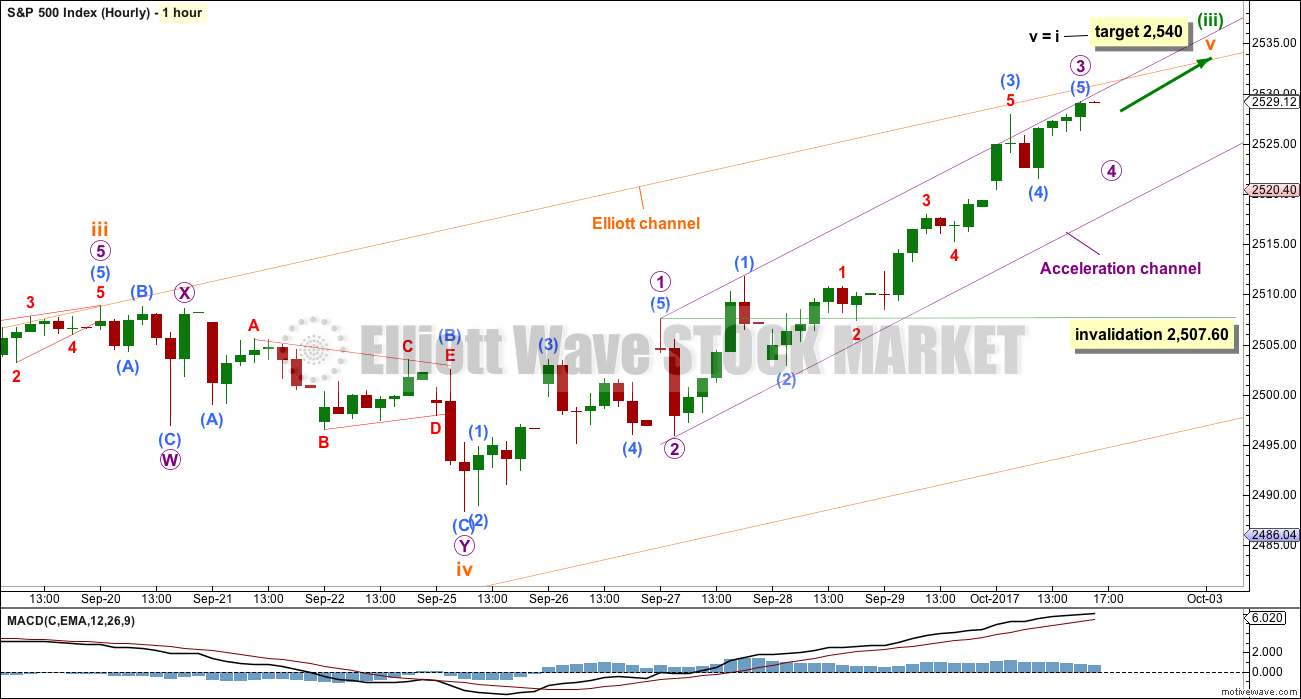
HOURLY CHART
The recalculated target would see the most common Fibonacci ratio between subminuette waves i and v.
The middle of the third wave has a good five wave look to it on the hourly chart.
Within the middle of the third wave, micro wave 4 may not move into micro wave 1 price territory below 2,507.60.
Keep redrawing the acceleration channel as price moves higher. When micro wave 3 is over, then that shall be an Elliott channel which may show where micro wave 4 may find support.
A subsequent breach of that channel by downwards movement would then indicate an end to subminuette wave v and so an end to minuette wave (iii).
Minuette wave (iii) may end about the upper edge of the orange Elliott channel. This suggests it may be closer to completion than the target calculation expects. Use the violet channel in the manner already described to indicate when minuette wave (iii) is indeed over.
ALTERNATE WAVE COUNT
WEEKLY CHART
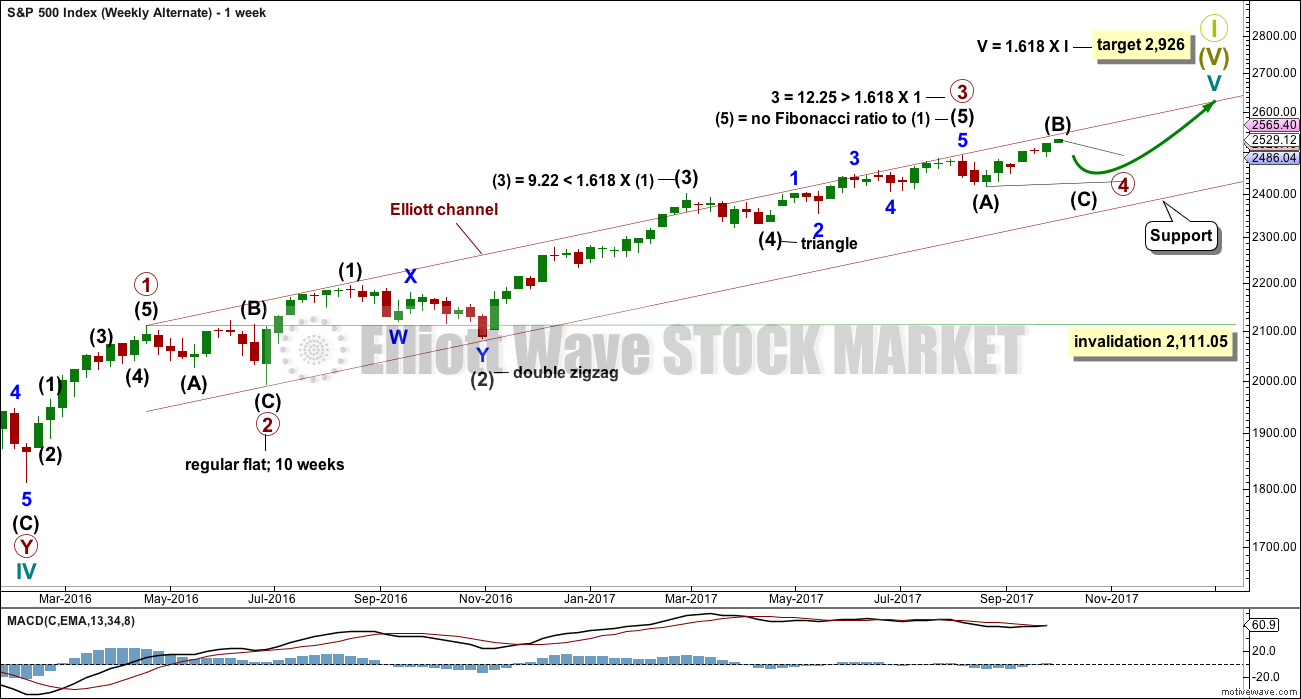
Primary wave 3 may be complete. Confidence may be had if price makes a new low below 2,488.38 now. That would invalidate the main wave count at the daily chart level. Fibonacci ratios are calculated at primary and intermediate degree. If primary wave 3 is complete, then it still exhibits the most common Fibonacci ratio to primary wave 1.
Primary wave 4 may not move into primary wave 1 price territory below 2,111.05.
Primary wave 4 should last about 8 weeks minimum for it to have reasonable proportion with primary wave 2. It is the proportion between corrective waves which give a wave count the right look. Primary wave 4 may last 13 or even 21 weeks if it is a triangle or combination. So far it may have completed its sixth week.
If primary wave 4 unfolds as a single or double zigzag, then it may find support about the lower edge of the maroon Elliott channel. If it is a triangle or combination, it may be more shallow, ending about mid way within the channel. At this stage, a single zigzag has been invalidated and a double zigzag is discarded based upon a very low probability. It looks like primary wave 4 is to be a very shallow sideways consolidation rather than a deeper pullback.
Only two daily charts are now published for primary wave 4: a triangle and a combination. It is impossible still for me to tell you with any confidence which of these two structures it may be. The labelling within each idea may still change as the structure unfolds.
The daily charts are presented below in order of probability based upon my judgement.
The final target for Grand Super Cycle wave I to end is at 2,926 where cycle wave V would reach 1.618 the length of cycle wave I.
DAILY CHART – TRIANGLE
As price moves higher the probability of this alternate wave count decreases every day. At this stage, it has almost no support from classic technical analysis; it should only be used if confidence points are passed and price shows us it is more likely.
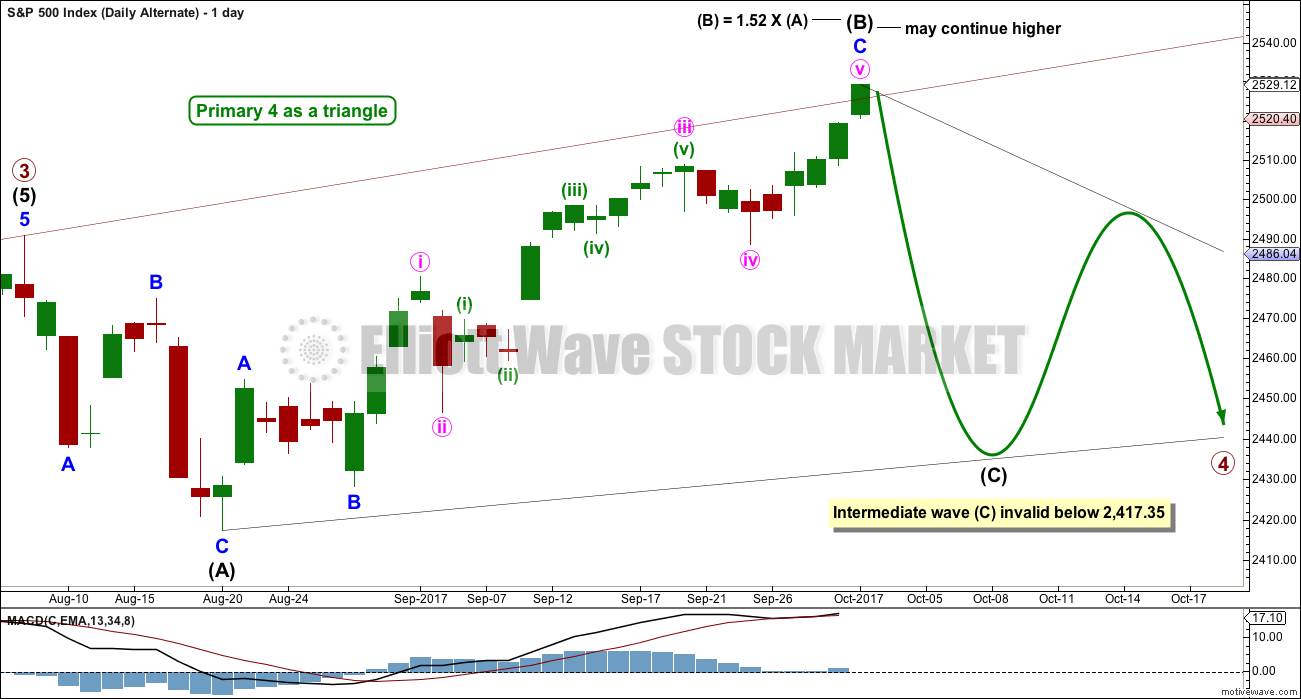
This first daily chart will illustrate how price might move if primary wave 4 unfolds as a triangle.
Intermediate wave (B) may be a single zigzag. One of the five sub-waves of a triangle should be a more complicated multiple; most commonly that is wave C. If intermediate wave (B) is correctly labelled as a single zigzag, then intermediate wave (C) may be a longer lasting and more complicated double zigzag.
The triangle may last a total of a Fibonacci 13 or 21 weeks.
Both intermediate waves (A) and (B) look like three wave structures.
Intermediate wave (C) may not move beyond the end of intermediate wave (A).
This would be a running triangle, which allows for intermediate wave (B) to move beyond the start of intermediate wave (A). About 40% of triangles are running triangles; this is not a rare structure, so this wave count remains viable.
HOURLY CHART
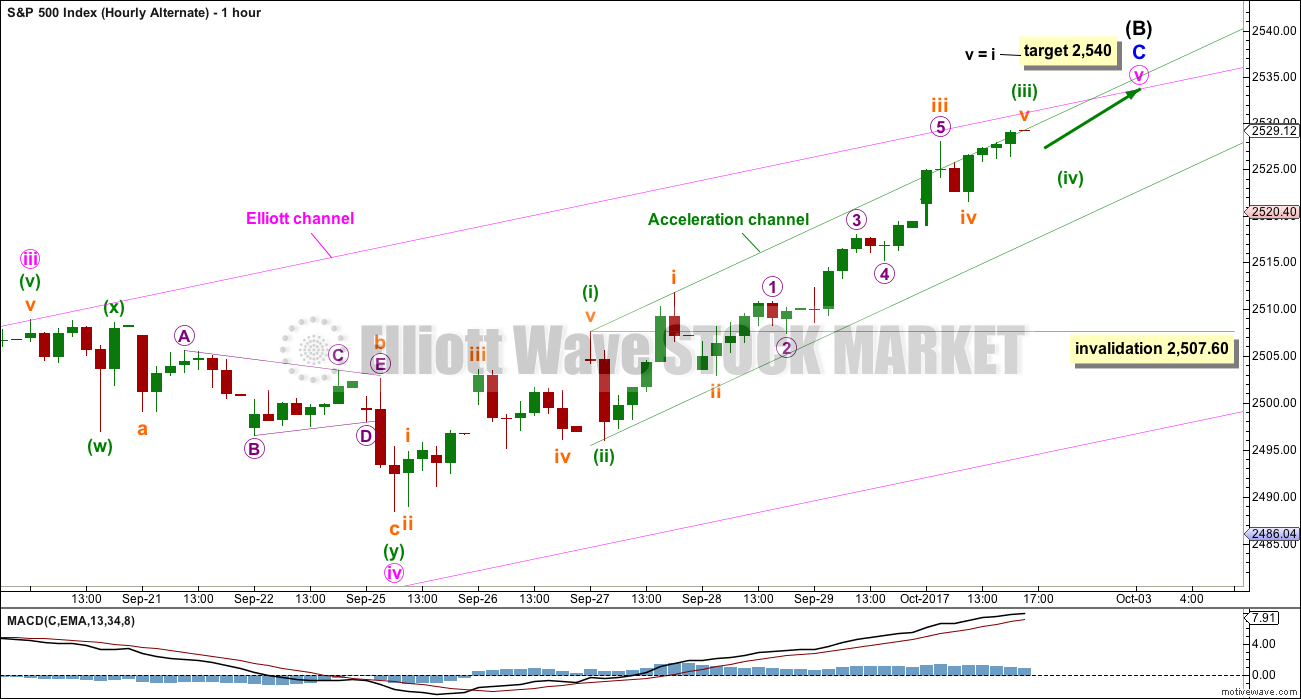
Intermediate wave (B) may be continuing higher. It is again possible that the structure is complete, but there is no evidence yet of a reversal.
This wave count is now less likely. But it remains possible because running triangles are not rare structures and intermediate wave (B) is within a normal length.
However, this wave count does not have much support from classic technical analysis. It must be understood to be a less likely alternate at this stage.
At this stage, both wave counts will see the current upwards wave in the same way; both wave counts for the short term will expect more upwards movement.
DAILY CHART – COMBINATION
A combination for primary wave 4 would still offer some alternation with the regular flat of primary wave 2. Whenever a triangle is considered, always consider a combination alongside it. Very often what looks like a triangle may be unfolding or may even look complete, only for the correction to morph into a combination.
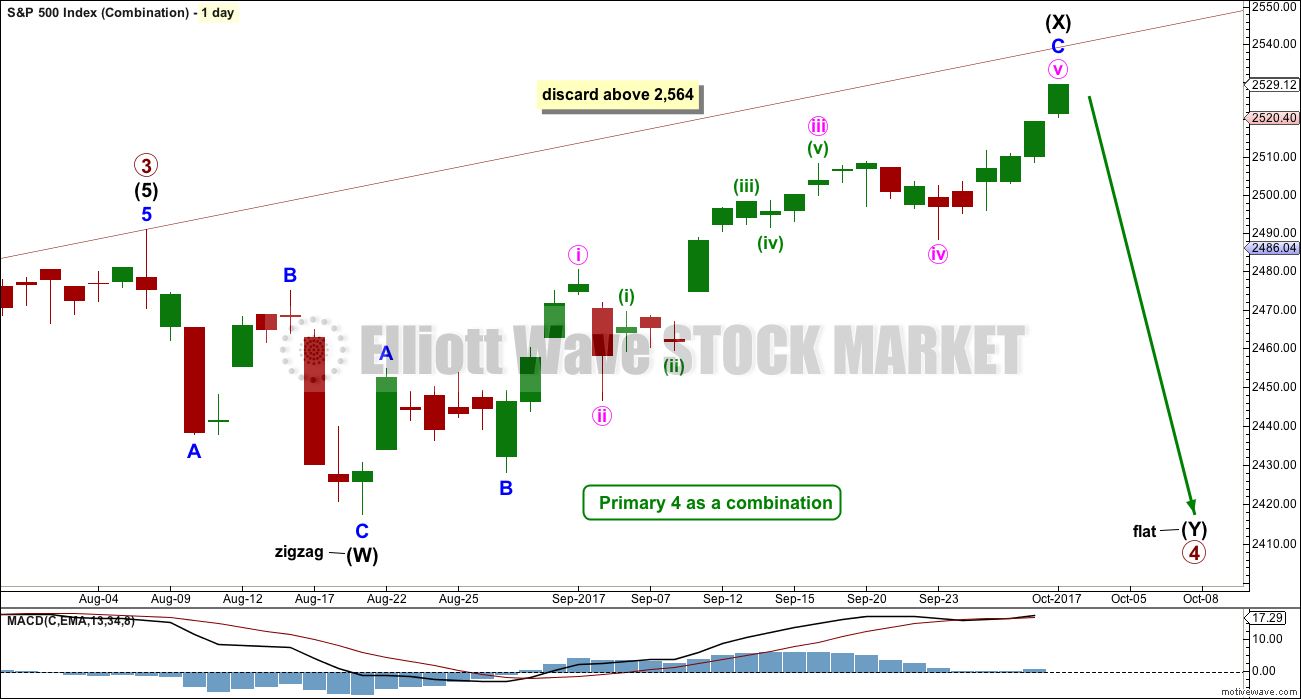
There may only be one zigzag within W, Y and Z of a combination (otherwise the structure is a double or triple zigzag, which is very different and is now discarded). At this stage, that would be intermediate wave (W), which is complete.
Combinations are big sideways movements. To achieve a sideways look their X waves are usually deep (and often also time consuming) and the Y wave ends close to the same level as wave W.
This wave count sees upwards movement continuing as intermediate wave (X). Unfortunately, there is no Elliott wave rule regarding the length of X waves, so they may make new price extremes. I am applying the convention within Elliott wave regarding B waves within flats here to this X wave within a combination: When it reaches more than twice the length of intermediate wave (W), then the idea of a combination continuing should be discarded based upon a very low probability.
With intermediate wave (W) a zigzag, intermediate wave (Y) would most likely be a flat correction but may also be a triangle. Because a triangle for intermediate wave (Y) would essentially be the same wave count as the triangle for the whole of primary wave 4, only a flat correction will be considered.
But first, an indication would be needed that the upwards wave of intermediate wave (X) is over. As yet there is no evidence of this.
TECHNICAL ANALYSIS
WEEKLY CHART
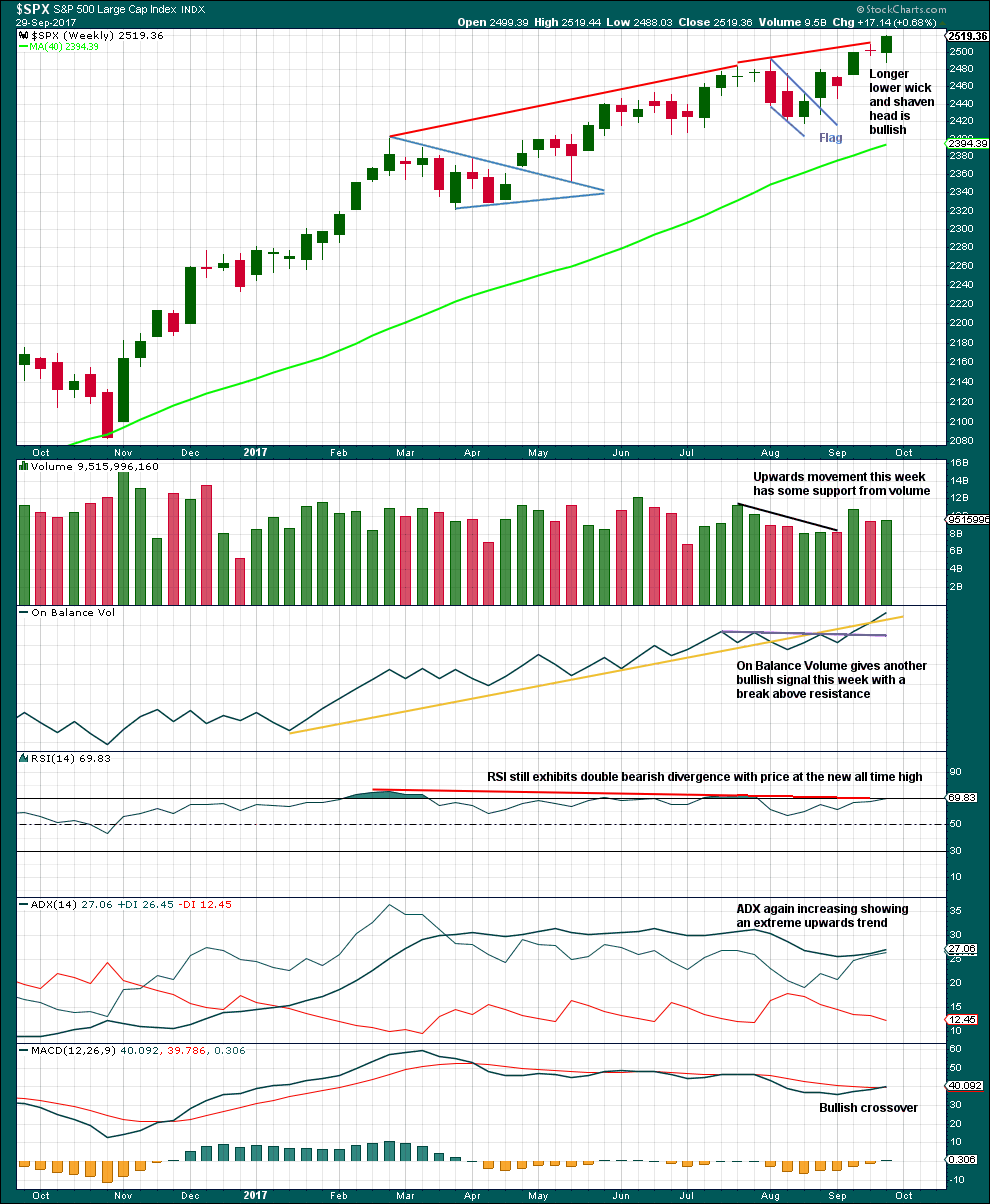
Click chart to enlarge. Chart courtesy of StockCharts.com.
The candlestick is bullish. On Balance Volume is very bullish. MACD is now bullish. ADX remains bullish.
ADX is extreme but not by much.
This analysis strongly supports the main Elliott wave count. The trend is up. Keep all trades with the trend. Always use stops as there is always risk to the downside. Invest only 1-5% of equity on any one trade to manage risk.
From the small flag pattern, using the measured rule gives a target about 2,520; this is nicely close to the Elliott wave target.
DAILY CHART
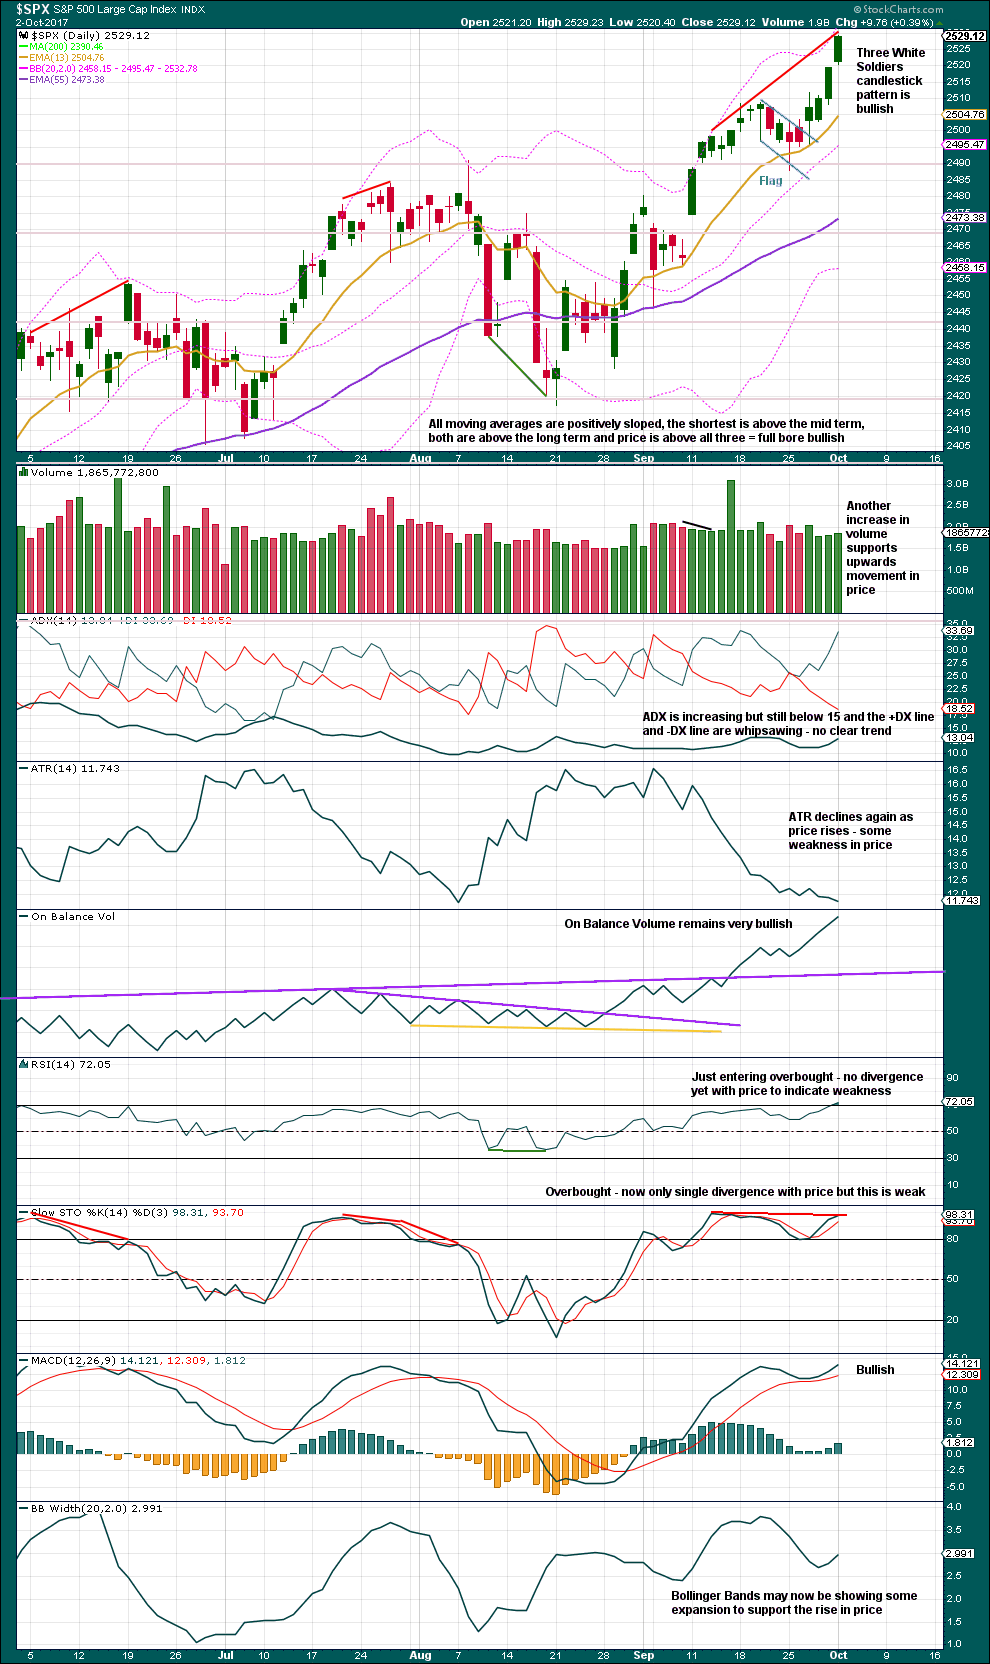
Click chart to enlarge. Chart courtesy of StockCharts.com.
This chart is very bullish.
The Three While Soldiers is a bullish candlestick pattern. Each candlestick is closing at or near its highs, showing a steady increase in price. The pattern, which shows some strength ahead, appears after a small consolidation. The only note of caution from Nison would be that it is not appearing at an area of low prices, quite the opposite.
Stochastics may remain extreme for long periods of time for this market when it is in a strong bull trend. Wait for RSI to now begin to show some divergence with price while overbought before looking out for a trend change.
VOLATILITY – INVERTED VIX CHART
Click chart to enlarge. Chart courtesy of StockCharts.com.
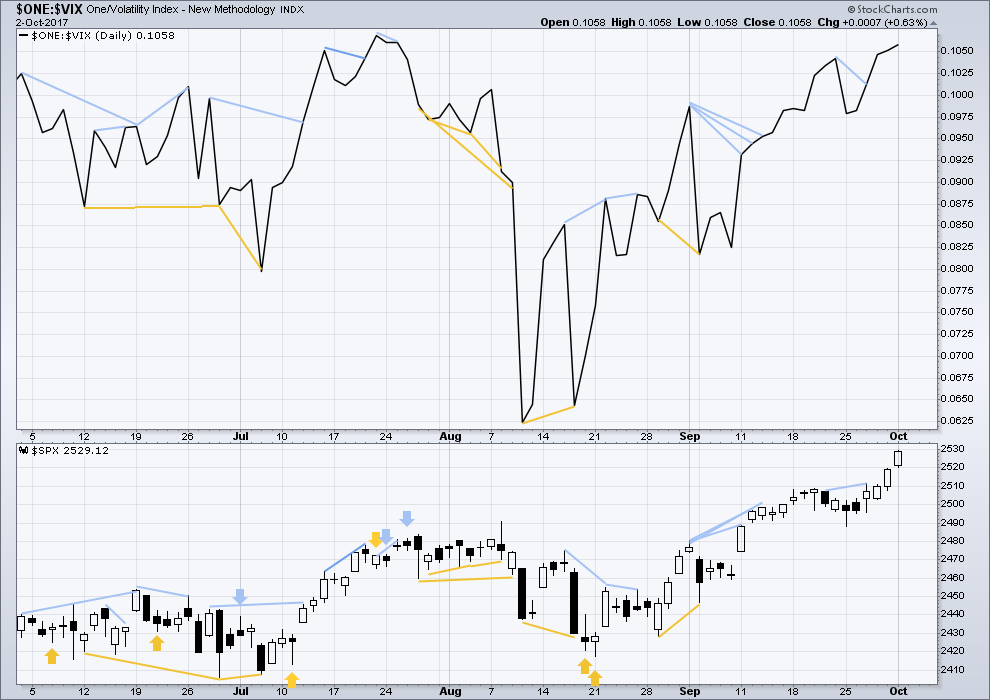
Normally, volatility should decline as price moves higher and increase as price moves lower. This means that normally inverted VIX should move in the same direction as price.
There is still mid and longer term bearish divergence, but it has been noted in the past that divergence over a longer term does not seem to work as well for VIX. Short term bearish divergence has disappeared.
There is no new short term divergence today. The rise in price came with a normal corresponding decline in market volatility.
BREADTH – AD LINE
Click chart to enlarge. Chart courtesy of StockCharts.com.
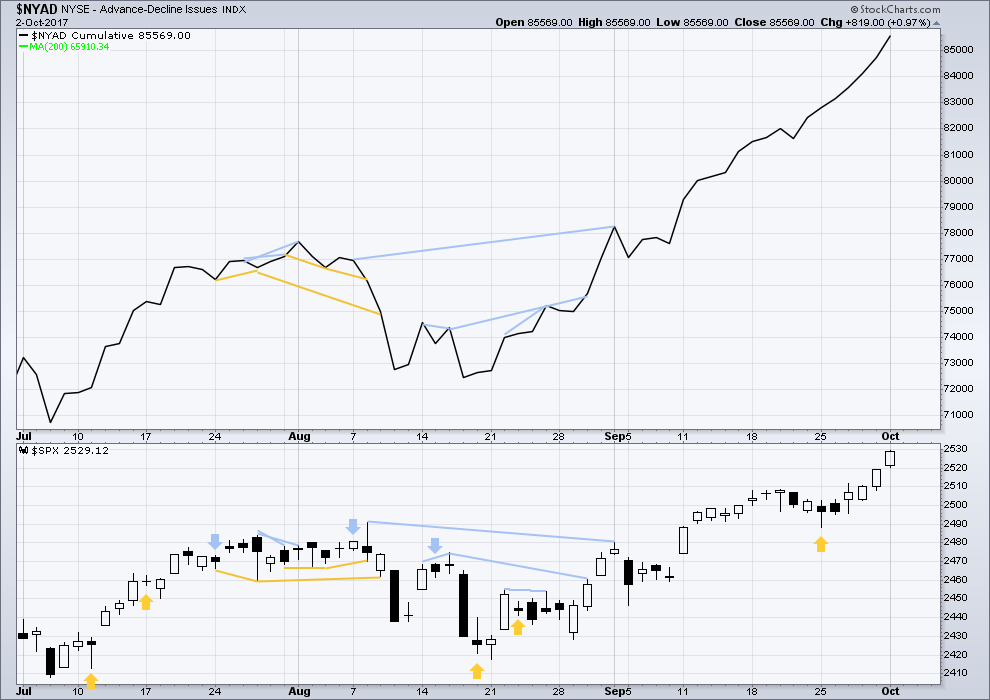
With the last all time high for price, the AD line also made a new all time high. Up to the last high for price there was support from rising market breadth.
There is normally 4-6 months divergence between price and market breadth prior to a full fledged bear market. This has been so for all major bear markets within the last 90 odd years. With no divergence yet at this point, any decline in price should be expected to be a pullback within an ongoing bull market and not necessarily the start of a bear market.
The rise in price today is again supported by a rise in market breadth. The AD line continues to remain very bullish.
The mid and small caps have also made new all time highs. The rise in price is supported in all sectors of the market. Lowry’s measures of supply and demand continue to show expanding demand and contracting supply, which is more normal for an early bull market. This market shows reasonable internal health.
Go with the trend. Manage risk.
DOW THEORY
The S&P’s new all time high is confirmed by DJIA and Nasdaq also making new all time highs. DJT has also now made new all time highs, so the continuation of the bull market is now confirmed.
The following lows need to be exceeded for Dow Theory to confirm the end of the bull market and a change to a bear market:
DJIA: 17,883.56.
DJT: 7,029.41.
S&P500: 2,083.79.
Nasdaq: 5,034.41.
Charts showing each prior major swing low used for Dow Theory are here.
Published @ 09:56 p.m. EST.

New ATH all around today; the trend is clearly up. My trigger for full blown bearish mode remains 2470.00 I see a few analysts are saying 2480.00 so we will see. If we are putting in a seeious top, the next wave down will take out both those levels in dramatic style. Until then, up, up, away! 🙂
Quantitatively, if this is 5 of 3, from the 4th wave low of 1816, this wave measures 718 SPX points. Even the shallowest of primary wave corrections will produce the 38.2% retrace which is 274 SPX points (2260), which ironically conforms to classic TA re-testing the November 2016 break out. IMHO, this is the most logical correction to occur at the end of this wave. Problem with that is, as Verne pointed out stops, pivots, go short signals are all clustered around 2470-2488 range. If that triggers a short-vol cover, that will trigger a margin call, which will trigger public selling etc etc etc. To put it in perspective, a .618 retrace would have the SPX revisit 2119 pivot that the market defended for years. Both of these scenarios would cause a bear scenario to be highly probable.
Yes sir. It is abundantly clear that absolutely no one expects even a mild correction, and not only because of what people are saying. but how they are trading- no fear whatsoever. A bounce at 2470-2480 means the banksters are still in, a high volume break, probably not. The problem is the breakout from that level was the green light for more upside leveraged trades and if it does not hold they will certainly bail. The tepid volume is a giveaway.
I have to admit that at times I have looked at this market and flirted with the idea that the principle of mean reversion might have to be revisited. If we think about the fact that we are possibly putting in a “500 year cycle” top, the extremes in a way ought to be something we would expect. They seem really extreme because none of us has witnessed a top of this degree previously, so the market is doing things none of us,( in fact no one since the market was created!) has ever witnessed. While I have absolutely no idea (nor does anyone else) when the mean reversion principle will re-assert itself, I am fairly confident that it will, and will do so with a ferocity commensurate with the extremity of the current deviation. If the presented premise is valid, what kind of mean reversion should we be expecting?! 🙂
Your premise isn’t valid becuase the market hasn’t topped. Let’s assume for a moment that it does though…what exactly makes this situation/top unique in all of history? I’m not aware of what’s unique here. It’s been a loooong time since a <5% pullback, but I don't believe even that interval is the longest ever. What's unique?
You are quite right. Here is what I actually said.
” If we think about the fact that we are possibly putting in a “500 year cycle” top,…”
ps My comments Kevin also had reference to historical economic cycles. If that topic is not familiar to you what I said of course would make little sense so don’t worry about it.
Verne, most analysts who study historical economic cycles agree that the Great Recession was this generation’s big “100 year crash” (the Great Depression being the last one before that). Banks have undergone a massive deleveraging since then. You could make an argument that the leverage was just transferred to the U.S. government, and that eventually the U.S. debt bubble will pop too, but there is no danger of that in the foreseeable future. There will always be an insatiable desire for U.S. treasuries.
There is a bigger cycle topping of 500 years. Although it is primarily associated with climate( warm wet to cold dry), there are huge economic implications…
I think from an Elliott wave perspective Verne is referring to the Grand Super Cycle wave which is in it’s final fifth wave at cycle and Super Cycle degrees now?
Grand Super Cycles should last generations.
The Great Depression was a second wave correction within this Grand Super Cycle wave. Just a correction.
So if this wave count is right, when it’s over there will be a crash that has not been seen for generations, which will be much bigger than the Great Depression. That’s the EW theory anyway.
You can find the analysis of Grand SuperCycle waves here.
But not yet. Not for another one to three years if Lowry’s are right.
For the active traders among you, SLCA appears to be initiating a new uptrend on the daily, and is already in an uptrend on the weekly. Chart attached (weekly, daily, hourly, 5 minute, around the clock starting top left).
A nice tip, thank you Kevin for sharing 🙂
I find it fascinating how bullish and bearish sentiment can swing so strongly back and forth even here within Lara’s comment section.
It’s that endless grind up for weeks that then disappears in 1 red trading day.
Curtis , where do you find S & P sentiment figures . Not talking about CNN fear and greed index , or Put / call . I was using a graph on Forex Trading News and Analysis ( dailyfx.co m ) that had a S & P graph . This was a sentiment index that showed open interest . It was posted daily on Forex Trading News for years , about a week ago they quit showing it . Anyone ?
My comment was about the swings of moods here on Lara’s site. As for sentiment indicators, price action alone should be sufficient. Add to that volume, breadth, VIX, yada, yada, yada…
🙂 Yes, it is interesting isn’t it.
Well, I keep saying to go with the trend. Because that’s how we’re all going to make money.
But the most frustrating thing for me is that when price just keeps marching up, and when I can get the analysis of that right, people keep cancelling their membership. And this site has a drop in membership.
But when we have big corrections, like we had in cycle wave IV in mid 2015 to beginning 2016, then new members flood in.
And so the longer this bull market runs the lower the membership is going to go if that pattern repeats. It doesn’t seem to matter so much what I do, it’s the market.
I have heard that technical analysis gets less popular and may become a pariah in a big bull market, and gets more popular in a bear market.
My membership numbers sure do look like that’s the case 🙁
That is truly ironic! Strange that folk don’t want to be kept on the right side of the trend is it mot? 🙂
It’s more to do with the lack of volatility I would think. Trying to time tiny downturns in a massive upwards wave is… not so rewarding, in general. I think most folks would just rather go long and forget about it. We have seen the virtual disappearance of volatility.
If volatility returns, people will presumably be more willing to try market timing strategies.
a very good point Jimmy
This weekly chart of SPX tells me a weekly level stall and pullback is right around the corner. Notice what happens when the weekly bar pushes through my upper channel line, historically: there’s a turn, back to or at least towards the center line. Only back in Feb. did weekly bars keep extending (for 2 more weeks), then turn. To me, it’s a clear warning bell that a larger pullback is looming pretty close by. (The channel lines are the average of 21 bar Bollinger Bands and 21 bar Keltner channels, at deviations of 2.) On the weekly main, I would expect such a pullback to be the minor (blue) 4 that is pending.
I think Chris Ciovacco would term that “volatility to ignore”.
For most traders, a pullback is another opportunity to enter long and join the trend.
NOT to go short, that’s only for the very experienced and nimble of those amongst you who like a quick scalp.
For newer and less experienced members, Chris is talking about a little pullback or consolidation. There will be those along the way up.
Honestly, the whole market has gone back to 1995-1999 era thinking. What’s amazing is that it looks like it’s happening 9 years in instead of 5 years in. This is not the price action of an aging bull market. This is the price action of a market that has years to run. We are just getting started.
For all the talk about bankster manipulation, the banks appear situated quite well and there is nothing to suggest a concerted effort to prop the markets up. Money flows suggest institutions are just chasing higher yields in the face of the new low rate paradigm. Goldman had a bad year trading 2016 and predicted 2300 for the S&P at year’s end. The bankers honestly don’t know any more than we do I’m afraid.
The technicals don’t lie though. As Lara mentioned, this is about as bullish as it gets. Traders too often fall for the gamber’s fallacy of “it can’t go up MORE”. There is no sense in timing low degree corrections when all the indices are hitting ATHs every day.
My Merrill friends keep pushing higher, higher, and higher. Saying this generation (millennials) will funnel more money into the markets than any before.
Jimmy & Joshua,
I agree with both of your assessments. I am waiting for an intermediate term pull back / correction to go long in my mid and long term accounts. I am looking for Lara’s 2900+ figure for the SPX. At this rate, it could happen in early to mid 2018.
Another boost to US equity markets is that foreigners are pouring money into US corporations and buying US dollars as the last safe havens. The Yen is crap. Europe is going to implode with debt. The US is the best safe haven available. We are just beginning this influx of trillions of dollars. Millennials will drive the markets higher. Combined with foreign funds it will drive markets much higher.
I guess I am the lone contrarian. For all kinds of reasons, I suspect this move up is terminal. 🙂
I don’t think it’s contrarian Verne, it’s simply common sense and understanding the present structure of the market. This absolutely has all the attributes of a terminal wave, and if the FED is telling the truth, they will not back stop the next decline. Further, the dollar is really loosing it’s settlement and reserve power abroad and this portends much worse than just a correction.
What was that Buffett quote again, oh yeah,”Be fearful when others are greedy and greedy when others are fearful.” A sub-10 VIX seems super greedy to me.
I am looking at charts, at sentiment, at volume, at the real economy, at geo-politics, at volatility etc. and finding it all hard to believe there is not more caution than I am seeing. Human nature never changes! 🙂
I’m happy to ride this terminal move up until it ends, taking my profits along the way. A bear market doesn’t materialize overnight. We are going to get clear and convincing evidence of a bear market starting, when it does. Meanwhile, I personally believe that as a trader, I have take advantage of tremendously bullish conditions while they exist, despite “suspicions”, “concerns”, “world politics”, etcetera. To not do so is to miss a very good opportunity for profits with lower levels of risk.
Yes, indeed!
No question Kevin, only price matters. However, what is coming is well worth preparing for and positioning for. IMHO there will not be any sign of it or time to get in, perhaps a large 2nd Wave, and the domino effects of ETFs, CDOs, Credit Risk Transfers, Short Volatility, Short GAMA, Negative Vega, Global Marco, over valuations, margin loans, lack of cash, etc etc will exploded all at once. ETFs are masking the alot of the structural, breadth, and trading risks in this market. Look at the standard deviation of durable goods to SPX, or top-line revenue to EPS; all that has occurred is a global concerted and successful move to create asset scarcity, which is why the markets are so utterly void of price discovery and will ultimately fall much further than they need to.
That is essentially my thinking Chris. What trading decision now, is likely to give me the best returns going forward is the way I look at the current situation. I certainly agree that scalping the market has been the smart approach for quite some time and believe, that is exactly what I have been doing. If the kind of market top I think we are putting in is indeed what is happening, scalping this move higher is chump change compared to what’s coming!
I am actually stunned to hear some folk entertain the idea of getting comfortably long the market at this juncture….Yikes! 🙂
I continue to accumulate long vol positions on any VIX move below ten. It is starting to look as if they have squeezed the last ounce of juice out of the smash volatility trade. We really should have put in a new 52 week low instead of printing green today…. 🙂
Bear markets, like bull markets, do not appear out of nowhere, and do not complete in a day. There will be more than enough time to take profits/exit longs, watch for triggers, and get short as the bull slowly dies and the bear wakes up. For myself, I see zero need to spend money at this time on insurance against a downside move.
I agree. It doesn’t seem prudent to me at all to be “comfortably long” at this stage. Careful trend trades and a few really quick intra-day trades are about all I want to do right now.
Verne, its been a while since tulip bulbs and my dear friend Sir Isaac have been discussed. Maybe now … . This market may not have all the glitz of tulip bulbs and the tulip bulb mania, but it certainly can be called a “Daffy-dill” market.
Mania does indeed abound! 🙂
There’s a good Fortune article on bull market lengths since WWII. This one is still in #2 position, behind the 1990-2000 market. That market lasted 11 years (vs this one at 8), and went up 417% (vs. this one at 249% back in March, may 280-300% or so now??). And in general, bull market lengths keep extending as we march forward in time. Used to be (generally) 4 year cycles, then 8 year cycles, then the 11 year one…perhaps this one goes for 16?? So there isn’t anything particularly new under the sun here, and nothing anomolous relative to history.
All I know is what the situation is today. And I trade it. I let the EW and technicals inform me about the nature of the market, TODAY. What the nature of the market will be in 2 weeks, 2 months, 2 years…I don’t care. I don’t think anyone can predict the market, frankly. All I know are the current trends at different timeframes and the EW structure up until “now”, and I trade from there. Most importantly (a lesson I’ve relearned recently!), market action takes priority over ANY and ALL expectations based on trend and EW!
Firstest?
You win!