
Another new high was expected, but the sharp pullback during Wednesday’s session was not expected. Price remains well above the invalidation point on the hourly Elliott wave count.
On Balance Volume and the AD line give strong clues today as to what to expect next.
Summary: Classic technical analysis is very bullish for the short term. The next target is now a small zone calculated at two degrees, from 2,526 to 2,529. It may be met in another 6 sessions.
However, stay nimble and keep stops tight. This trend is extreme and over stretched. There is reasonable downside risk.
Always trade with stops and invest only 1-5% of equity on any one trade.
Last monthly and weekly charts are here. Last historic analysis video is here.
Due to strong support for a bullish wave count from On Balance Volume and the AD line, the wave counts are now labeled “main” and “alternate” and have been swapped over.
MAIN ELLIOTT WAVE COUNT
WEEKLY CHART
Click chart to enlarge.
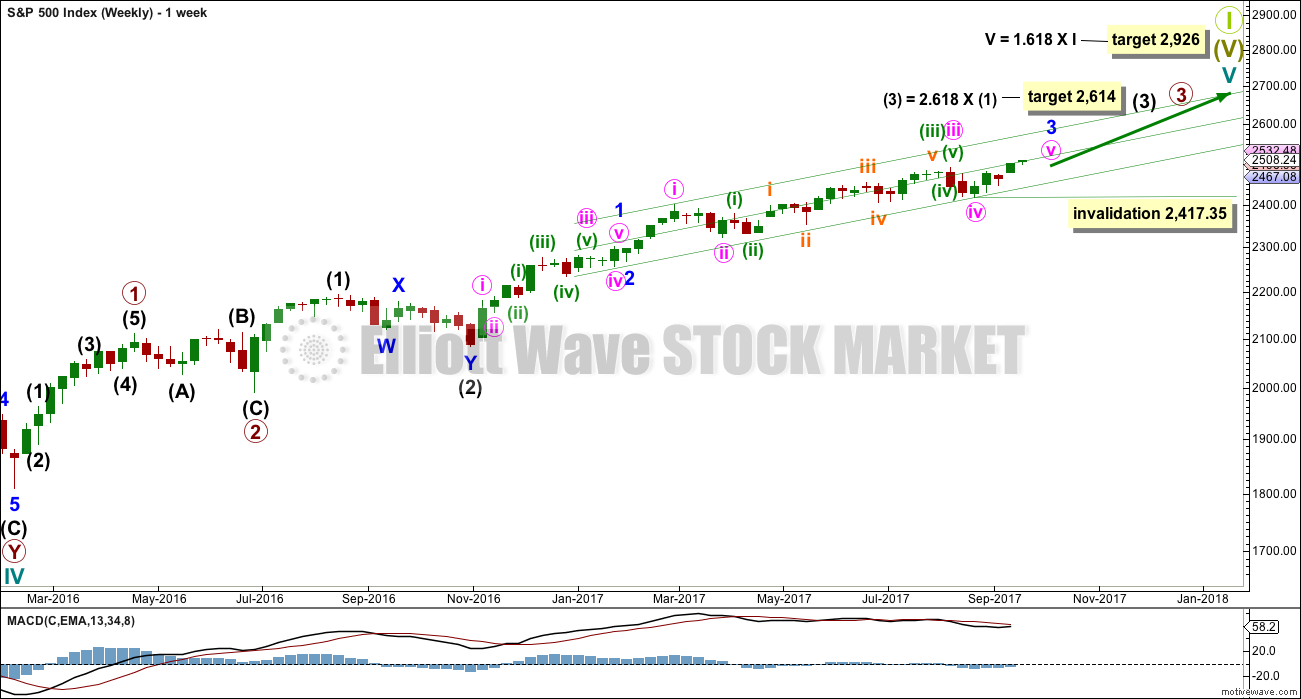
This wave count has strong support from a clear and strong bullish signal from On Balance Volume. While classic analysis is still very bullish for the short term, there will be corrections along the way up. Indicators are extreme and there is considerable risk to the downside still.
If primary wave 3 isn’t over, then how would the subdivisions fit? Would it fit with MACD? What would be the invalidation point and would the Fibonacci ratios be adequate?
Of several ideas I have tried, this one has the best fit in terms of subdivisions and meets all Elliott wave rules.
Despite this wave count appearing forced and manufactured, and despite persistent weakness in volume and momentum for this third wave, On Balance Volume does now strongly favour it. It may be that as a Grand Super Cycle wave comes to an end, that weakness may develop and persist for very long periods of time (up to three years is warned as possible by Lowry’s for the end of a bull market), so this weakness may be viewed in that larger context.
Within minute wave v, no second wave correction may move beyond the start of its first wave below 2,417.35.
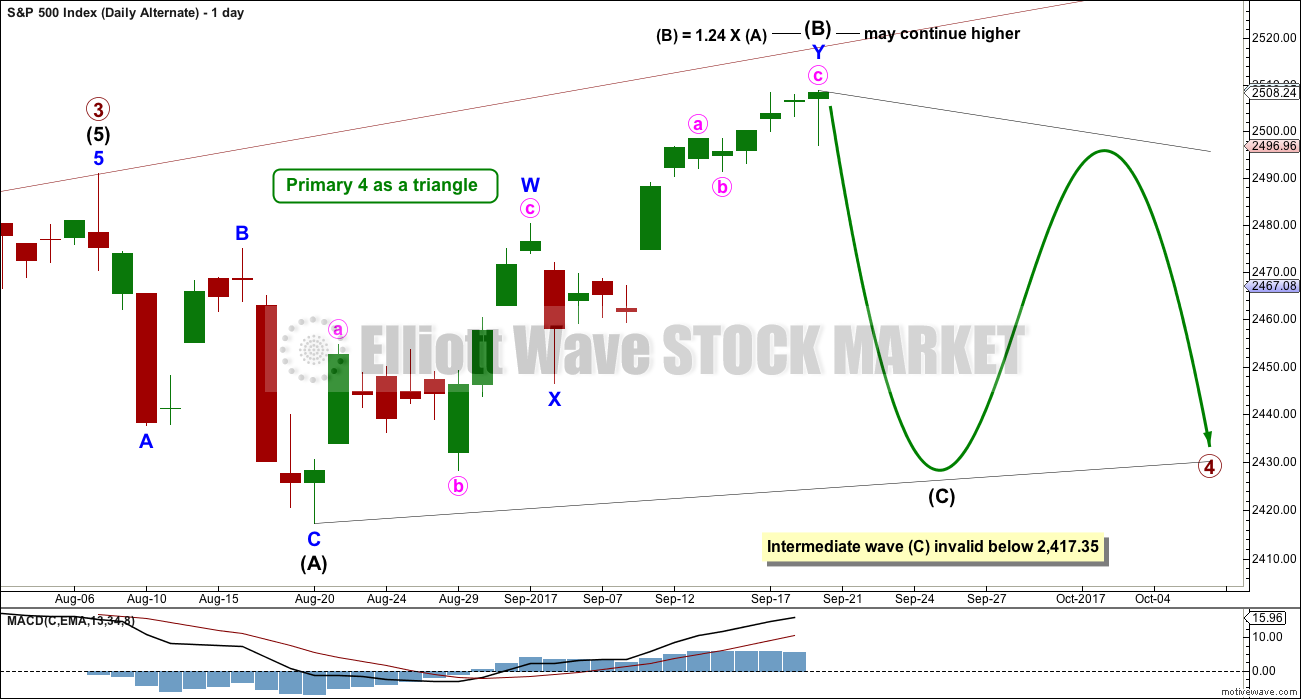
The next reasonable correction should be for intermediate wave (4). When it arrives, it should last over two months in duration, and it may find support about the lower edge of this best fit channel. The correction may be relatively shallow, a choppy overlapping consolidation, at the weekly chart level.
DAILY CHART
Click chart to enlarge.
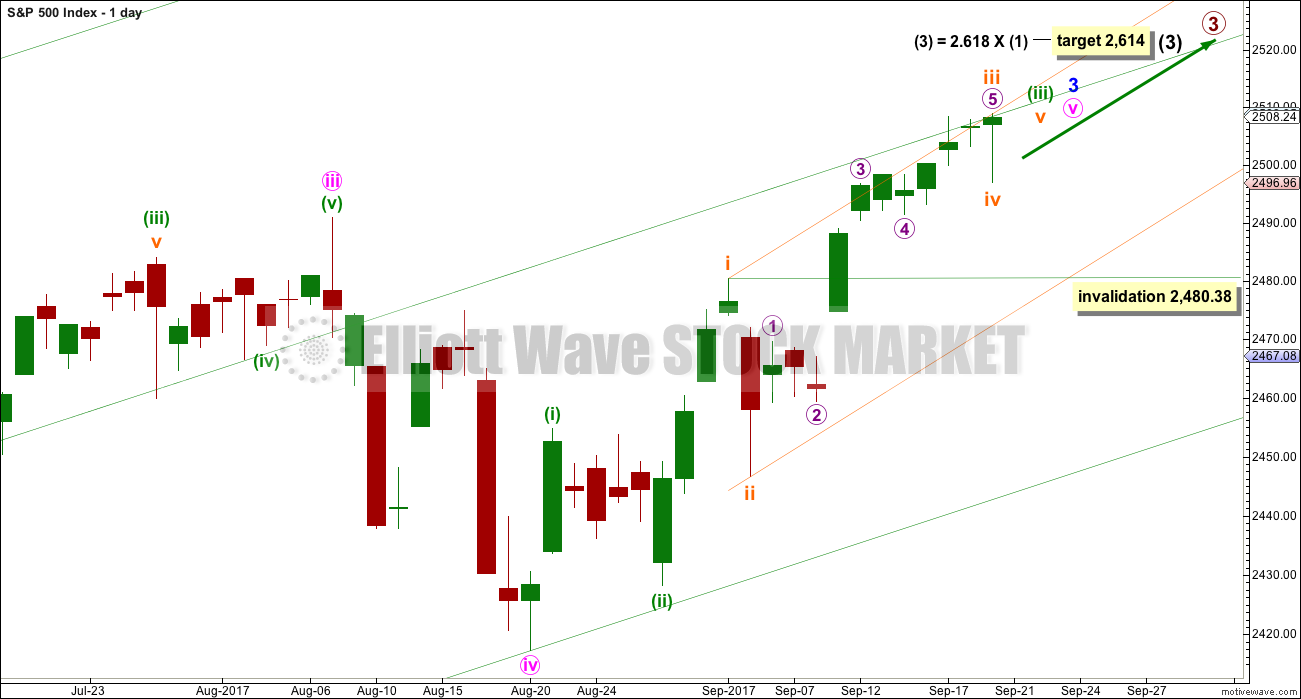
To see details of the whole of primary wave 3 so far and compare and contrast with the alternate wave count, see the analysis here.
Minute wave v to complete minor wave 3 must subdivide as a five wave structure. It looks like an incomplete impulse. Within the impulse, if it continues further, subminuette wave iv may not move into subminuette wave i price territory below 2,480.38.
So far minuette wave (iii) has lasted 15 sessions. If it exhibits a Fibonacci duration, then the next number in the sequence is 21; this duration would see it end in another 6 sessions.
HOURLY CHART
Click chart to enlarge.
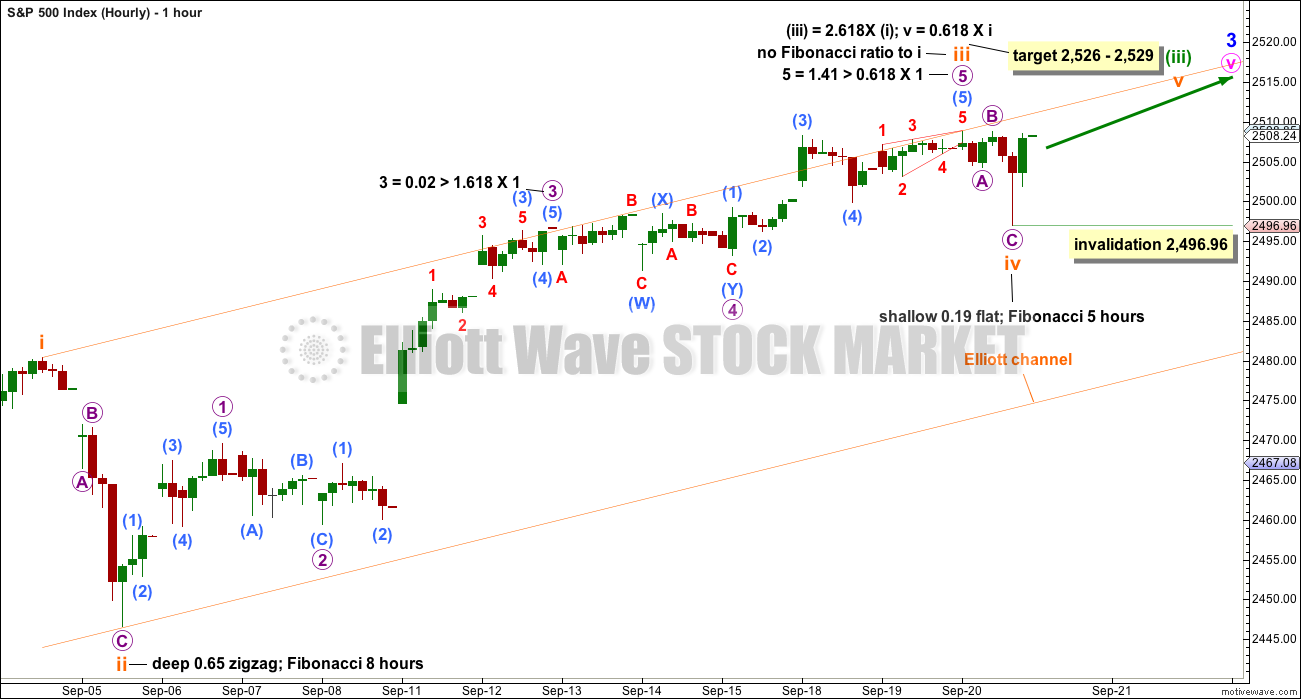
At the hourly chart level, this wave count now still has a better look over the alternate wave count. Subminuette wave iii looks so far like a typical unfolding impulse and its second and fourth wave corrections for micro waves 2 and 4 both look to be in proportion.
Subminuette wave iii may have completed its structure today; however, it exhibits no Fibonacci ratio to subminuette wave i and falls well short of the target.
The pullback during today’s session may have been subminuette wave iv already complete as a very shallow flat correction. This subdivides well on the five minute chart and has perfect alternation with subminuette wave ii. Both subminuette waves ii and iv show up on the daily chart giving the wave count the right look at that time frame. There is good proportion between them.
Because there is no Fibonacci ratio between subminuette waves i and iii, it is more likely that subminuette wave v will exhibit a Fibonacci ratio. The target is calculated at two wave degrees now and should have a reasonable probability.
Within subminuette wave v, no second wave correction may move beyond its start below 2,496.96.
ALTERNATE WAVE COUNT
WEEKLY CHART
Click chart to enlarge.
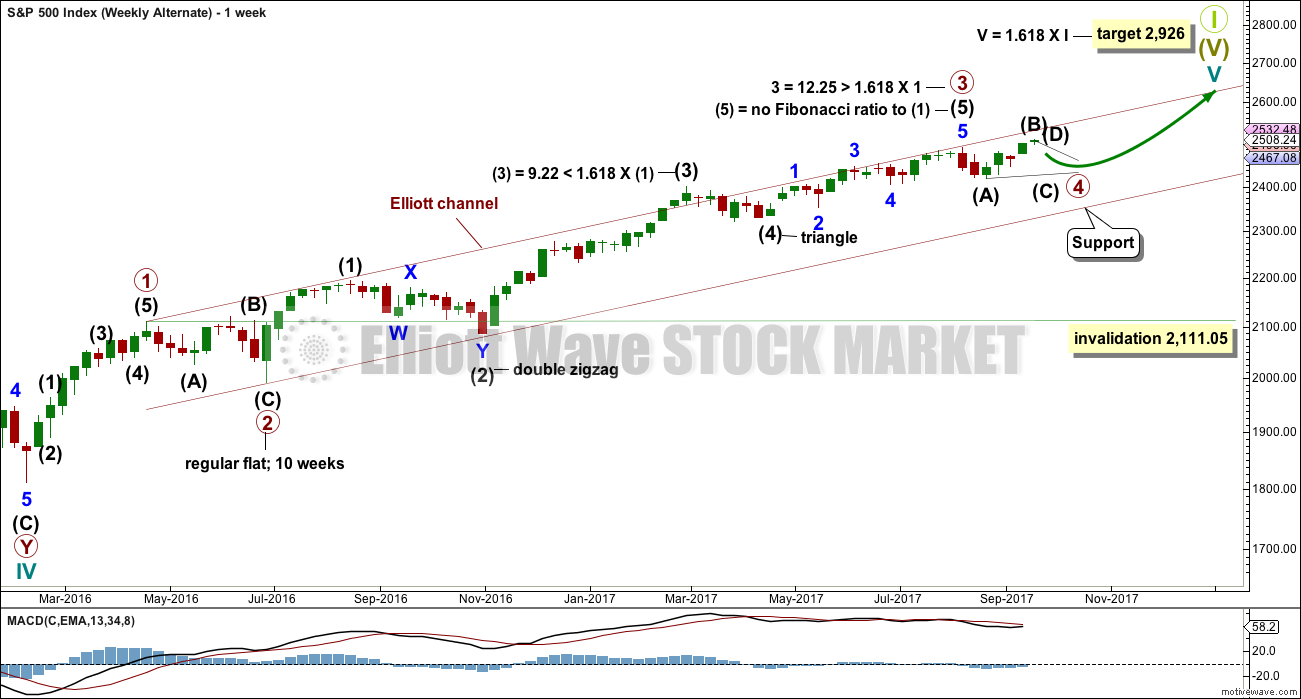
Primary wave 3 may be complete. Confidence may be had if price makes a new low below 2,480.38 now. That would invalidate the main wave count. Fibonacci ratios are calculated at primary and intermediate degree. If primary wave 3 is complete, then it still exhibits the most common Fibonacci ratio to primary wave 1.
Primary wave 4 may not move into primary wave 1 price territory below 2,111.05.
Primary wave 4 should last about 8 weeks minimum for it to have reasonable proportion with primary wave 2. It is the proportion between corrective waves which give a wave count the right look. Primary wave 4 may last 13 or even 21 weeks if it is a triangle or combination. So far it may have completed its fifth week.
If primary wave 4 unfolds as a single or double zigzag, then it may find support about the lower edge of the maroon Elliott channel. If it is a triangle or combination, it may be more shallow, ending about mid way within the channel. At this stage, a single zigzag has been invalidated and a double zigzag is discarded based upon a very low probability. It looks like primary wave 4 is to be a very shallow sideways consolidation rather than a deeper pullback.
Only two daily charts are now published for primary wave 4: a triangle and a combination. It is impossible still for me to tell you with any confidence which of these two structures it may be. The labelling within each idea may still change as the structure unfolds.
The daily charts are presented below in order of probability based upon my judgement.
The final target for Grand Super Cycle wave I to end is at 2,926 where cycle wave V would reach 1.618 the length of cycle wave I.
DAILY CHART – TRIANGLE
Click chart to enlarge.
This first daily chart will illustrate how price might move if primary wave 4 unfolds as a triangle.
Intermediate wave (B) may be continuing higher as a double zigzag. One of the five sub-waves of a triangle should be a more complicated multiple; most commonly that is wave C, but it may be any sub-wave. Intermediate wave (B) has made a new all time high, so it may be a running triangle.
The triangle may last a total of a Fibonacci 13 or 21 weeks.
Both intermediate waves (A) and (B) look like three wave structures.
Intermediate wave (C) may not move beyond the end of intermediate wave (A).
HOURLY CHART
Click chart to enlarge.
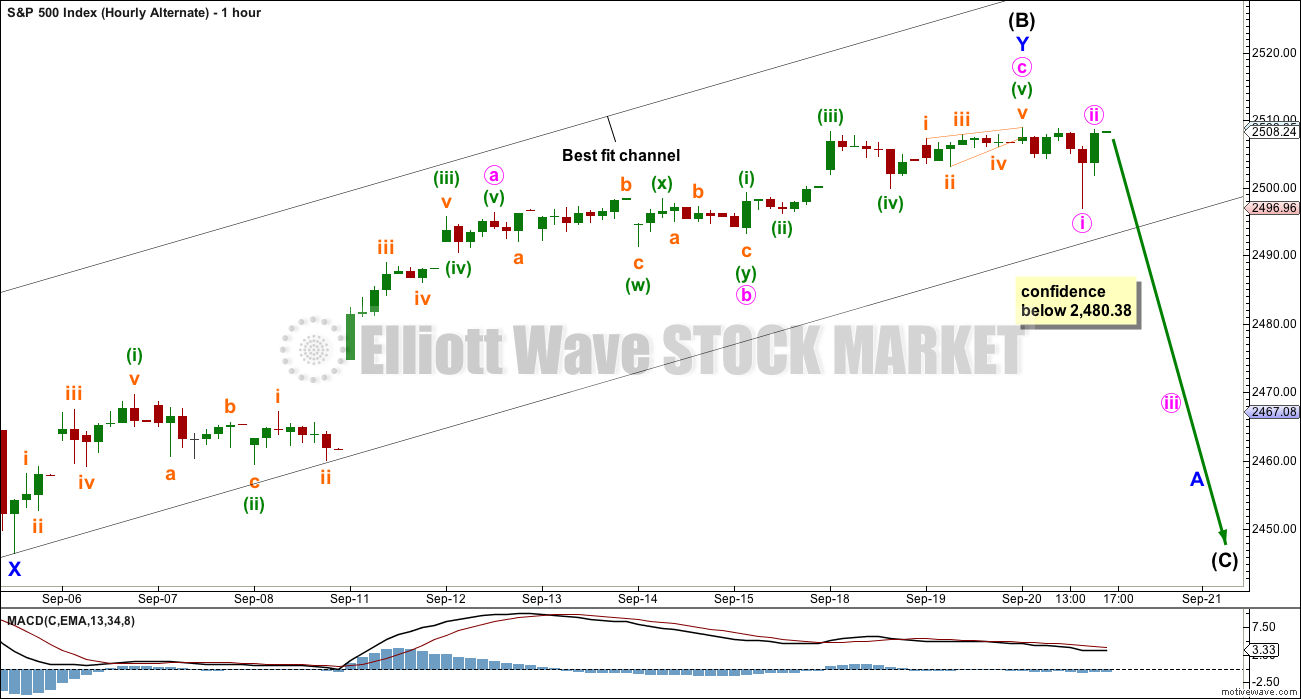
A double zigzag may be again complete for intermediate wave (B).
Use the black best fit channel. If price breaks below the lower edge, then expect the upwards swing is over and the next swing down has begun. While price remains within this channel, then it is entirely possible price may continue higher; minute wave c may not be complete.
There is still zero evidence of a trend change. A new low below 2,480.38 is required for any confidence that a high is in place.
We should assume that the trend remains up while price remains within the black channel and above 2,480.38.
DAILY CHART – COMBINATION
Click chart to enlarge.
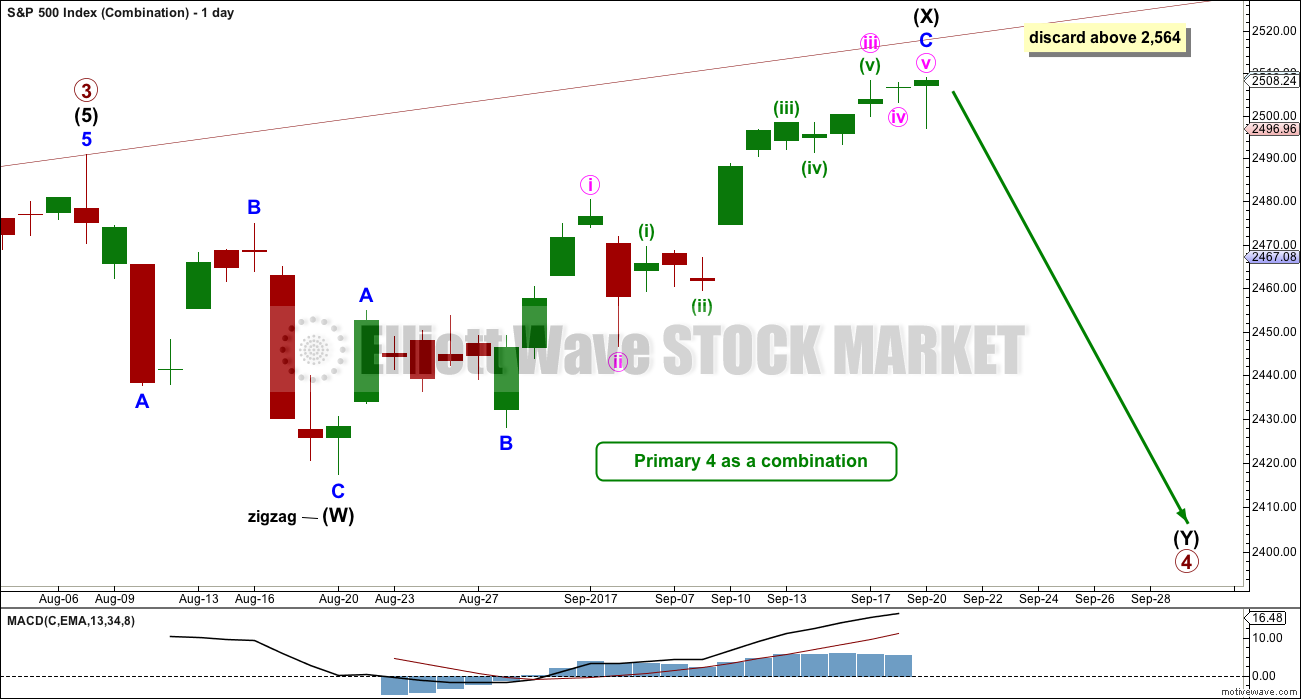
A combination for primary wave 4 would still offer some alternation with the regular flat of primary wave 2. Whenever a triangle is considered, always consider a combination alongside it. Very often what looks like a triangle may be unfolding or may even look complete, only for the correction to morph into a combination.
There may only be one zigzag within W, Y and Z of a combination (otherwise the structure is a double or triple zigzag, which is very different and is now discarded). At this stage, that would be intermediate wave (W), which is complete.
Combinations are big sideways movements. To achieve a sideways look their X waves are usually deep (and often also time consuming) and the Y wave ends close to the same level as wave W.
This wave count sees upwards movement continuing as intermediate wave (X). Unfortunately, there is no Elliott wave rule regarding the length of X waves, so they may make new price extremes. I am applying the convention within Elliott wave regarding B waves within flats here to this X wave within a combination: When it reaches more than twice the length of intermediate wave (W), then the idea of a combination continuing should be discarded based upon a very low probability.
With intermediate wave (W) a zigzag, intermediate wave (Y) would most likely be a flat correction but may also be a triangle. Because a triangle for intermediate wave (Y) would essentially be the same wave count as the triangle for the whole of primary wave 4, only a flat correction will be considered.
But first, an indication would be needed that the upwards wave of intermediate wave (X) is over. As yet there is no evidence of this.
TECHNICAL ANALYSIS
WEEKLY CHART
Click chart to enlarge. Chart courtesy of StockCharts.com.
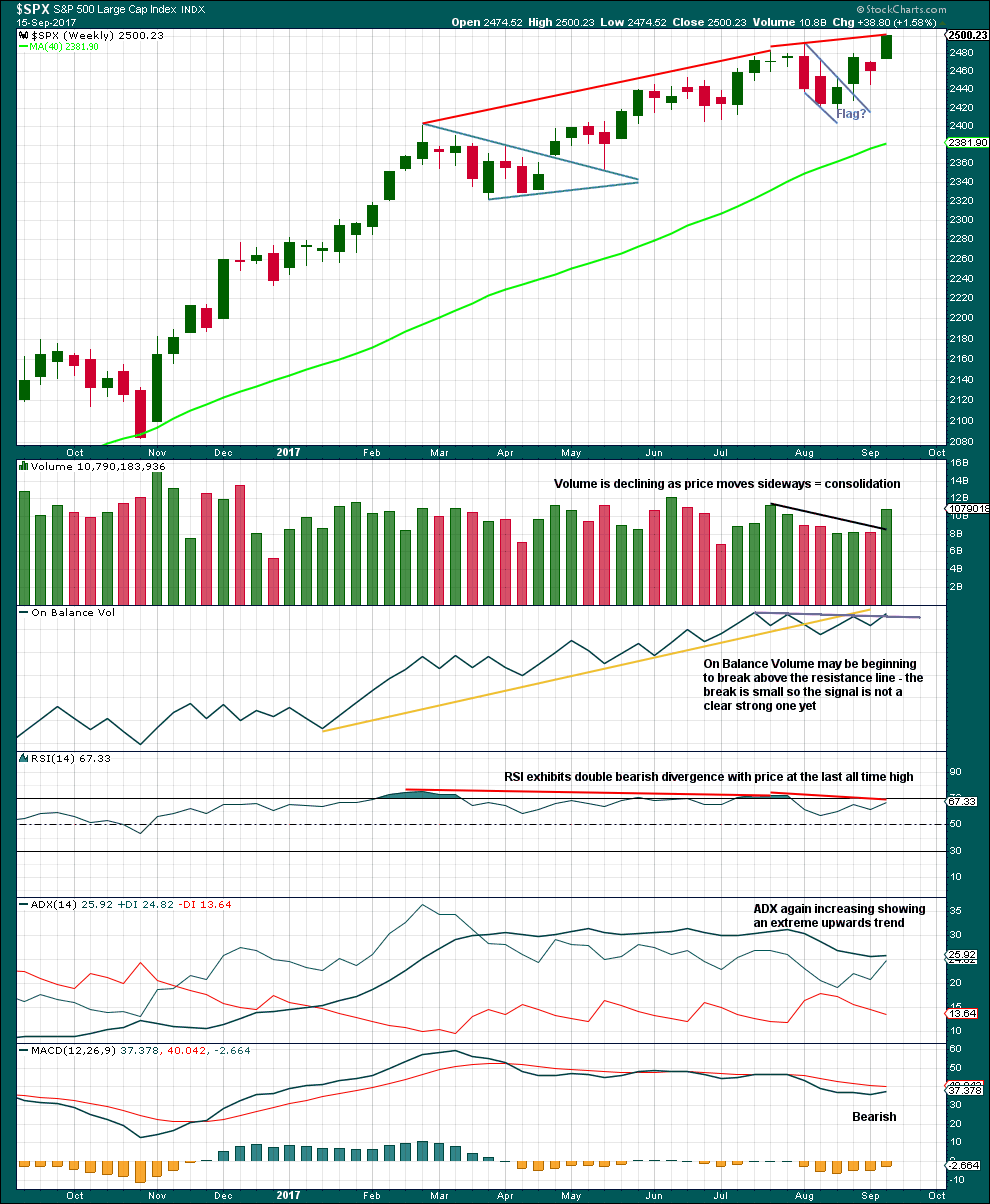
A strong weekly candlestick gaps higher and has support from volume. This looks like a classic upwards breakout after a small consolidation, and there may have been a small flag pattern in it. This supports the second Elliott wave count.
If the flag pole is taken from 2,405.70 to 2,490.87, then a target for the next wave up may be about 2,527.
On Balance Volume looks like it may be breaking above the resistance line. However, the break is very small and so is unclear. One more upwards week would make it much clearer and then confidence may be had in the signal.
ADX is extreme and RSI now exhibits double bearish divergence. This trend is very extreme; beware that the first wave count may still be correct.
DAILY CHART
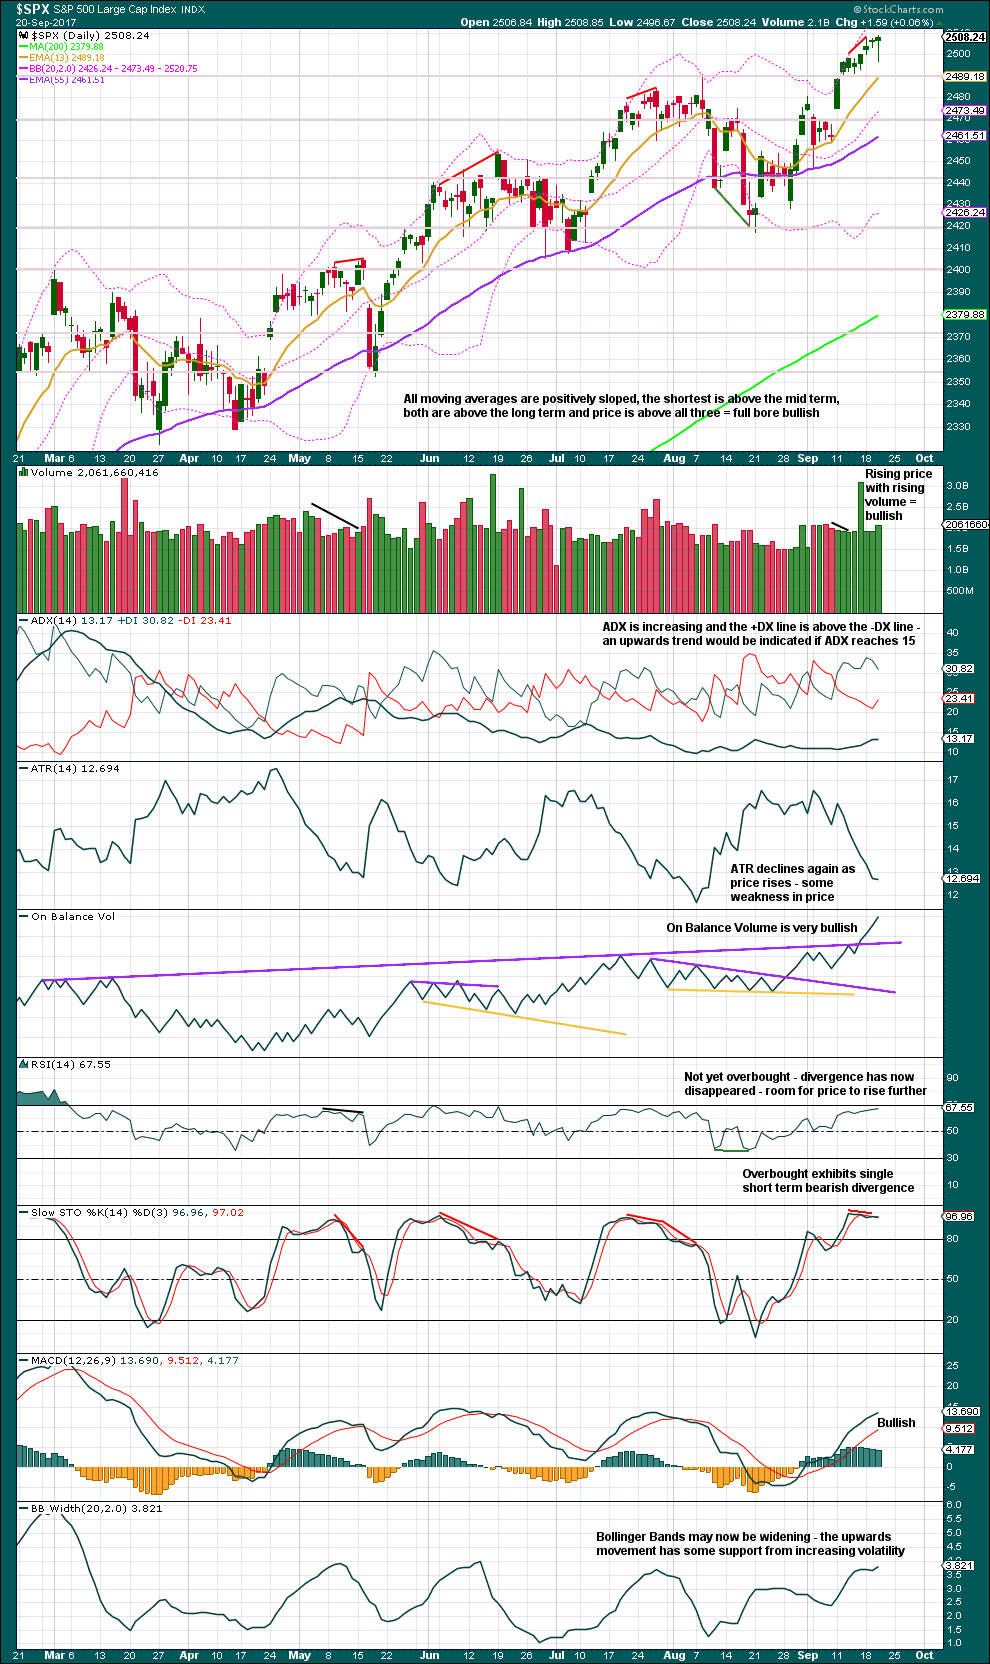
Click chart to enlarge. Chart courtesy of StockCharts.com.
The long lower wick on today’s candlestick creates a Hanging Man pattern, which is a bearish reversal pattern. However, the bullishness of the long lower wick means that Hanging Man patterns require bearish confirmation before they may be read as reversals; tomorrow will be important to confirm or non confirm this pattern.
Strong bullishness from On Balance Volume should be taken seriously. It very strongly supports the main wave count.
RSI is not yet extreme, so there is a little room for price to rise.
A small warning today is sounded by Stochastics exhibiting divergence, but this can develop further (or just disappear). As it is only single divergence and not multiple, it is a small warning. Wait for RSI to do the same; if that happens, the warning would be stronger.
VOLATILITY – INVERTED VIX CHART
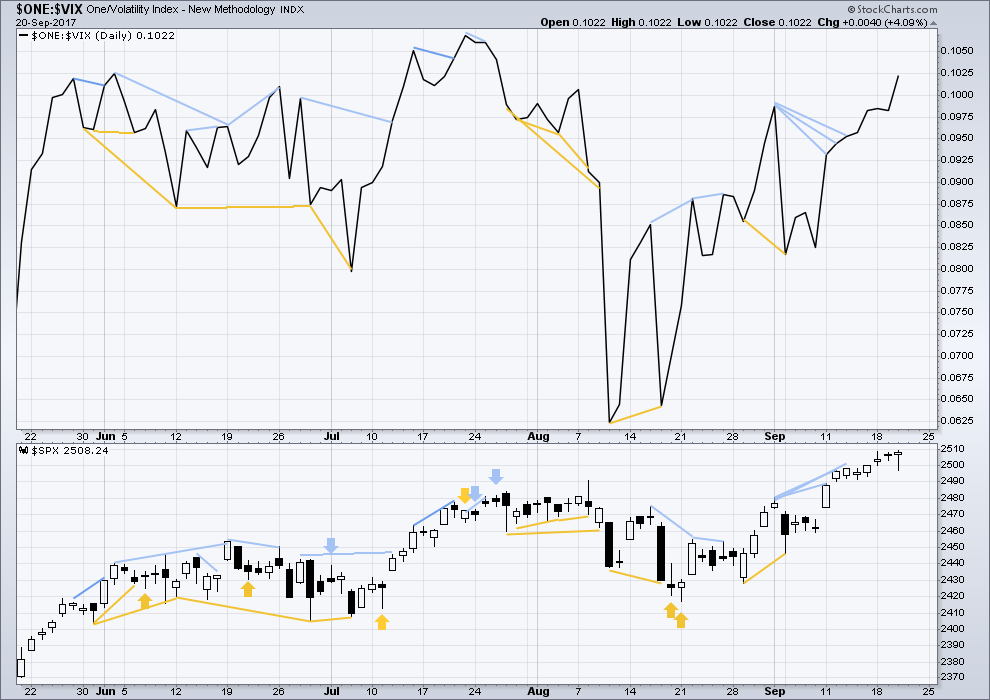
Click chart to enlarge. Chart courtesy of StockCharts.com.
Normally, volatility should decline as price moves higher and increase as price moves lower. This means that normally inverted VIX should move in the same direction as price.
There is still mid and longer term bearish divergence, but it has been noted in the past that divergence over a longer term does not seem to work as well for VIX. Short term bearish divergence has disappeared.
BREADTH – AD LINE
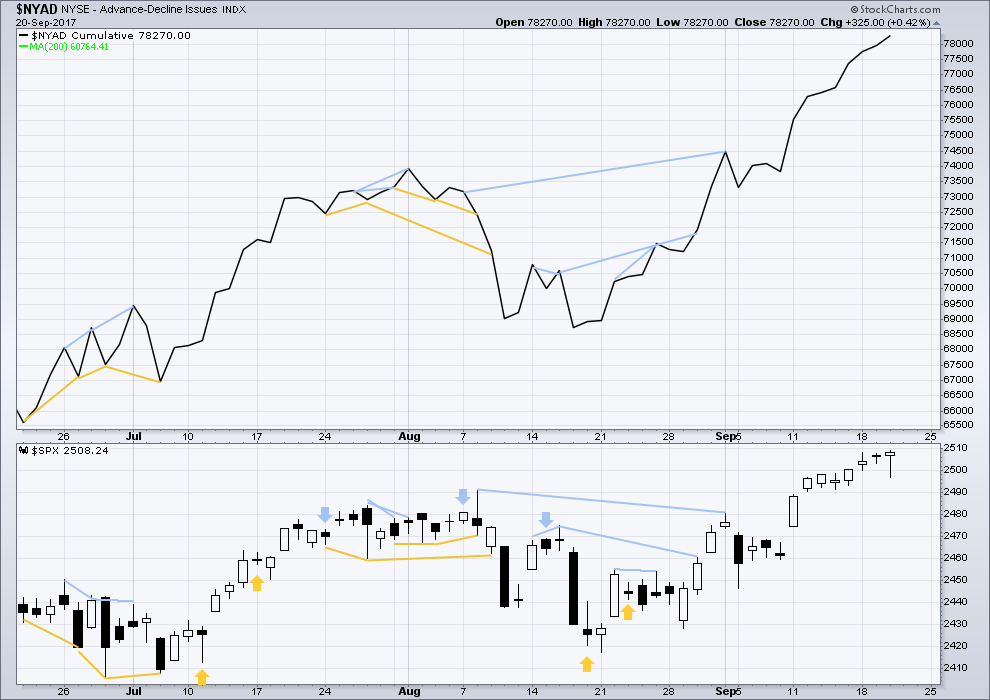
Click chart to enlarge. Chart courtesy of StockCharts.com.
With the last all time high for price, the AD line also made a new all time high. Up to the last high for price there was support from rising market breadth.
There is normally 4-6 months divergence between price and market breadth prior to a full fledged bear market. This has been so for all major bear markets within the last 90 odd years. With no divergence yet at this point, any decline in price should be expected to be a pullback within an ongoing bull market and not necessarily the start of a bear market.
There is again no new divergence today between price and the AD line. The new high today for price has support from rising market breadth. This is bullish.
The AD line made a new all time high again today. Market breadth continues to be very bullish supporting the main wave count.
DOW THEORY
The S&P’s new all time high last week is confirmed by DJIA and Nasdaq also making new all time highs. However, DJT has not yet made a new all time high, so the continuation of the bull market at this stage lacks confirmation.
The following lows need to be exceeded for Dow Theory to confirm the end of the bull market and a change to a bear market:
DJIA: 17,883.56.
DJT: 7,029.41.
S&P500: 2,083.79.
Nasdaq: 5,034.41.
Charts showing each prior major swing low used for Dow Theory are here.
Published @ 10:00 p.m. EST.
Updated hourly chart:
I agree with Kevin below, looks like a triangle.
But.. we all know the problem with triangles. They can quickly morph into a more complicated combination. So the invalidation point has to go back down.
Since i did this chart the triangle could now be complete.
1 point away from invalidation.
Invalidation is 2,480.36. Not 2,496.96.
At least 15 points away from invalidation.
Was referring to triangle idea for for subminuette 4th wave of updated hourly chart above where e wave would exceed the end of c wave.
Market very fragile – volatility hammered, little selling pressure and we are still falling. Any kind of black swan under these circumstances would have stunning results; let’s hope that is not in the cards…
Joe there is a good reason for the complacency. The market knows that the FED is LYING.
The are NOT going to raise rates. They are NOT going to reduce the balance sheet. The way markets have reacted is the clearest and most cogent evidence that FED jawboning is all BS to try and project some semblance of credibility.
This move down today is still corrective so we have more upside. True they are struggling to maintain the elevated prices but they are still in control. The first impulse down after a final top is in is not going to be a lot of meandering crap such as we have been seeing. I also do not expect it to happen during the regular session so today’s price action is I think rather boring.
The FED will raise rates when they are FORCED to do so by a market that refuses to buy their debt at the current offerings, not before….just my two cents…. 🙂
For what it’s worth, the big credit traders I know are exiting IG, and outright shorting high yield citing all shorts of reason. Many believe the high is being made now. This is the 5th time in 3 years they’ve said that, but at some point it’s gonna be right. 🙂
Yep! 🙂
Today is a Pancholi turn date but he has been erratic of late, more so than usual and I am not surprised. Charles Nenner issued a rare warning a few weeks ago and he does not do that very often. He has been pointing to 2017, unlike most, for the past three years. There will be, at some point, an event that will dispel the illusion under which the market continues to trade at these levels.
Shorting IWM, broadening pattern looks awesome. I might be early but it’s gone silly the last few weeks.
Not to mention the big double top forming on the daily. I will wait for a crack of a daily bar low myself.
Huge Double Top!! nice divergences on the weekly chart as well. Pretty good hanging man today.
CRACK!
Okay, Okay….I know I am just a bit too eager! 🙂
Also to your point, the FED bought 1.1bn of MBS today……to sell in two weeks???
‘Nuff said!!!
Wrong! The Balance Sheet will be Reduced Starting October 1st by $10 Billion/mo increasing $10 Billion/Qtr to Max per month of $50 Billion.
The December FF Increase will Occur!
Then Yellen will be out of a Job and those still on the Board will also be replaced. Remember their are currently 4 Open Positions on that Board.
That is why I know they will follow through on their plan… No Exceptions! If you don’t believe it, do so at your own risk!
The market is filled with people who have NOT live through a real Fed Tightening!
A reduction in the Balance Sheet is in effect a Tightening! That is just a plain FACT!
Fed won’t be selling… it all just runs off with maturities and remember a large percentage is Mortgage Backed Securities… each month and every month the principal balance just runs down naturally.
So in effect remove from the market Buying Power of $10 Billion/mo increasing $10 Billion/Qtr to Max per month of $50 Billion.
It’s not that they will sell in two weeks… they will just stop buying to effect a reduction of $10 Billion/mo increasing $10 Billion/Qtr to Max per month of $50 Billion.
Do you now understand???
The Market right now is delusional or just plain uneducated! They way people just have no understanding or knowledge of History these days… well the same for monetary policy.
The FED FOLLOWS the market . No one is arguing that rates will not rise. They may not have the luxury of holding to maturity…!
They have Holdings Maturing every day and the MBS portfolio Declines in large amounts naturally every month.
So I don’t get what your trying to say with that statement.
The Fed 100+ year history shows that the Fed does not follow the market.
The wosses in charge the last 8 years have followed the market… for fear of rocking the boat. But that is over now! The Balance Sheet reductions will Start October 1st. The Fed doesn’t care anymore… they are losing their jobs in January.
Simple. At the stated balance sheet reduction rate, how long will it take for them to fully divest the 4.5 T(and that is their STATED amount!)?
Then, how high would interest rates have to rise before their balance sheet is irredeemably impaired? 🙂
It’s not the size or the rate of reduction…
Any reduction at all is a Tightening… Tightening is a reduction in the supply of money! This will have an effect on Stock Prices. That is just a Fact!
They hold to maturity and MBS runs off naturally. Their Balance Sheet will never get impaired.
Impaired only matters to a trader or Company that can’t hold to maturity.
VIX 9.62
Fed Balance Sheet to start reducing on October 1st: $10 Billion/mo increasing $10 Billion/Qtr to Max per month of $50 Billion.
Fed Funds rate to increase in December 2017 by 0.25
Fed to Raise FF Rate 3 Times in 2018
All means monetary tightening starts October 1st with tightening accelerating as each month passes.
Whole new generation that really doesn’t know what this means… Yes it has been that long!
Markets Yawn and Ignore… This is Complacency to the N Degree!
TICK…TICK… TICK…
Stocks go up, the dollar goes up, the…wait, what?
Symmetric triangle forming in SPX, already have a, b, c, and d in place, and after e turns we should get some 3 of 3 of 5 upside action? Maybe, because it does look like a sequence of 1-2’s.
This…
Now this…
It seems like the E-mini S&P 500 Futures might be in the early stages of creating a diamond structure similar to what it and the S&P created in late July. This seems to be developing in both the hourly and daily charts. Squint really hard.
AZO still in dead cat bounce. ORLY and AAP have already resumed droopage….
If SVXY takes out yesterday’s low, next week’s 90 puts is an easy double…
It is entirely possible that the banksters will spend another several billion trying to defend 2500. They may even pull it off for a few sessions. The fall away from this pivot should ultimately be steep…
TICK… TICK… TICK…
Anybody else call the volatility smash down bluff yesterday?
I had some dry powder and jumped on that like ugly on a mutt! Quick double!!
Vix under 10 at this juncture???!!! Are you kidding?! 🙂
of course I did….such a joke. So much short gamma, vega is super high…..I’m thinking this is much sooner than later.
This is a heck of a micro 2 of 5, and if it holds above the invalidation at 2496.84, I will go long SPX here. The close invalidation provides a fantastic low risk/high leverage entry point! Boom….bought right at 2500….
He! He!
Bingo. Like taking candy from babies…well, sometimes!! But EXACTLY those kinds of set ups are why I’m a FAN BOY of Elliott Wave analysis!!
Red candle today confirms yesterday’s hanging man…string ’em up! 😀
China’s credit rating cut again today… DUH UH!
I agree with the today’s main count in the idea that wave 3 will continue, but my near term projection is less optimistic. The NASDAQ has been too sluggish, DJI too overbought, and foreign markets too mixed to give us that sort of surge forward before we see 24XXs again. Minuette 4 seems too short and shallow in context. I’ve been wrong before though 🙂
In any case the subdivisions are less important I suppose. The important thing to note is that primary 4 is clearly a bit of a ways off.
and before P4 there will be intermediate (4)
so two large consolidations to come
the whole thing could easily drag out for more than a year
Lara,
….the whole thing could drag out for more than a year….”
What is your best guess? Stay on the sidelines “for more than a year” or join in at some point? I have $500,000 in the bank (sold last month in August) due largely to your call last July 2016 that the bull was still “on” and now I’m retiring in December. What would you do? Jump in or stay out?
Thanks for your acumen and I appreciate your honesty!
That’s a really hard one actually.
Putting it into equities for a return on your $$ either requires active trading which is very high risk, you really must be very experienced and that takes years.
Or a longer term buy and hold investment. That should be good for another year, maybe up to three. But along the way will be intermediate (4) and primary 4 to scare you into taking a loss…. or riding out a nail biting loss before the bull resumes.
And that assumes that I and Lowry’s are right.
Putting it into property? Depending on where you are there may be another big property market bubble.
Hold some in cash IMO. Maybe even the actual folding variety. You can get fireproof safes from hardware stores, and be imaginative in where you store that safely.
If investing in equities for the longer term, and for dividends, you need to do a sector analysis and I would recommend a rotation analysis to pick your stocks.
Or if you’re in the USA I can highly recommend Chris Ciovacco. He uses solid technical analysis which should see you out in a bear market, avoiding ruin.
His link is on my sidebar.
Foist again Doc!
darn wabbit