
Last end of week analysis warned that On Balance Volume supported the alternate Elliott wave count and a target for more upwards movement was given. Price has moved higher as that wave count expected and the On Balance Volume signal is now clear and strong.
Summary: Assume the trend remains upwards while price remains above 2,480.38. The very clear and strong bullish signal from On Balance Volume supports this view. The next target for profit taking is 2,531.
However, stay nimble and keep stops tight. This trend is extreme and over stretched. There is reasonable downside risk.
Last monthly and weekly charts are here. Last historic analysis video is here.
I am very reluctant at this time to pick one wave count over the other, between these two wave counts. At this time, classic analysis still favours the second wave count. But I would rather label these as “first” and “second”, rather than “main” and “alternate”. I will lay out the arguments for and against each wave count in terms of Elliott wave and classic analysis, and let members make their own judgements.
FIRST ELLIOTT WAVE COUNT
WEEKLY CHART
Click chart to enlarge.
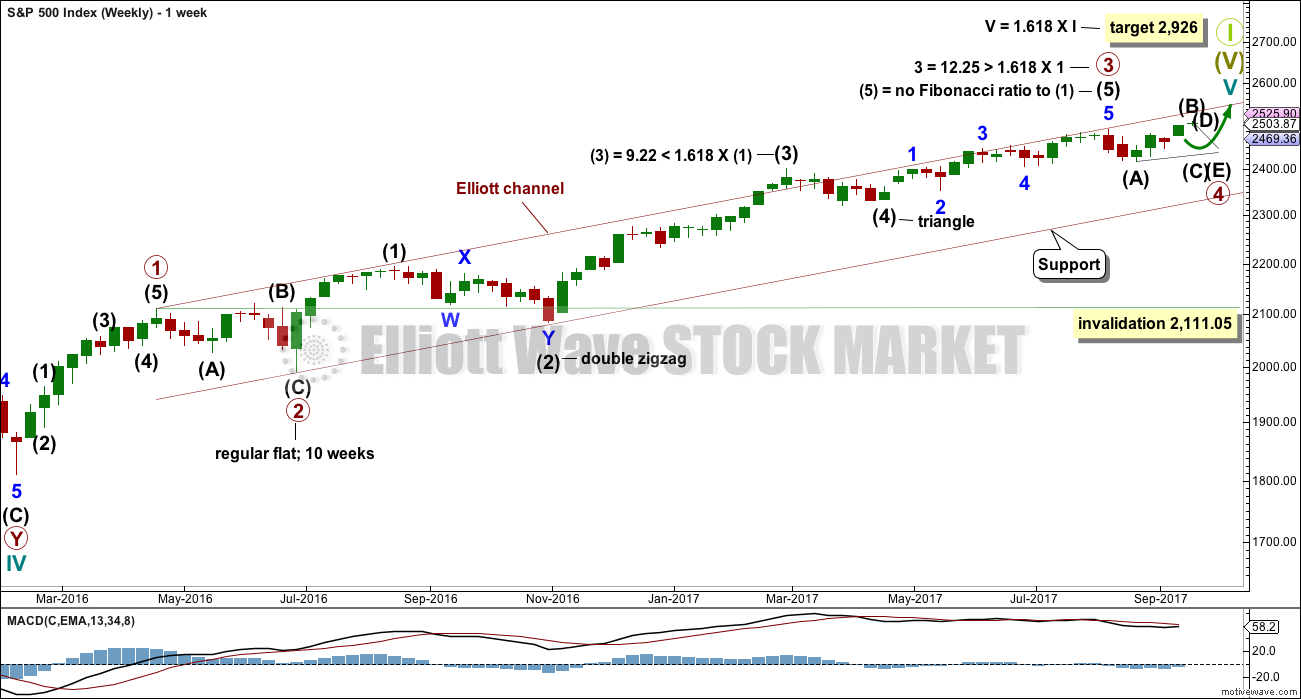
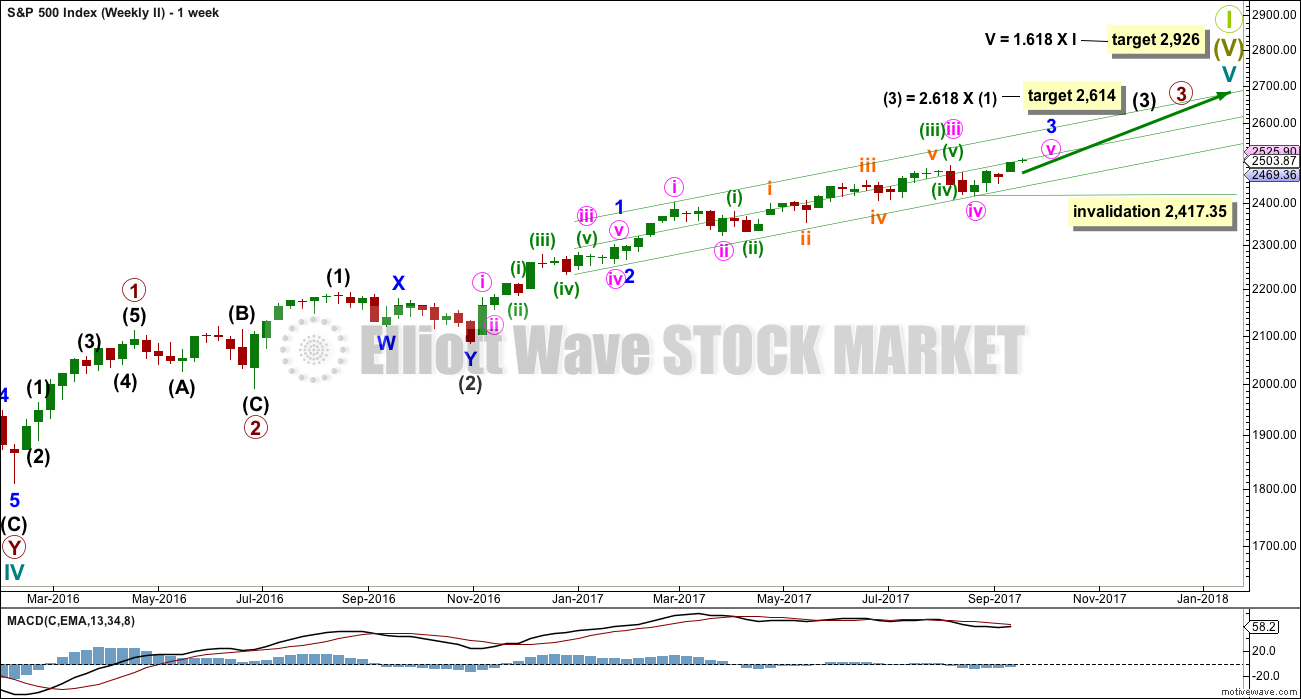
Primary wave 3 may be complete. Further and substantial confidence may be had if price makes a new low below 2,480.38 now. That would invalidate the second wave count published below. Fibonacci ratios are calculated at primary and intermediate degree. If primary wave 3 is complete, then it still exhibits the most common Fibonacci ratio to primary wave 1.
Primary wave 4 may not move into primary wave 1 price territory below 2,111.05.
Primary wave 4 should last about 8 weeks minimum for it to have reasonable proportion with primary wave 2. It is the proportion between corrective waves which give a wave count the right look. Primary wave 4 may last 13 or even 21 weeks if it is a triangle or combination. So far it may have completed its fifth week.
If primary wave 4 unfolds as a single or double zigzag, then it may find support about the lower edge of the maroon Elliott channel. If it is a triangle or combination, it may be more shallow, ending about mid way within the channel. At this stage, a single zigzag has been invalidated and a double zigzag is discarded based upon a very low probability. It looks like primary wave 4 is to be a very shallow sideways consolidation rather than a deeper pullback.
Only two daily charts are now published for primary wave 4: a triangle and a combination. It is impossible still for me to tell you with any confidence which of these two structures it may be. The labelling within each idea may still change as the structure unfolds.
The daily charts are presented below in order of probability based upon my judgement.
The final target for Grand Super Cycle wave I to end is at 2,926 where cycle wave V would reach 1.618 the length of cycle wave I.
DAILY CHART – TRIANGLE
Click chart to enlarge.
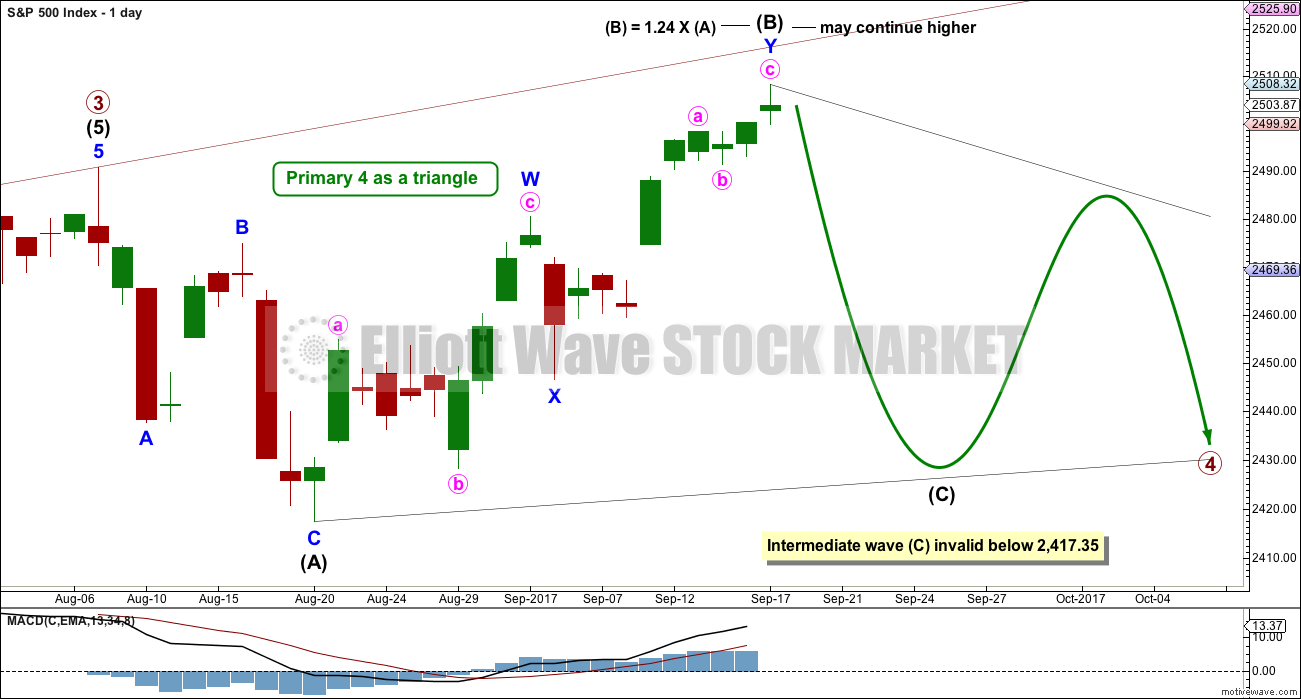
This first daily chart will illustrate how price might move if primary wave 4 unfolds as a triangle.
Intermediate wave (B) may be continuing higher as a double zigzag. One of the five sub-waves of a triangle should be a more complicated multiple; most commonly that is wave C, but it may be any sub-wave. Intermediate wave (B) has made a new all time high, so it may be a running triangle.
The triangle may still last a total of at least eight weeks, but so far it has lasted five weeks and may only be completing wave B. It now looks like it will need to take longer. If longer, then a Fibonacci 13 or 21 weeks may be expected.
Both intermediate waves (A) and (B) look like three wave structures.
Intermediate wave (C) may not move beyond the end of intermediate wave (A).
HOURLY CHART – TRIANGLE
Click chart to enlarge.
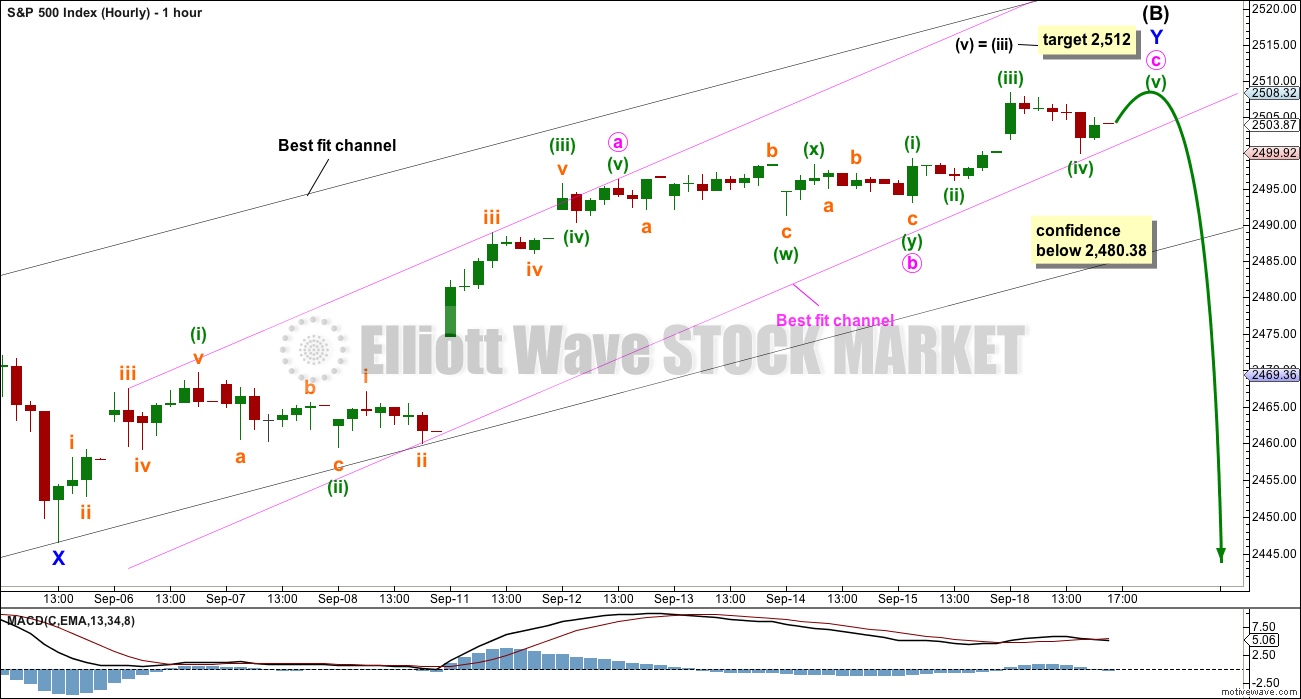
A double zigzag may be almost complete for intermediate wave (B).
Use the black best fit channel. If price breaks below the lower edge, then expect the upwards swing is over and the next swing down has begun. While price remains within this channel, then it is entirely possible price may continue higher; minute wave c may not be complete.
There is still zero evidence of a trend change. A new low below 2,480.38 is required for any confidence that a high is in place.
Labelling within the zigzag of minor wave Y is today changed to see minute waves a and b completed higher up. This has a better overall look to it.
Minute wave c looks now to be incomplete. A final fifth wave upwards looks like it is required.
A best fit channel is drawn about minor wave Y in pink. Assume the upwards trend remains intact while price remains within this channel.
We should assume that the trend remains up while price remains within the black channel and above 2,480.38.
DAILY CHART – COMBINATION
Click chart to enlarge.
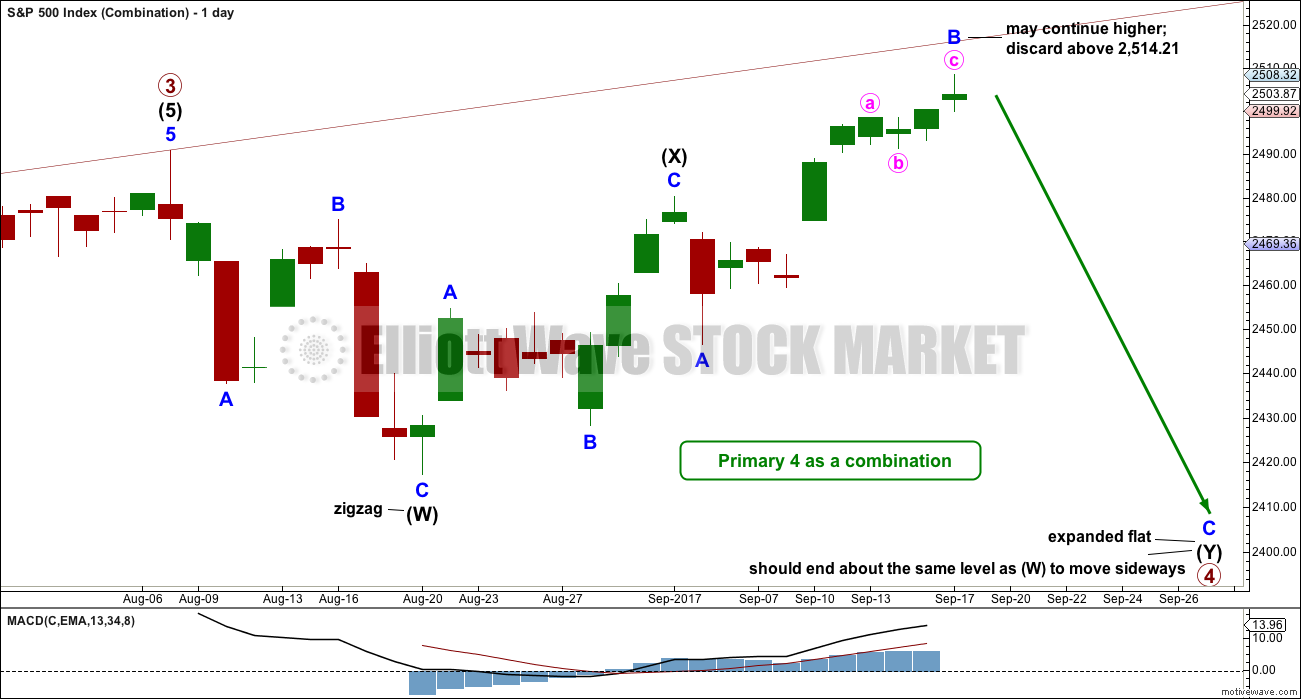
A combination for primary wave 4 would still offer some alternation with the regular flat of primary wave 2. Whenever a triangle is considered, always consider a combination alongside it. Very often what looks like a triangle may be unfolding or may even look complete, only for the correction to morph into a combination.
There may only be one zigzag within W, Y and Z of a combination (otherwise the structure is a double or triple zigzag, which is very different and is now discarded). At this stage, that would be intermediate wave (W), which is complete.
Combinations are big sideways movements. To achieve a sideways look their X waves are usually deep (and often also time consuming) and the Y wave ends close to the same level as wave W.
Here, intermediate wave (X) is very deep.
Intermediate wave (Y) may be a flat correction or a triangle. A flat correction should be expected for intermediate wave (Y).
Intermediate wave (Y) may be unfolding as an expanded flat, the most common variety. So far minor wave B may be a 1.83 length of minor wave A, substantially longer than the most common range of up to 1.38. If minor wave B reaches twice the length of minor wave A at 2,514.21, then the idea of an expanded flat should be discarded based upon a very low probability.
It is also possible that intermediate wave (X) is continuing higher as a double zigzag, as labelled on the triangle daily chart. While waves W, Y and Z within combinations may only be simple corrections labelled A-B-C (or A-B-C-D-E as in the case of triangles within combinations), the X waves within combinations may be any corrective structure including multiples. However, while this is valid, it is fairly unusual. I am always uncomfortable with labelling X waves as multiples until price proves in hindsight that they were, because of the low probability.
Minor wave C should move below the end of minor wave A. This structure may take another few weeks to complete.
SECOND WAVE COUNT
WEEKLY CHART
Click chart to enlarge.
This second wave count has strong support from a clear and strong bullish signal from On Balance Volume. If asked to pick a winner, this would be the wave count I would favour because of OBV’s signal. But I am concerned that indicators are so extreme.
If primary wave 3 isn’t over, then how would the subdivisions fit? Would it fit with MACD? What would be the invalidation point and would the Fibonacci ratios be adequate?
Of several ideas I have tried, this one has the best fit in terms of subdivisions and meets all Elliott wave rules.
Despite this wave count appearing forced and manufactured, and despite persistent weakness in volume and momentum for this third wave, On Balance Volume does now strongly favour it. It may be that as a Grand Super Cycle wave comes to an end, that weakness may develop and persist for very long periods of time (up to three years is warned as possible by Lowry’s for the end of a bull market), so this weakness may be viewed in that larger context.
Within minute wave v, no second wave correction may move beyond the start of its first wave below 2,417.35.
DAILY CHART
Click chart to enlarge.
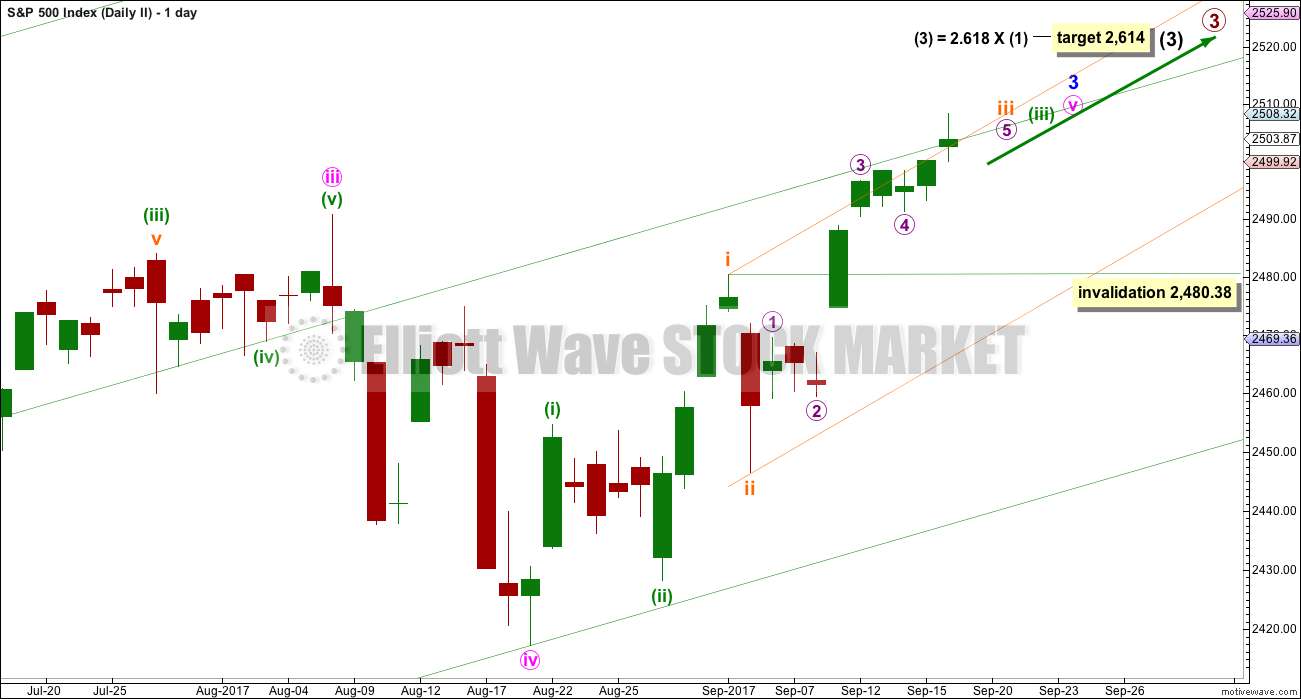
To see details of the whole of primary wave 3 so far and compare and contrast with the main wave count, see the analysis here.
Minute wave v to complete minor wave 3 must subdivide as a five wave structure. It looks like an incomplete impulse. Within the impulse, subminuette wave iv may not move into subminuette wave i price territory below 2,480.38.
HOURLY CHART
Click chart to enlarge.
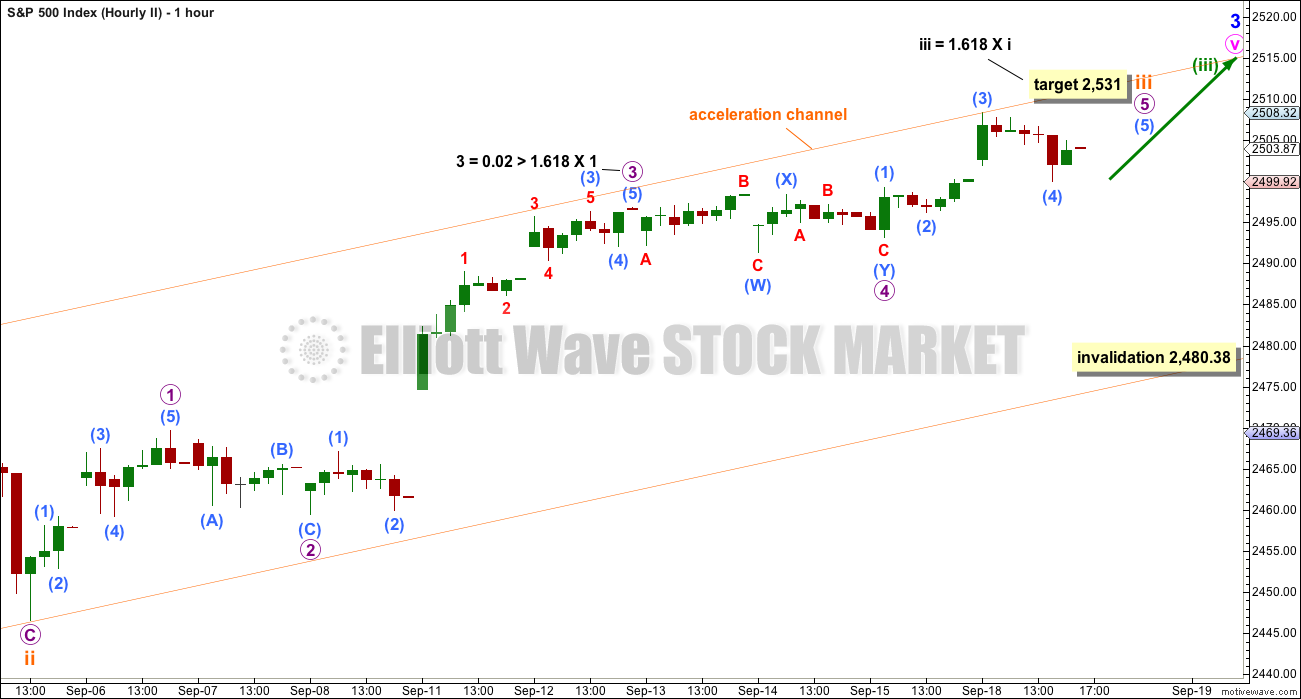
At the hourly chart level, this wave count now still has a better look over the first wave count. It looks like sideways movement over the last few days was a small fourth wave counterpart to a prior second wave correction ending on the 8th of September. These are labelled at micro degree.
A short term target is provided. Because there is such an excellent Fibonacci ratio already between micro waves 1 and 3, micro wave 5 may not exhibit a Fibonacci ratio to either of micro waves 3 or 1. The target is best calculated only at subminuette degree.
When subminuette wave iii is over, then subminuette wave iv should be a shallow correction lasting about one to three days. For the very short term, when markets open tomorrow, any continuation of sub-micro wave (4) may not move into sub-micro wave (1) price territory below 2,499.25.
TECHNICAL ANALYSIS
WEEKLY CHART
Click chart to enlarge. Chart courtesy of StockCharts.com.
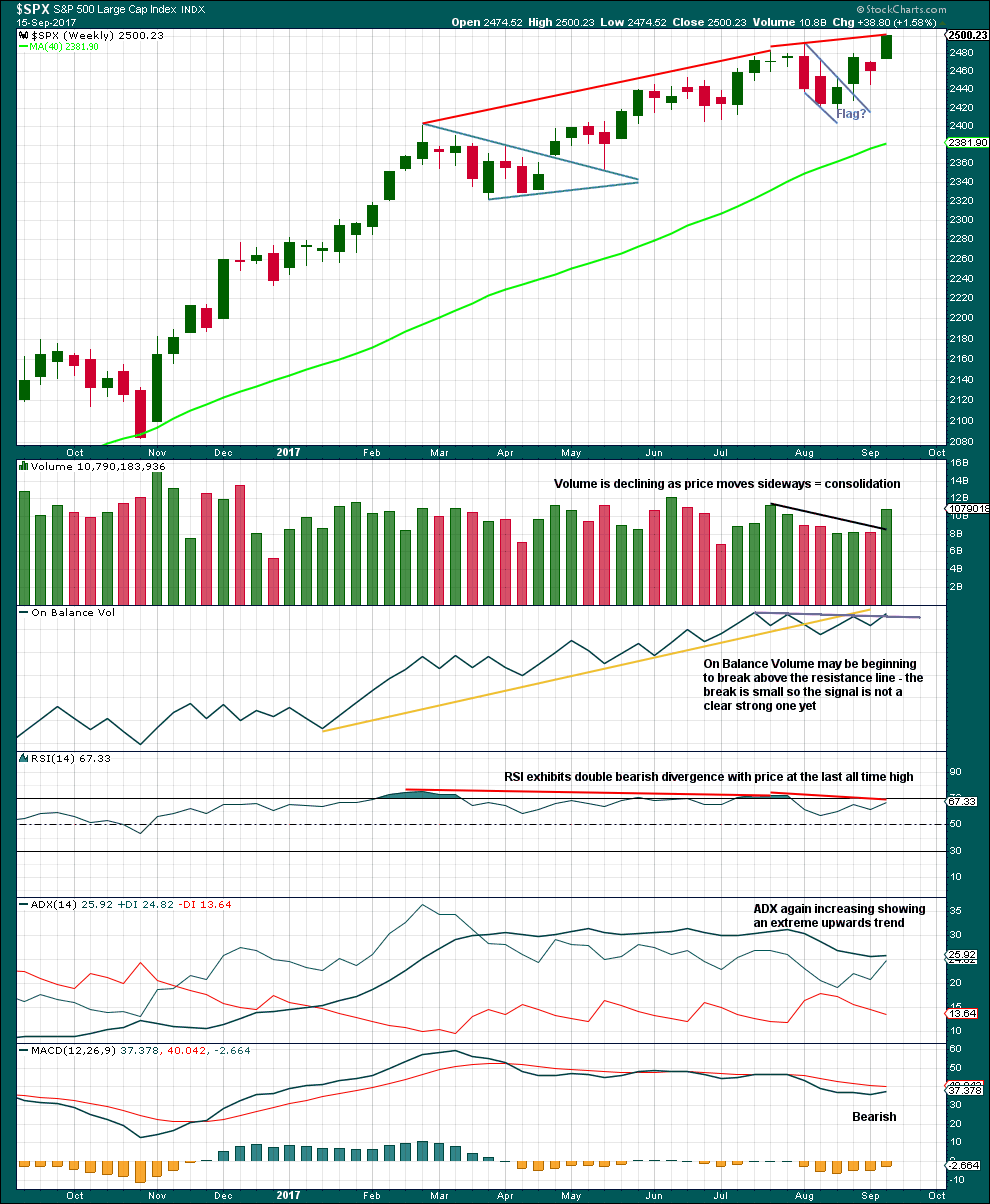
A strong weekly candlestick gaps higher and has support from volume. This looks like a classic upwards breakout after a small consolidation, and there may have been a small flag pattern in it. This supports the second Elliott wave count.
If the flag pole is taken from 2,405.70 to 2,490.87, then a target for the next wave up may be about 2,527.
On Balance Volume looks like it may be breaking above the resistance line. However, the break is very small and so is unclear. One more upwards week would make it much clearer and then confidence may be had in the signal.
ADX is extreme and RSI now exhibits double bearish divergence. This trend is very extreme; beware that the first wave count may still be correct.
DAILY CHART
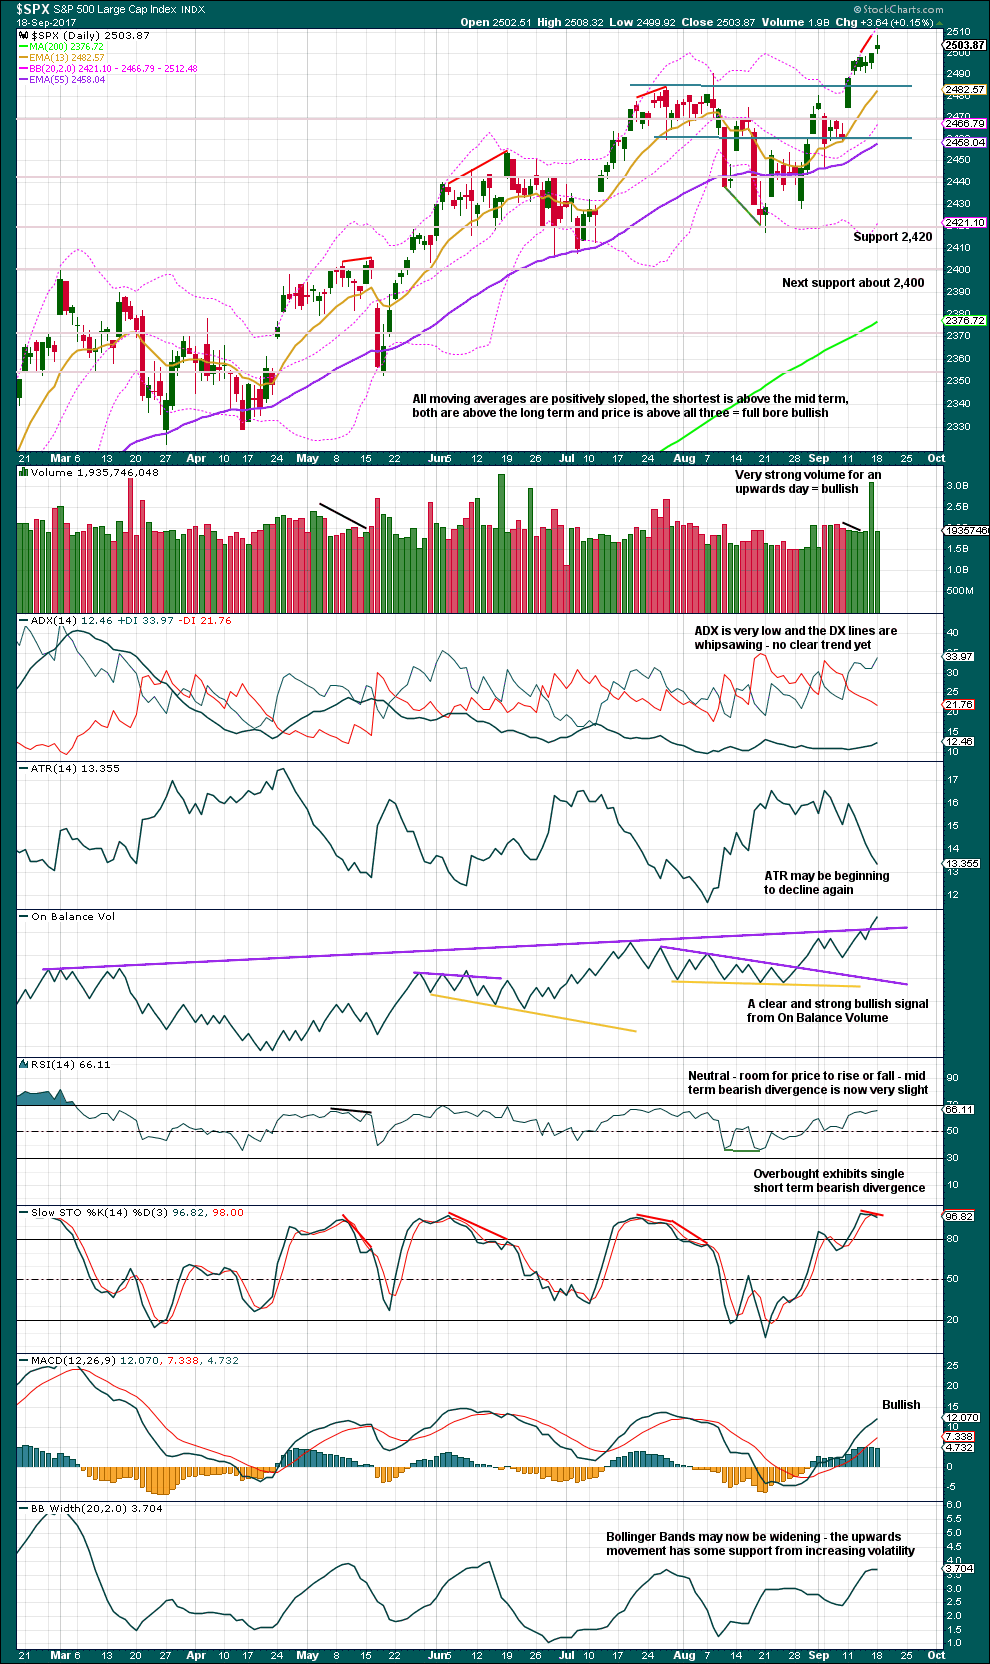
Click chart to enlarge. Chart courtesy of StockCharts.com.
Another green daily candlestick moves price higher with a slight increase in volume over the session of the 14th of September. Even if the volume spike of the triple witching day is ignored, there is still some support here from volume for upwards movement. This supports the second Elliott wave count.
Further support for the second Elliott wave count comes from: On Balance Volume, MACD and Bollinger Bands widening.
RSI is not yet extreme, so there is a little room for price to rise.
A small warning today is sounded by Stochastics exhibiting divergence, but this can develop further (or just disappear). As it is only single divergence and not multiple, it is a small warning. Wait for RSI to do the same; if that happens, the warning would be stronger.
VOLATILITY – INVERTED VIX CHART
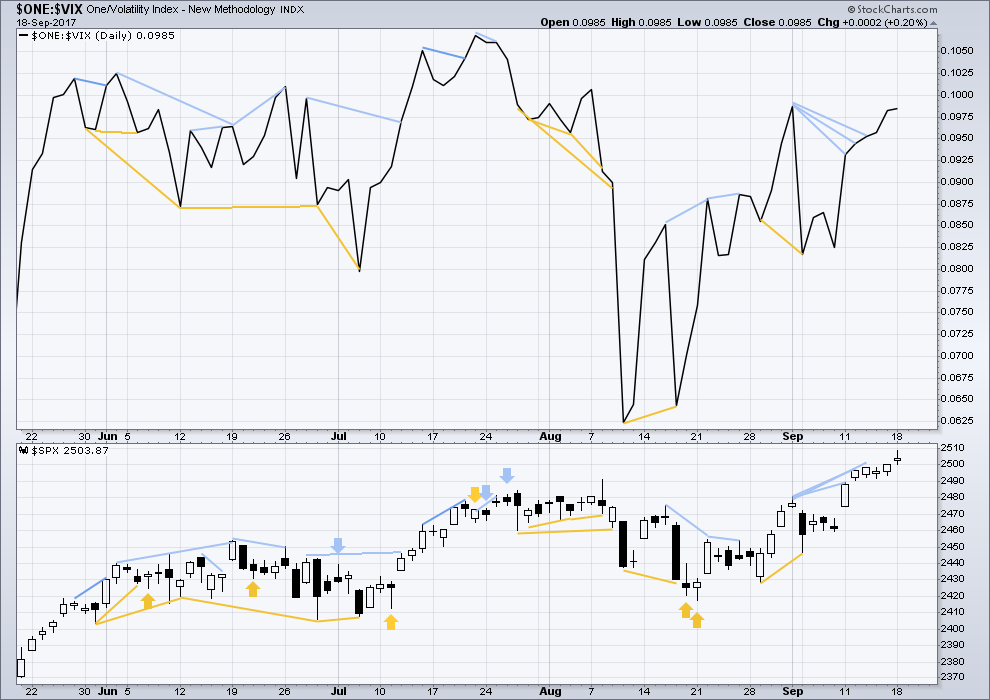
Click chart to enlarge. Chart courtesy of StockCharts.com.
Normally, volatility should decline as price moves higher and increase as price moves lower. This means that normally inverted VIX should move in the same direction as price.
There is still mid and longer term bearish divergence, but it has been noted in the past that divergence over a longer term does not seem to work as well for VIX. Short term bearish divergence is still present, but it is far too small to note here.
BREADTH – AD LINE
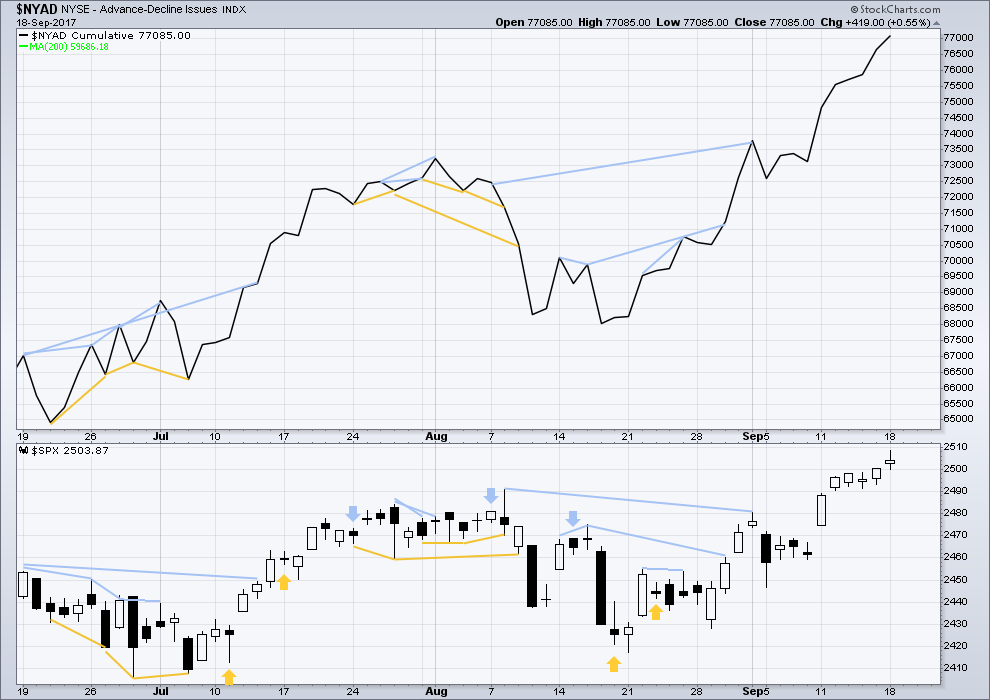
Click chart to enlarge. Chart courtesy of StockCharts.com.
With the last all time high for price, the AD line also made a new all time high. Up to the last high for price there was support from rising market breadth.
There is normally 4-6 months divergence between price and market breadth prior to a full fledged bear market. This has been so for all major bear markets within the last 90 odd years. With no divergence yet at this point, any decline in price should be expected to be a pullback within an ongoing bull market and not necessarily the start of a bear market.
There is again no new divergence today between price and the AD line. The new high today for price has support from rising market breadth. This is bullish.
I have learned recently from Lowry’s reports that market breadth may lead price. I had previously interpreted any divergence between market highs in price and breadth as bearish, which is the usual technical interpretation. However, with Lowry’s expertise in the area of market breadth I will change my approach to this indicator and read any future divergence between market highs, with breadth higher than price, as a bullish leading indicator.
DOW THEORY
The S&P’s new all time high last week is confirmed by DJIA and Nasdaq also making new all time highs. However, DJT has not yet made a new all time high, so the continuation of the bull market at this stage lacks confirmation.
The following lows need to be exceeded for Dow Theory to confirm the end of the bull market and a change to a bear market:
DJIA: 17,883.56.
DJT: 7,029.41.
S&P500: 2,083.79.
Nasdaq: 5,034.41.
Charts showing each prior major swing low used for Dow Theory are here.
Published @ 11:55 p.m. EST.
Second preferred hourly chart updated:
Sub-micro (5) may be extending. Or I have to move the degree of labelling within micro 5 all down one degree.
A slow limp higher still is expected, a continuation of what’s been happening all year pretty much.
The more stretched this gets and extreme every thing gets, the greater the risk of a quick collapse in a day. Always use stops, and consider taking profits a bit earlier than you may otherwise do in this market.
If we are gong to get a black swan, I am expecting it will happen in the futures market. I am watching with great interest as I continue to accumulate vol! 🙂
Reminded recently of some very sage advice by a market legend:
“After spending many years in Wall Street and after making and losing millions of dollars I want to tell you this: It never was my thinking that made big money for me. It was always my sitting.” — Jesse Livermore
The sojourn in the land of price delusion seems to be finally ending for the automotive sector with ORLY and AZO down hard today. Remarkably, the dumb money that has bid up AN to nose bleed prices are being slow to recognize what is coming next. It will give up the gains a lot faster that it took to accumulate them. Look at that AZO candle; that is brutal! 🙂
KSS is also trading at laughable evaluations and due to fall hard. Glad I gave my positions lots of room to run…..
Haha, we were short ORLY, AAP, and AZO too at open today. Really, nice reversals and breakdown follow throughs. Good day for shorts in a lot of sectors eventhough the market’s up. Congrats Verne!
Way to go Chris!
Finding the weak sectors and particular names has been a real key to successful shorting recently. The indices that most folk concentrate on have been quite a crap shoot. I think there is more donwside ahead, but timely ringing of the register is not a bad idea, if ya know whatta mean…! 😉
Luckily, and thankfully the algos do the hunting for me…the 20 day ma’s were our exits, which they all hit very nicely. On to the next!
Do we have a failing micro 5 wave here?? If so…could be significant. Struggling to get back over the top of 3, for sure.
It shouldn’t fail. Therefore, I bought some UPRO. Go micro wave 5!! (Sorry, lingering bears. I’ve switched teams…)
Enjoy the ride…while it lasts! 🙂
DIdn’t last long…I do believe that micro 5 just failed…
We shall see what happens!
Market is lining up perfectly with Wednesday’s announcement.
Two points for a possible turn… either before Balance Sheet Announce (meaning anytime today or overnight or in the morning)
OR
Immediately After the Fed press conference or several trading hours after.
That’s how I see it. So we shall see soon!
I believe a shrinking Fed Balance sheet… no matter the size… will trigger the turn.
“It will NOT be different this Time”!
I don’t care what all the so called experts will say.
Here is the trillion dollar ( or should I say 4.2 trillion!), who is going to take those assets off the FED’s clammy hands…..hmmnnn?
At $10 – $30 Billion a month, and a turn in the equity market… there will be plenty of buyers… at least for the 1st Trillion. IMO
All bets are off after that.
Apart from the bloated FED balance sheet, why is the market apparently oblivious to the threat of impending nuclear exchanges between NK and the US?
Is the investing community that clue-less as to think the sitting American president is going to allow the megalomaniac in the DPRK to actually perfect weapons that can actually reach the continental US???!!
It has got to be obvious to even the most doltish that war is in the wind. Nothing has convinced me more of the complete broken-ness of global equities markets than their ability to ignore what is so plainly in the cards. It must be something in the water….!
The markets believe all is well and going to 40K Dow… ZERO Fear of correction and zero fear of anything else!
Buy an hold through anything an get rich! Never sell any!
Looking back… I have to give it to them. If you have not sold any position in index funds or ETFs the last 35 Years and reinvested all along the way, you would in fact be rich today! That’s easier said than done… but the math doesn’t lie!
It is also entirely possible that the FED meeting will turn out to be a non-event. It really does appear to me that the banksters have taken an “all-in” posture and are determined to do whatever they deem necessary to keep the bubble inflated up to and including an announcement of a delay in their unwinding of the balance sheet. I really do not see that they have any other choice. In fact I would argue that this die was cast quite a long time ago, when they decided they were going appoint themselves Lords of the financial universe, and now they are stuck with that mandate, until the market itself decides to break them. What an unbelievable spider’s web they have spun, now they themselves are entangled!
It looks like an ending diagonal so far….
Could be…what would be “perfect” is a kick up just past 2510 here to precisely complete the 1.27 extension, AND complete some semblance of the micro 5 wave up. Then the next level 4 (a yellow iv on the second hourly) kicks in and price quickly drops to wallow some more in the 2493-2500 range. Could be…meanwhile, I’ve several longs working the proper side of the trend (all of them).
This micro 5 doesn’t look very impulsive yet. Double top? More likely, forming a barrier triangle (bottom trend line through lows on 9/15 and 9/18)? If so, should bust upward. All timeframe trend measures say up. EW says up. We’ll see.
Another interesting development that underscores the Alice -in-wonderland quality of the world’s current financial situation. I was truly amazed at the market’s absolute refusal to price in the implications of Puerto Rico’ s debt default. So far as I can tell those losses have yet to show up anywhere. It is a roughly 70 billion loss that will have to show up somewhere sooner or later. Now comes the astonishing revelation by the BIS that it has “discovered” 14 TRILLION in derivative debt in off shore accounts that is nowhere to be found listed as a liability by the parties trading them. I want everyone to stop and consider the implications for the kind of market evaluations we are seeing with a liability this size recorded only in banks’ foot-notes. We suspected that the market was failing to properly price risk to keep equities afloat. It now appears to have risen to a level of criminality in that there has been a conspiracy to actually conceal and misrepresent it. Trade carefully.
Thanks for the info Vern. Sounds to me like a Black Swan in the making. That is why I mentioned the other day when I liquidated my long positions for a profit, “Now I have no downside risk.” While long, I could not help but be concerned about the multitude of downside risks the market could experience. Today Fraulein Yellin may tell the world she has 4.5 trillion dollars worth of assets she would like to sell. Let’s see if she can unload them without driving the markets down as much as purchasing them drove the markets up.
I agree, trade carefully.
Most welcome!
The FED is in an interesting position. If they are serious about unwinding that monstrous position (and they had better if they want to maintain any semblance of solvency) they cannot do it without having a huge impact on the markets. It would amount to substantial money tightening and put significant downward pressure on markets worldwide as the dollar rises, and servicing dollar denominated debt becomes more costly. The FED cannot have it both ways. It will be interesting to see whether they opt for an attempt at self-preservation, or to keep the charade going a while longer….
Isn’t funny it’s in the ledger/foot notes of the “should be regulator” of the central banks? I really hope the public realizes the fleece job they’ve been subjected to.
There contention that they recently “discovered” the accounts really displays their contempt for Joe six-pack. There is a reason why we call ’em banksters.
Dear Lara i have a question regarding ”Grand Super Cycle wave I to end is at 2,926”.
when will we know what is the target for the 4th wave before the 5 of 2,926?
You’re referring to primary wave 4 for the second wave count I assume.
That is the last large fourth wave correction within cycle wave V on up to the target 2,926.
For the second wave count I cannot answer that, as it has not begun. So I can have no idea where it may end. It should find support at a trend line though.
woo hoo,, too