
Price moved to record new all time high.
Summary: On Balance Volume after Friday’s session gives bullish signals which support the alternate Elliott wave count. A short term target is at 2,531 in the first instance.
If Monday sees price move lower, then a new low below 2,480.38 would be required for confidence in the main wave count and primary wave 4 unfolding.
The new high has support from rising market breadth and volume, but this trend is still extreme.
Last monthly and weekly charts are here. Last historic analysis video is here.
ELLIOTT WAVE COUNT
WEEKLY CHART
Click chart to enlarge.
While the wave counts are still labelled main and alternate, classic analysis this week points to the alternate being more likely. I will wait one more day for bullish On Balance Volume signals to be clearer before swapping them over. For now, know that this main wave count looks less likely.
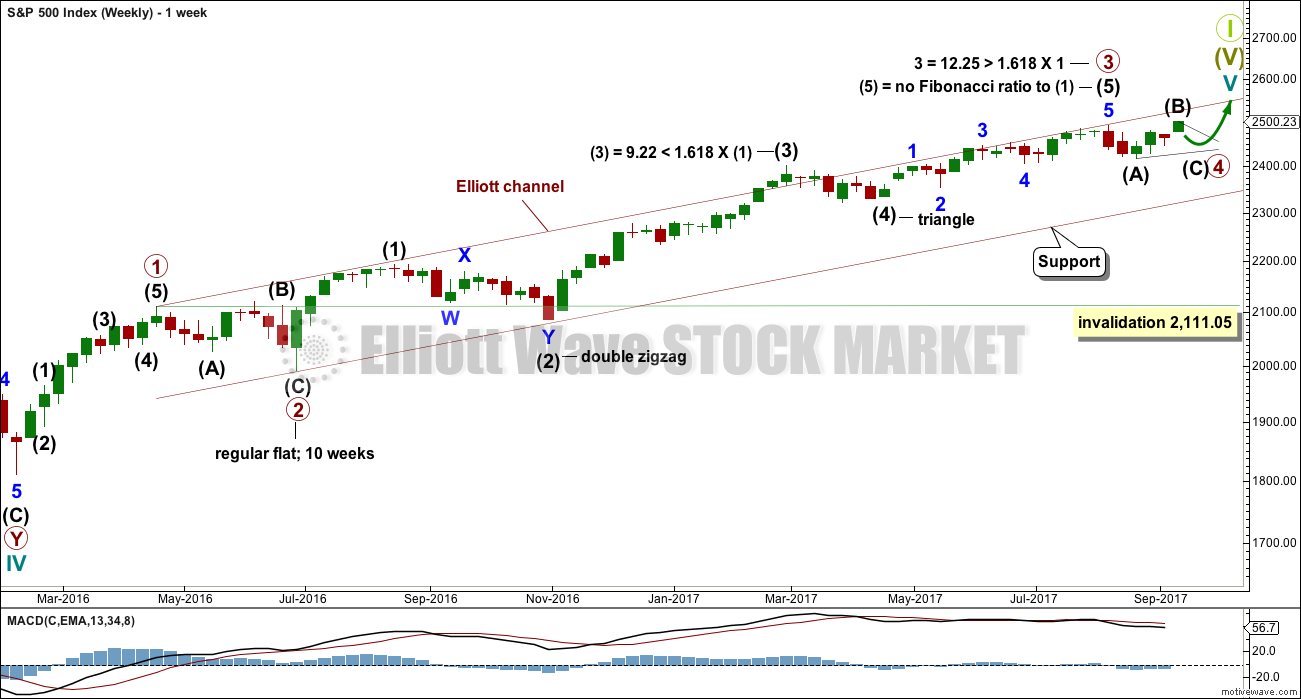
Primary wave 3 now looks complete. Further and substantial confidence may be had if price makes a new low below 2,480.38 now. That would invalidate the alternate published below. Fibonacci ratios are calculated at primary and intermediate degree. If primary wave 3 is complete, then it still exhibits the most common Fibonacci ratio to primary wave 1.
Primary wave 4 may not move into primary wave 1 price territory below 2,111.05.
Primary wave 4 should last about 8 weeks minimum for it to have reasonable proportion with primary wave 2. It is the proportion between corrective waves which give a wave count the right look. Primary wave 4 may last 13 or even 21 weeks if it is a triangle or combination. So far it may have completed its fourth week.
If primary wave 4 unfolds as a single or double zigzag, then it may find support about the lower edge of the maroon Elliott channel. If it is a triangle or combination, it may be more shallow, ending about mid way within the channel. At this stage, a single zigzag has been invalidated and a double zigzag is discarded based upon a very low probability. It looks like primary wave 4 is to be a very shallow sideways consolidation rather than a deeper pullback.
Only two daily charts are now published for primary wave 4: a triangle and a combination. It is impossible still for me to tell you with any confidence which of these two structures it may be. The labelling within each idea may still change as the structure unfolds.
The daily charts are presented below in order of probability based upon my judgement.
The final target for Grand Super Cycle wave I to end is at 2,500 where cycle wave V would reach equality in length with cycle wave I. If price reaches the target at 2,500 and either the structure is incomplete or price keeps rising, then the next target would be the next Fibonacci ratio in the sequence between cycle waves I and V. At 2,926 cycle wave V would reach 1.618 the length of cycle wave I. The target at 2,500 now looks to be too low, particularly if primary wave 4 is shallow.
DAILY CHART – TRIANGLE
Click chart to enlarge.
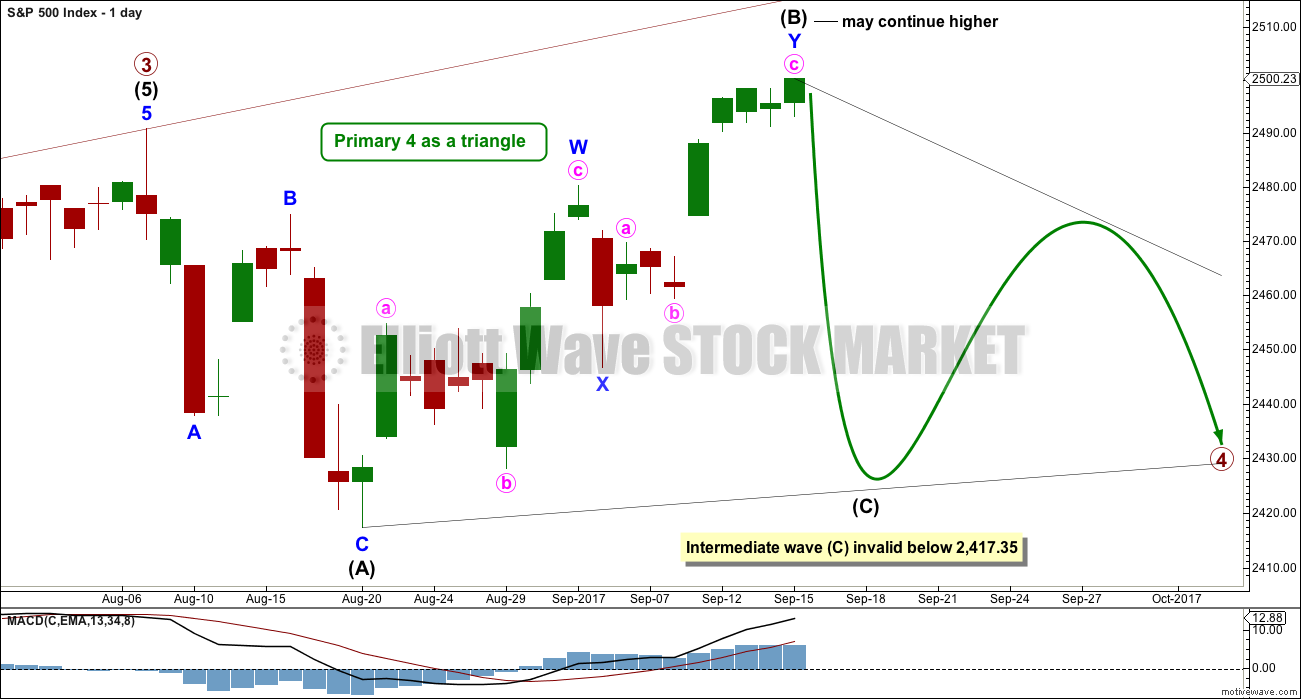
This first daily chart will illustrate how price might move if primary wave 4 unfolds as a triangle.
Intermediate wave (B) may be continuing higher as a double zigzag. One of the five sub-waves of a triangle should be a more complicated multiple; most commonly that is wave C, but it may be any sub-wave. Intermediate wave (B) has made a new all time high, so it may be a running triangle.
The triangle may still last a total of at least eight weeks, but so far it has lasted five weeks and may only be completing wave B. It now looks like it will need to take longer. If longer, then a Fibonacci 13 or 21 weeks may be expected.
Both intermediate waves (A) and (B) look like three wave structures.
Intermediate wave (C) may not move beyond the end of intermediate wave (A).
HOURLY CHART – TRIANGLE
Click chart to enlarge.
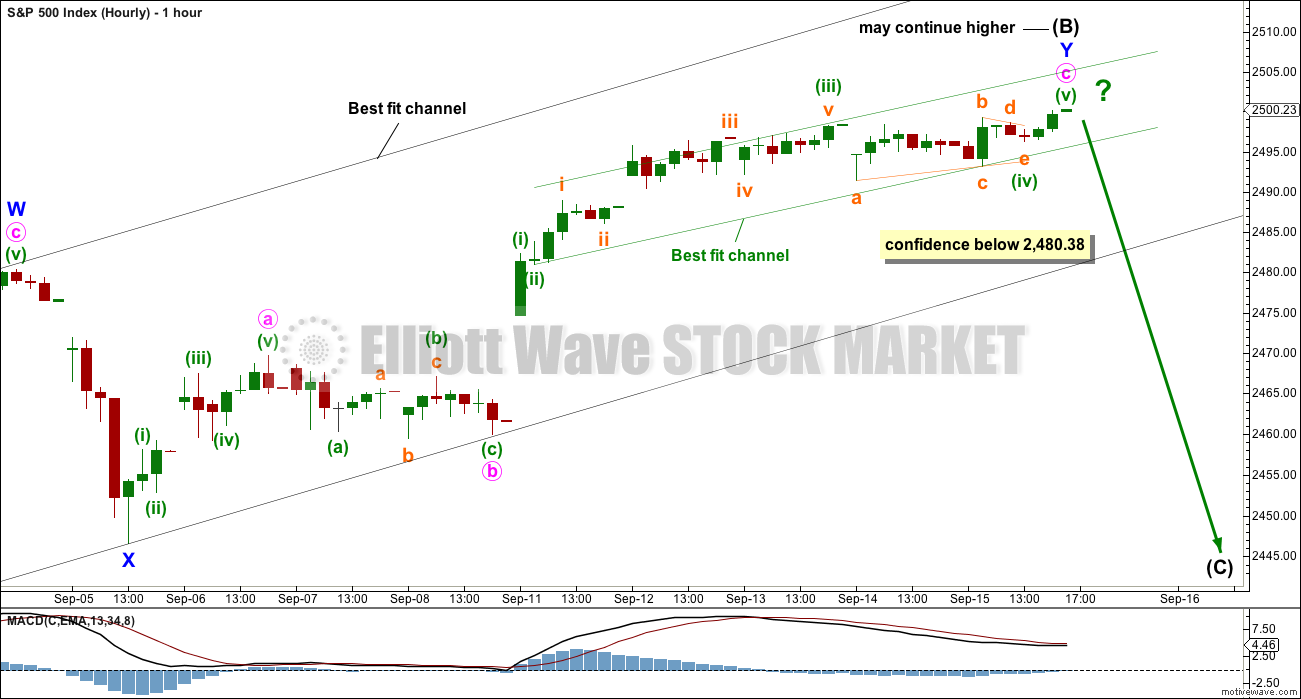
A double zigzag may be complete for intermediate wave (B).
Use the black best fit channel. If price breaks below the lower edge, then expect the upwards swing is over and the next swing down has begun. While price remains within this channel, then it is entirely possible price may continue higher; minute wave c may not be complete.
There is still zero evidence of a trend change. A new low below 2,480.38 is required for any confidence that a high is in place.
We should assume that the trend remains up while price remains within the black channel and above 2,480.38.
DAILY CHART – COMBINATION
Click chart to enlarge.
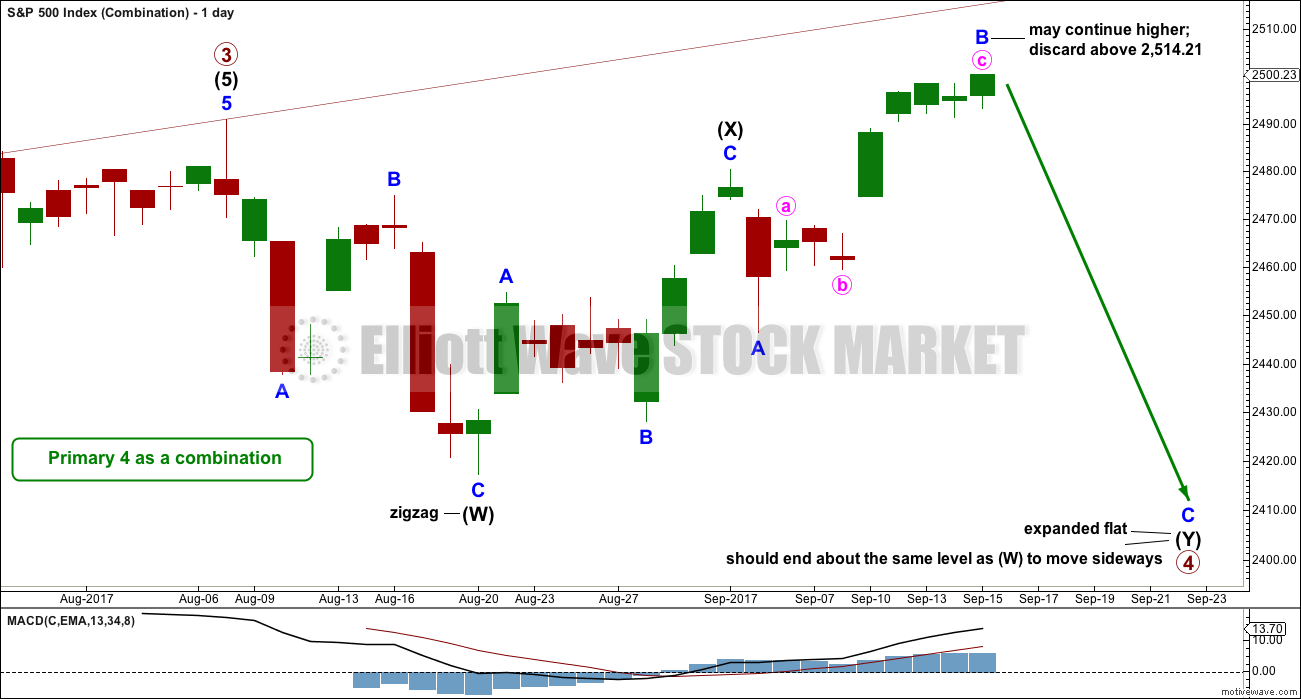
A combination for primary wave 4 would still offer some alternation with the regular flat of primary wave 2. Whenever a triangle is considered, always consider a combination alongside it. Very often what looks like a triangle may be unfolding or may even look complete, only for the correction to morph into a combination.
There may only be one zigzag within W, Y and Z of a combination (otherwise the structure is a double or triple zigzag, which is very different and is now discarded). At this stage, that would be intermediate wave (W), which is complete.
Combinations are big sideways movements. To achieve a sideways look their X waves are usually deep (and often also time consuming) and the Y wave ends close to the same level as wave W.
Here, intermediate wave (X) is very deep.
Intermediate wave (Y) may be a flat correction or a triangle. A flat correction should be expected for intermediate wave (Y).
Intermediate wave (Y) may be unfolding as an expanded flat, the most common variety. So far minor wave B may be a 1.59 length of minor wave A, longer than the most common range of up to 1.38. If minor wave B reaches twice the length of minor wave A at 2,514.21, then the idea of an expanded flat should be discarded based upon a very low probability.
It is also possible that intermediate wave (X) is continuing higher as a double zigzag, as labelled on the triangle daily chart. While waves W, Y and Z within combinations may only be simple corrections labelled A-B-C (or A-B-C-D-E as in the case of triangles within combinations), the X waves within combinations may be any corrective structure including multiples. However, while this is valid, it is fairly unusual. I am always uncomfortable with labelling X waves as multiples until price proves in hindsight that they were, because of the low probability.
Minor wave C should move below the end of minor wave A. This structure may take another few weeks to complete.
ALTERNATE WAVE COUNT
WEEKLY CHART
Click chart to enlarge.
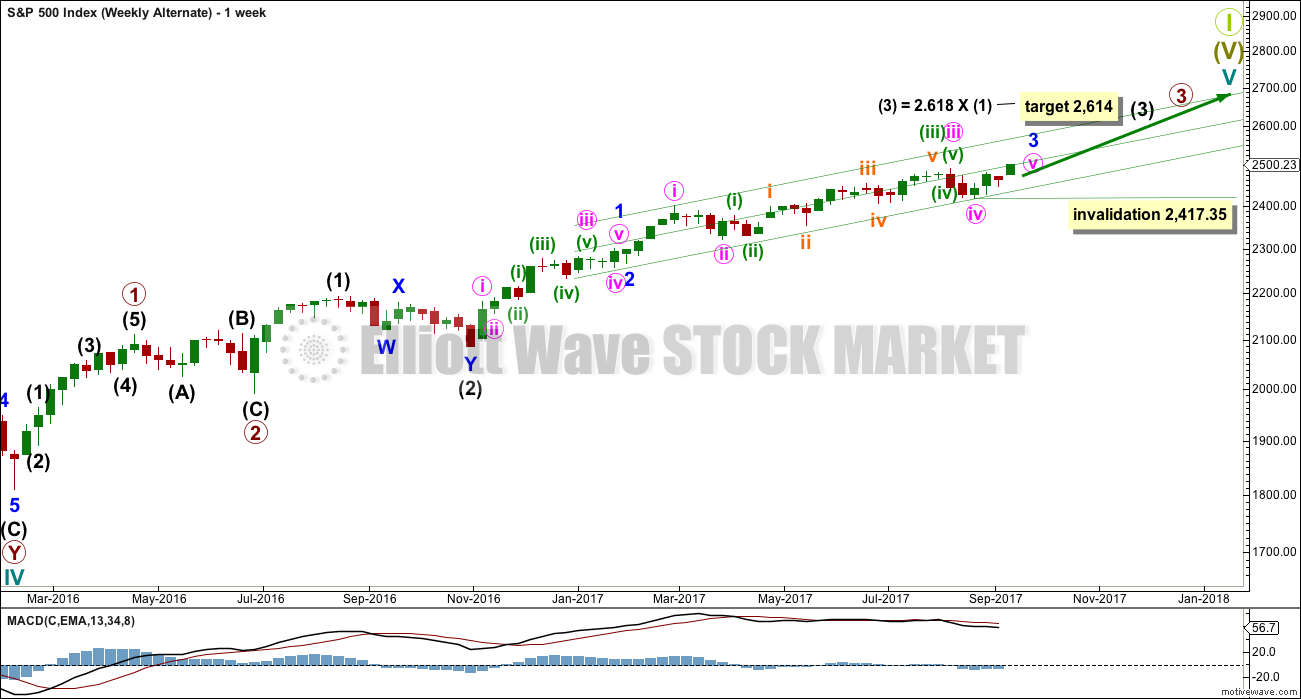
This alternate is new in response to concerns from all of us now that primary wave 3 may not be over.
If primary wave 3 isn’t over, then how would the subdivisions fit? Would it fit with MACD? What would be the invalidation point and would the Fibonacci ratios be adequate?
Of several ideas I have tried, this one has the best fit in terms of subdivisions and meets all Elliott wave rules.
However, this wave count is manufactured and forced. It does not fit with MACD. Because this possible third wave, if it is not over, exhibits long term and persistent weakness this wave count must be judged to have a very low probability. However, it now has some support at the end of this week from technical analysis with bullish signals from On Balance Volume.
Within minute wave v, no second wave correction may move beyond the start of its first wave below 2,417.35.
Low probability does not mean no probability. Low probability outcomes do occur sometimes, and when they do they are never what was expected as most likely. That is the nature of probability.
DAILY CHART
Click chart to enlarge.
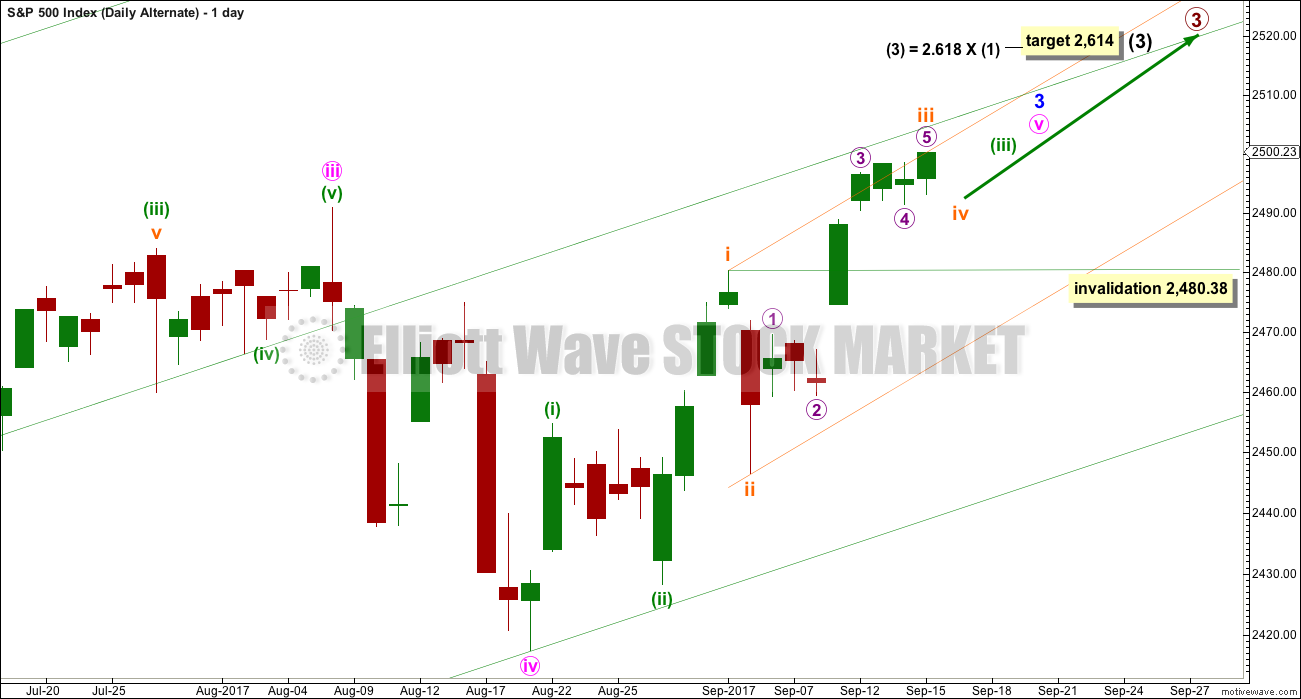
To see details of the whole of primary wave 3 so far and compare and contrast with the main wave count, see last analysis here.
Minute wave v to complete minor wave 3 must subdivide as a five wave structure. It looks like an incomplete impulse. Within the impulse, subminuette wave iv may not move into subminuette wave i price territory below 2,480.38.
HOURLY CHART
Click chart to enlarge.
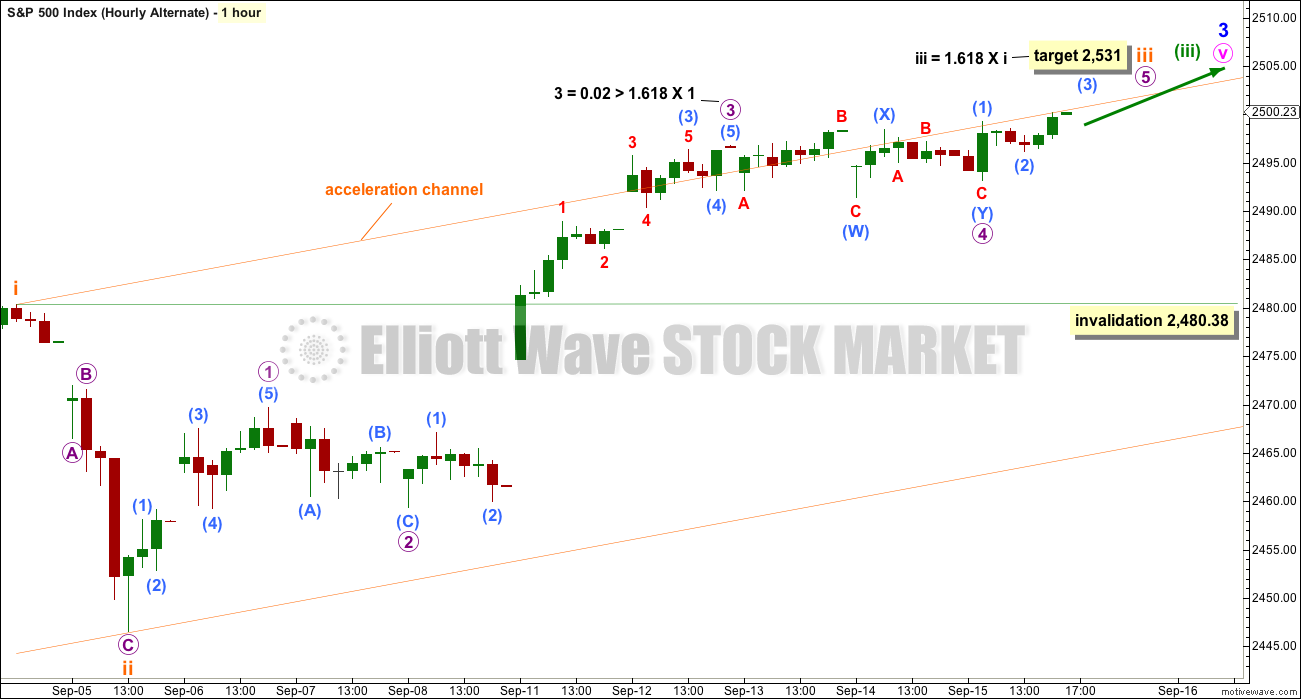
At the hourly chart level, this wave count now has a better look. It looks like sideways movement over the last few days was a small fourth wave counterpart to a prior second wave correction ending on the 8th of September. These are labelled at micro degree.
A short term target is provided. Because there is such an excellent Fibonacci ratio already between micro waves 1 and 3, micro wave 5 may not exhibit a Fibonacci ratio to either of micro waves 3 or 1. The target is best calculated only at subminuette degree.
When subminuette wave iii is over, then subminuette wave iv should be a shallow correction lasting about one to three days.
TECHNICAL ANALYSIS
WEEKLY CHART
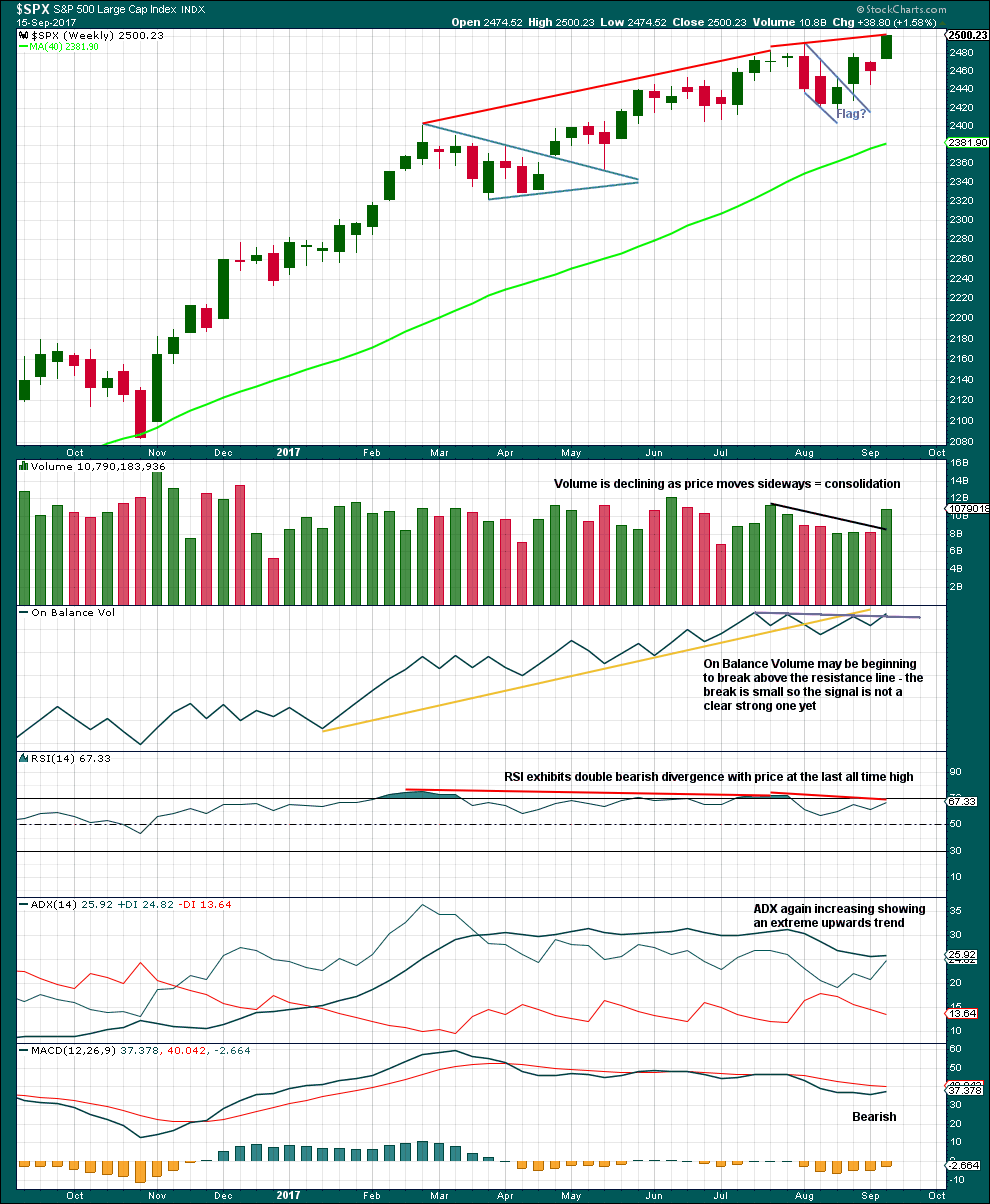
Click chart to enlarge. Chart courtesy of StockCharts.com.
A strong weekly candlestick gaps higher and has support from volume. This looks like a classic upwards breakout after a small consolidation, and there may have been a small flag pattern in it.
If the flag pole is taken from 2,405.70 to 2,490.87, then a target for the next wave up may be about 2,527.
On Balance Volume looks like it may be breaking above the resistance line. However, the break is very small and so is unclear. One more upwards week would make it much clearer and then confidence may be had in the signal.
ADX is extreme and RSI now exhibits double bearish divergence. This trend is very extreme; beware that the main wave count may still be correct.
DAILY CHART
Click chart to enlarge. Chart courtesy of StockCharts.com.
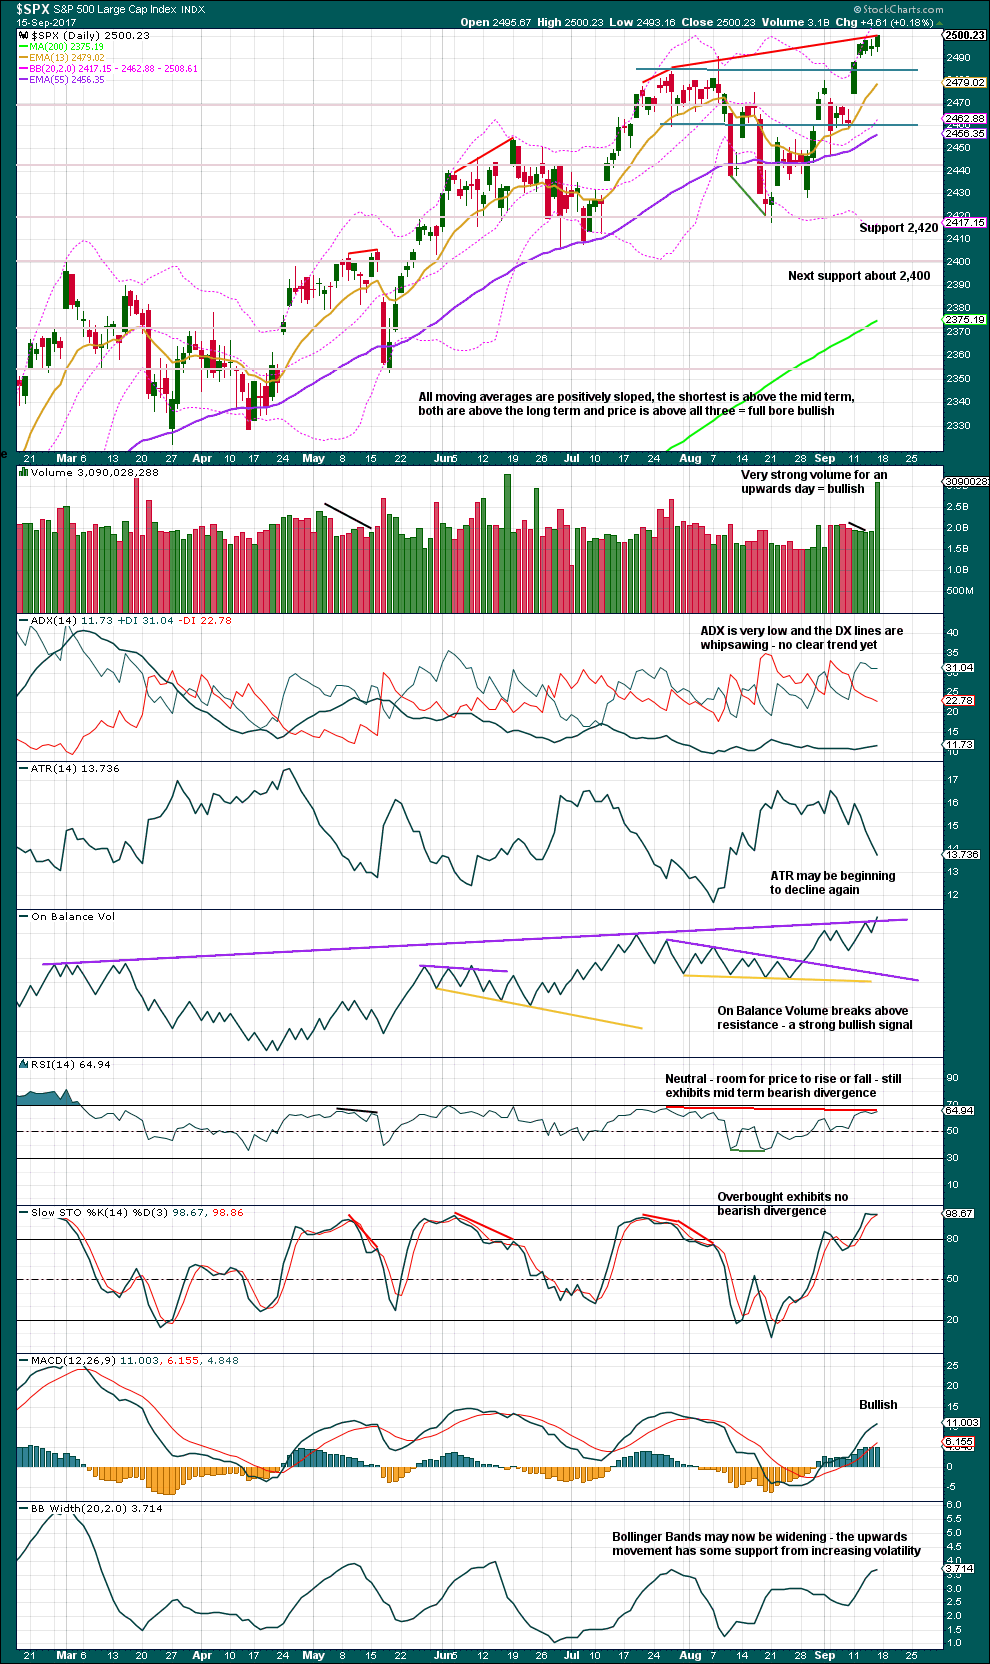
A strong upwards day has strong support from volume. Although this is due to a triple witching day, notice must still be taken of it. Upwards movement does still have support from volume now, so it is no longer suspicious.
The bullish signal from On Balance Volume at the daily chart level is slightly clearer than at the weekly chart level. This trend line is very long held and has been tested multiple times. The slope is not too strong. This line has very strong technical significance. If Monday closes green and the breach is clearer, and On Balance Volume remains above the line, that shall be taken as a conclusive very strong bullish signal in favour of the alternate wave count.
For now the breach is very small, and there is some small leeway in exactly how the line may be drawn. It is not clear enough for full confidence today in the alternate wave count.
The trend is supported by widening Bollinger Bands, but not increasing range. There is still some weakness.
VOLATILITY – INVERTED VIX CHART
Click chart to enlarge. Chart courtesy of StockCharts.com.
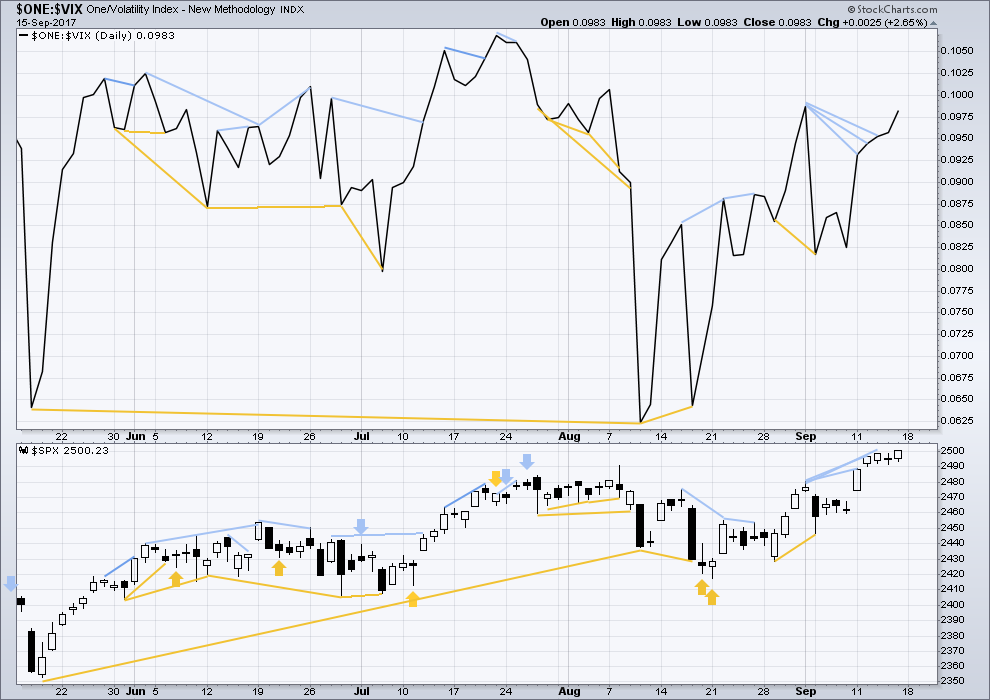
Normally, volatility should decline as price moves higher and increase as price moves lower. This means that normally inverted VIX should move in the same direction as price.
Short term bearish divergence has failed. There is still mid and longer term bearish divergence, but it has been noted in the past that divergence over a longer term does not seem to work as well for VIX. With short term bearish divergence still present but now very weak indeed, it will not be noted and will be given no weight.
BREADTH – AD LINE
Click chart to enlarge. Chart courtesy of StockCharts.com.
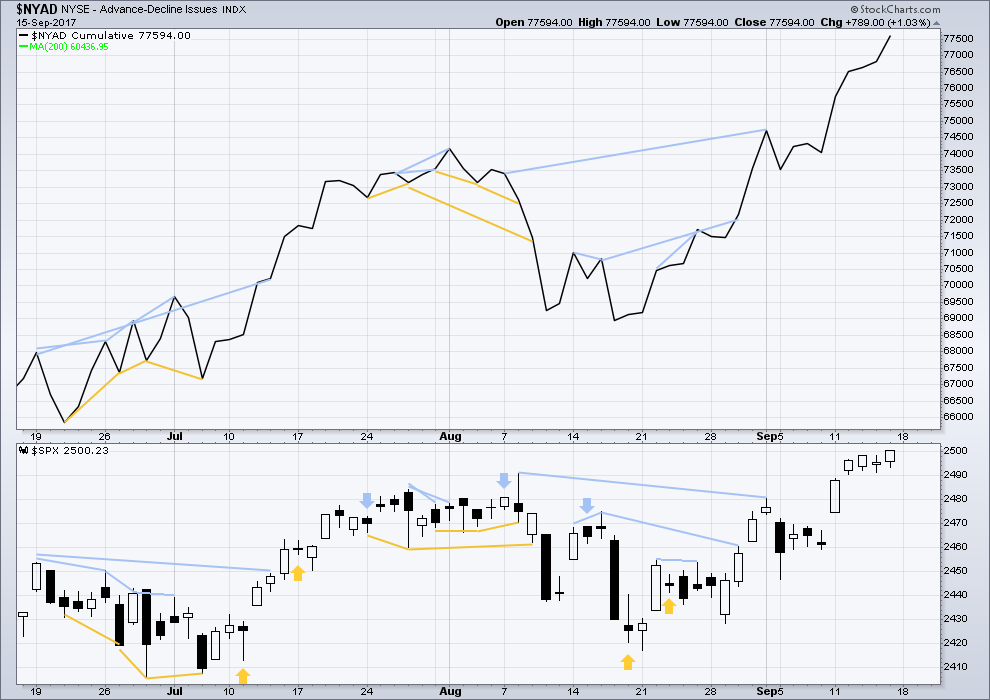
With the last all time high for price, the AD line also made a new all time high. Up to the last high for price there was support from rising market breadth.
There is normally 4-6 months divergence between price and market breadth prior to a full fledged bear market. This has been so for all major bear markets within the last 90 odd years. With no divergence yet at this point, any decline in price should be expected to be a pullback within an ongoing bull market and not necessarily the start of a bear market.
There is again no new divergence today between price and the AD line. The new high today for price has support from rising market breadth. This is bullish.
DOW THEORY
The S&P’s new all time high this week is confirmed by DJIA and Nasdaq also making new all time highs. However, DJT has not yet made a new all time high, so the continuation of the bull market at this stage lacks confirmation.
The following lows need to be exceeded for Dow Theory to confirm the end of the bull market and a change to a bear market:
DJIA: 17,883.56.
DJT: 7,029.41.
S&P500: 2,083.79.
Nasdaq: 5,034.41.
Charts showing each prior major swing low used for Dow Theory are here.
Published @ 11:49 p.m. EST on 16th September, 2017.
Well, it looks like the algos are programmed to keep DJI pinned against the upper B bands for the foreseeable future. The price pattern is a repeat of what we saw in the July/August time frame and if duration is similar price should continue higher the rest of the week, also keeping SPX aloft for the duration. I will continue to accumulate vol at these amazingly low levels. Cheerio!
One think I have learned about trading the last few years is that you have to be willing to be flexible and willing to adapt when the market changes The market makers got tired of my bread-and-buitter credit spread trades and decided to throw me a few curve balls. Twice in the last few weeks I woke up to find several hundred thousand dollars in my trading accounts that I had not put there. You can imagine what a surprise that is!
I quickly discovered that the short leg of a credit spread I was in had been exerrcised despite the expiration date being several weeks out. In all the years I been trading spreads this has happened only once or twice in the past and was usually a subterfuge around a dividend date to try an get you on the hook for the dividend by being short the stock ex-dividend. I cannot recall ever having this happen to me twice in a two week span. It is really annoying, especially if you are a bit underwater on the trade at the time as they are forcing you to lock in your losses when you immediately buy to cover. This of course called for a bit of tweaking in my approach.
I made two important adjustments to the way I chose my spreads.
First, although it was a bit more costly, I started making sure that both legs of the spread were in the money as this not only dissuaded the pre-mature breaking up of the spread trade, since they know you could simply exercise the remaining leg to neutralize the trade and re-enter the spread immediately if you are confident of the trade, it also makes it clear that that strategy probably will be used to defend the trade and keep it viable so they know they are wasting their time trying to knock you out of it.
I am also starting to think that this early exercise is also probably a tell that the other side of the trade expects the contracts to fall in value so choose to exercise early. I am not sure why they don’t simply just re-sell the calls rather than exercising them, since the shares on delivery also would fall along with the contract if price turned down.
I am now also leaning more toward out of the money contracts and that really puts the kibosh on early ambushes.
The market is a very dynamic, fluid and ever changing environment.
Our trading has to reflect that harsh reality methinks!
I always enjoy reminders of the many reasons why I choose to not trade with options!!
They are definitely not everybody’s cup of tea. Every now and then you get a sweet spot that cannot be matched with any other trading technique.
I was in the trading room with John Carter when he pulled off the famous million dollar TESLA trade. It was the most mind-blowing event I have ever seen. The way things are setting up in this market I think we are going to see a few similar set-ups in the not-too-distant future. I am keeping a sharp eye on Amazon. I think it is going back to around 350.00….
TESLA may also well offer up such another opportunity! 🙂
John is an great guy and also very generous. Shortly after that trade he took a trip to Haiti where he donated a whole bunch of dough, followed by a nice vacation to Branson’s Necker island. Time off well-deserved!! 🙂
Yep, me too, Kevin. I looked into options trading a few months ago and gave up before I ever made a trade. I know there are advantages to it, but there’s a level of complexity involved that makes my head spin. Maybe someday… or not.
Me too. Glad to hear I’m not the only one Curtis.
I understand the concept in theory… but putting it into practice…. nope. Don’t want to go there. Not yet.
Buying SVXY 90 strike puts expiring next Friday October 5 for 3.90, 1/5 full tranche.
Buy stop on remaining half at stop price of 4.25 bid….
If On Balance Volume is positive today then it will give a strong bullish signal and I will have to make this the main wave count.
It’s very bullish.
That is quite a long-legged doji SPX is printing today…..
Selling remaining 249.50 calls. SPX printing another shooting star today so we should at the very least get a day or two of downside price movement.
For what its worth, our algos are taking us nearly all short here, as they correctly did in March of this year. So much waning momentum and negative divergences that it’s likely to amount to something. Short interest on VXX, UVXY, VIX etc is really silly. I look forward very much to that unwind…..Lara, waves have been Pumping!!!
Also Verne, I know you’re in this trade but I could see a pretty swift 3rd wave down on crude near term!
Glad those cyclones make someone happy 🙂 There’s some bright side there.
Flatness down here, the Pacific has an identity crisis. It thinks it’s a lake.
Re your algos: This trend is extreme isn’t it. So that’s another small piece of info to add to the puzzle. Thank you Chris.
Don’t get me wrong, FL without power for a week is unfathomable, but at least we’ve had a nice run of surf. It’s looking to continue for the foreseeable future. Lara, for DJIA do get the top of 3 in March and in 5 now?
I was starting to get a but concerned with the brief pop above 50 but I do still think it is counter-trend.
So right about all the flags. While I am tempted to conclude that all the formerly bearish signals that no longer seem to pan out are no longer useful, they have to be viewed in the context of markets perpetually juiced by relentless CB purchases, and that this really does not refute the underlying market weakness these signals are sending. How long it goes on is anybody’s guess.
I think the failure to correct this year is fatal, and while I was really hoping for one more correction so we could ride the final wave up, its failure to materialize has be in very bearish state of mind…. 🙂
I don’t think those short volatility positions are going to be unwound until the bull market concludes. It is truly a head-scratcher when you consider how long they have been held. It sure is going to be quite something when the worm turns… 🙂
Well that’d be just great wouldn’t it /sarc
On Balance Volume gives a very strong bullish signal, we’d have to take that seriously, then it turns down for a pullback and negates the signal.
Meanwhile…. Gold today is disrespecting a 6 year long bear market trend line.
Just can’t get a break today 🙁
As Mr Rodney Dangerfield complained: “Can’t get NO respect!!” 😀
Of course if this monrning’s gap is filled it would negate the apparently bullish reversal….
A closer look at the chart shows even more peculiarity in the form of subsequent bearish and bullish island gap reversals…very strange market behaviour. Does anyone have any historical info on this?
No historial info, but I do agree that this seems like unusual behaviour from the S&P.
It’s gappy. Like an equity, not like the large index it should be behaving like. And it may be gappy (no spellcheck, NOT happy!) because of very low volume.
The higher the index climbs, the more buying power it takes to effect these gaps, even considering the persistently low volume. There is something not quite right about the price action in my view…
Is there such a thing as a REVERSE island gap? That kind of price action is what SPX is exhibiting the last few session. I am holding my calls until at the very least this morning’s gap is filled, below 249.27.
*EDIT*
I just checked and indeed there is. Island reversals can be both bullish and bearish and so we have a bullish island reversal in SPX.
It could also be called a breakaway gap – the first one that is – in such an instance.
Adding VIX October 18 13.0 strike calls for 1.00 even.
Hard to believe VIX trading at 10.00 handles.
This is the stuff of which 500 year cycle tops are made!
I sold most of my remaining SPY 249.5 calls right at the open. I have five left just as canaries in the coal mine and will be looking for either an imminent turn down, or a reload of those same strike calls for additional upside. A close above the psychologically notable 2500.00 shelf today I think means we could go as high as 2570 as DJI continues a bit higher…
Nice play. I sold my 249.5 calls at open as well. Bought near close for .44 Friday. Sold for .66 this morning. (Weds expiry)
Looking at everything overall I know about and learned about markets over my 37 years following all… My sense is today or this week is the final blow off move higher before a trend change.
Sorry but I can’t quantify that in EW speak… but I am looking overall on a large number of factors that also includes valuations.
But I have also said many times in the last several years… Long-time trusted factors/analysis and indicators have not worked.
I urge all to remember this true statement that has proven out time an time again over long-term history… “It is NEVER different this time”!
My educated guess is that once the Fed balance sheet actually starts to contract and that actual program will be announce this week in actual dollar size reductions that start October 1st… Long-time trusted factors will start to work again. The question is which will start working 1st before the others???
The “market experts” will say the announced “size reduction is too small to make a difference in the overall markets”.
I hold a different view… that no matter the size it will matter. As it will coincide with increase borrowing needs of the federal government in the USA. + possibly worldwide. Also, it may finally change the interest rate trend to a long slow increase in Treasury Yields… but there may also be a blow off lower in yields 1st should the equity markets trend actually change to the downside in 2017. Once the initial shock of an equity trend change “sinks in” only then will that slow long increase in yields be firmly in place.
This is all my opinion and is why I went short last week… but as I said then I am early in my positioning most of the time. So don’t follow my lead as it is a high risk play at this moment.
I happen to agree. While the resiliency of this market has been remarkable to the pont of being uncanny, the continued failure to undergo even a mild correction is not a good sign for the bull’s longevity.
SPX has already hit an important 17 year 1.6181 fib retracement and DJI is less than 200 points away…
I agree too. However, as a short term oriented trader (daily profit is my goal), I have to trade the market action today, and with all time frame gears cranking “up”, I’m respecting that. At some point I’ll get hit with a set of small losses and perhaps a longer term hold or two when the market sharply reverses and heads south, but my goal is to be on that on the largish size to compensate. Meanwhile, I can’t wait for the (inevitable) downturn to make money, and am jumping on good long set ups and triggers every morning. As for right now, I continue to look to the 1.27% extension around 2513 as a key decision point for a possible turn.
One more time I want to point traders to UL as an awesome trading tool I’ve recently discovered (just closed a nice sized position at the morning high). Monster chart, consistent as heck, a bit slow moving but extremely well behaved and bucks the market pullbacks. If you are long oriented, definitely check it out as a possible trading vehicle.
UL? Unilever PLC
Thanks Kevin… I will watch
Do you know of any trading in the $8 to $20 range that is also a good trading stock? I like to trade individual stocks in 1000 to 3000 share increments.
Off hand, sorry, no. I personally stay away from less than $20 stocks. I prefer larger volume and price issues that have more price action stability. And less risk of what I call “stochastic shock” (i.e., news reports the CEO is embezzling and the stock opens down 40%! Almost never happens with big caps or even mid caps, but with small caps and micros…more often than I care for.)
Well… when you do see something in the $8 to $30 range (I will extend the upper end) please post. Even if a few weeks from today.
It would be appreciated.
Anything more than $30 per share, I can’t buy enough in cash (no margin) to make enough in dollar terms and stay diversified to be worth my time. For a trading position that is.
I will ask all reading here for the same in that price range.
I believe there are plenty of higher priced equities that have lots of price volatility; price volatility isn’t restricted to low price issues. If you use the finviz.com screener, select greater than 3% volatility, and greater than $30 price, you get a list of 220 symbols! Check that out.
Thanks, I am finding stocks in the price range I need with that screener + the info to make a listing of what I should study further and place on my watch list.
Thanks for the tip. I must say the chart is starting to look a bit toppyin what looks like an island reversal from the September 11 top. It might just be a good candidate for my favorite vehicle- the credit spread! 🙂
Looking at the October expiration 60/62.5 bearish call spread for giggles; they are bid at a very reasonable 0.55 per contract. I will have a mental stop if filled just above the September 11 candle high at 59.69
Sorry, I just calculated (vs. eyeballed) the 1.27% extension, and it’s at 2510.51 according to my chart data, not 2513. Almost there.
The short term work is really terrific, thank you!
You’re most welcome Kevin 🙂
I’m 100% bought in to the alternate at this point. That said, I wonder abou the structure of intermediate 3 on the weekly alternative. From a top down perspective, could the minor 1, 2 and 3 could be misplaced (the proportionality of minor 2 seems out of wack). I see better proportionality if the minor 1, 2 and 3 are where the minute 1, 2 and 3 of minor 3 are now. Then the last 4 week pullback is the minor 4 of intermediate 3, rather than minute 4 of minor 3. That puts us in minor 5 up now, and we are looking for an intermediate 4 to start, rather than a minor 4 to start. Just a quick top down thought, I’ll have to look bottoms up to see if it’s justifiable, and post a chart.
You’re right at the weekly chart level, but the reason why I have that labelling as it is, is because of how it subdivides at the daily chart level.
However, I do see your point. I’ll have another go tomorrow morning with playing about with the labelling within this third wave, and try out your idea. Have probably tried it before, but maybe next time I’ll figure it out differently.
woo hoo