
Again, last analysis warned that upwards movement may not be over and outlined what to look for to see if it was. There was room for more upwards movement, which is what has happened. A strong warning may come from On Balance Volume in the next 24 hours.
Summary: One more upwards day would give a strong bullish signal from On Balance Volume. If that happens, take it seriously and enter long.
If price turns down tomorrow, then the main wave count will still have more confidence; expect a downwards swing.
In the short term, a new low below 2,459.99 would add confidence to the view that the upwards swing is indeed over and the next swing downwards has begun.
Last monthly and weekly charts are here. Last historic analysis video is here.
ELLIOTT WAVE COUNT
WEEKLY CHART

Click chart to enlarge.
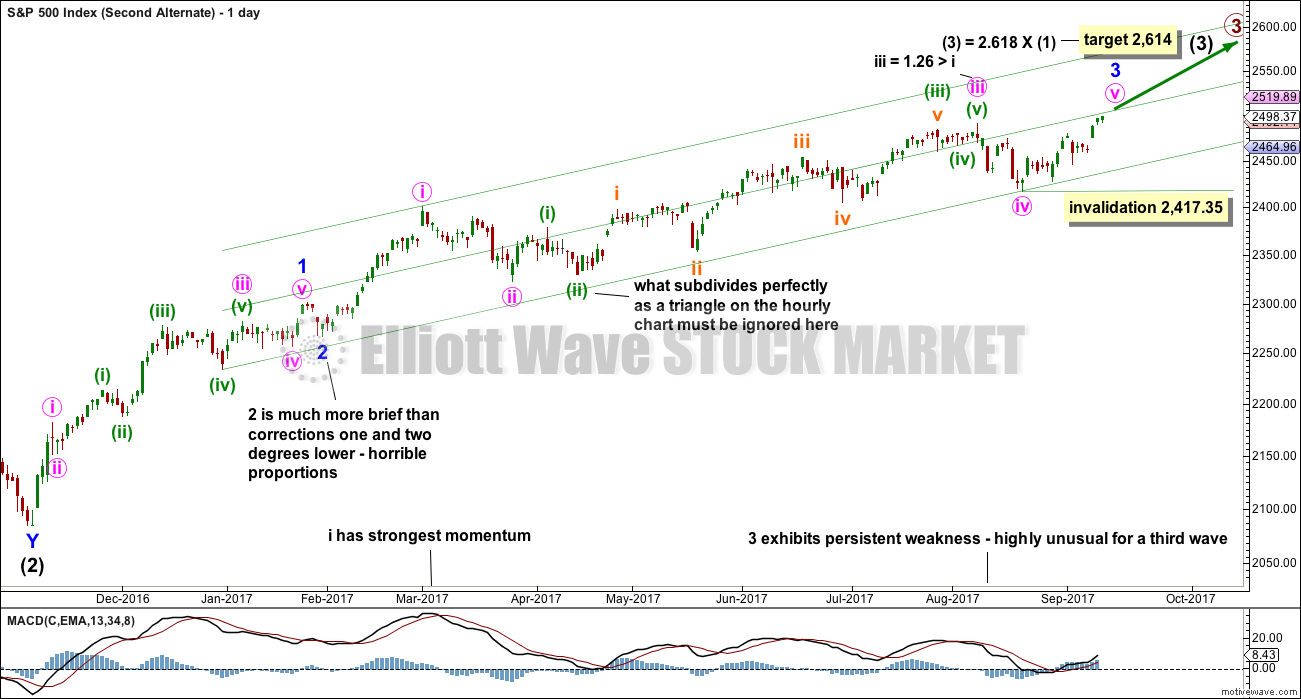
Primary wave 3 now looks complete. Further and substantial confidence may be had if price makes a new low below 2,417.35 now. That would invalidate a new alternate published below. Fibonacci ratios are calculated at primary and intermediate degree. If primary wave 3 is complete, then it still exhibits the most common Fibonacci ratio to primary wave 1.
Primary wave 4 may not move into primary wave 1 price territory below 2,111.05.
Primary wave 4 should last about 8 weeks minimum for it to have reasonable proportion with primary wave 2. It is the proportion between corrective waves which give a wave count the right look. Primary wave 4 may last 13 or even 21 weeks if it is a triangle or combination. So far it may have completed its fourth week.
If primary wave 4 unfolds as a single or double zigzag, then it may find support about the lower edge of the maroon Elliott channel. If it is a triangle or combination, it may be more shallow, ending about mid way within the channel. At this stage, a single zigzag has been invalidated and a double zigzag is discarded based upon a very low probability. It looks like primary wave 4 is to be a very shallow sideways consolidation rather than a deeper pullback.
Only two daily charts are now published for primary wave 4: a triangle and a combination. It is impossible still for me to tell you with any confidence which of these two structures it may be. The labelling within each idea may still change as the structure unfolds.
The daily charts are presented below in order of probability based upon my judgement.
The final target for Grand Super Cycle wave I to end is at 2,500 where cycle wave V would reach equality in length with cycle wave I. If price reaches the target at 2,500 and either the structure is incomplete or price keeps rising, then the next target would be the next Fibonacci ratio in the sequence between cycle waves I and V. At 2,926 cycle wave V would reach 1.618 the length of cycle wave I. The target at 2,500 now looks to be too low, particularly if primary wave 4 is shallow.
DAILY CHART – DETAIL
Click chart to enlarge.
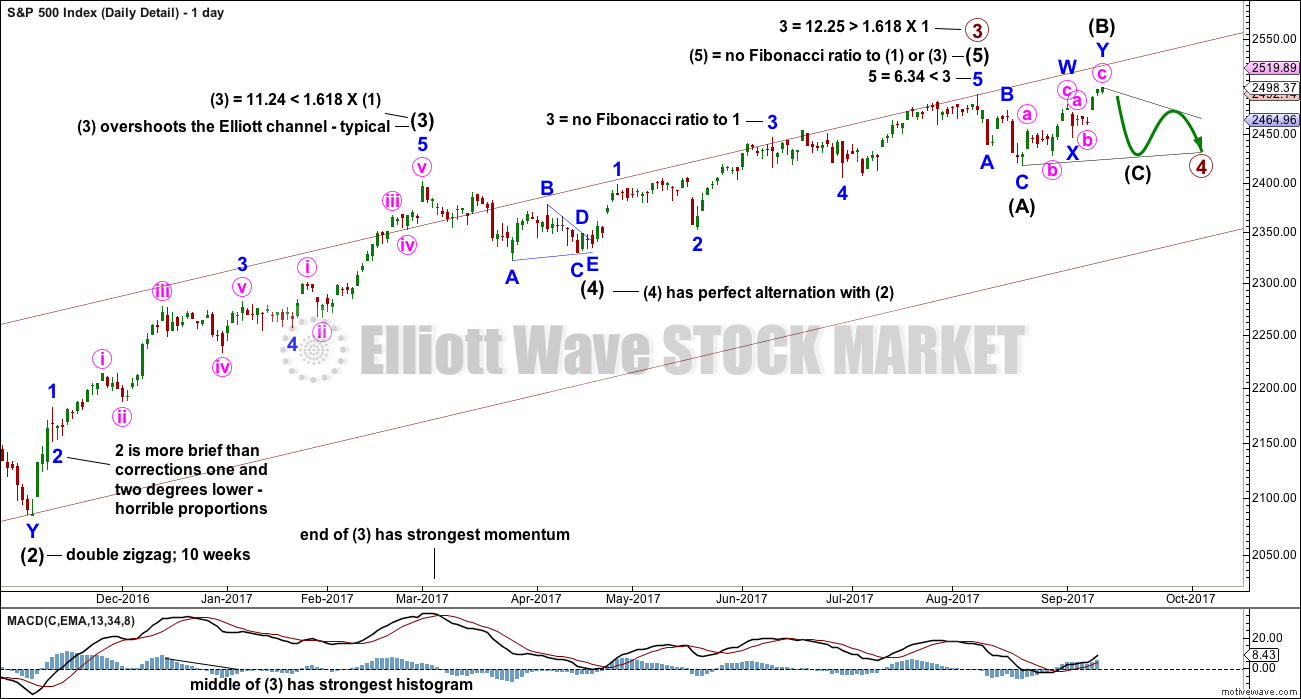
In order for members to compare and contrast this main wave count with the new alternate published below, it is necessary to publish a chart showing all movement from the low labelled intermediate wave (2), which is shown on the weekly chart. I would not want to try and see any alternate which does not have primary waves 1 and 2, and intermediate waves (1) and (2), in any other position than that labelled on the weekly chart. Any variation should be taken from that point.
This wave count fits with MACD. The end of a third wave is very often the strongest portion of MACD, and the middle of the third wave is very often the strongest portion of the histogram on MACD. In this way MACD can be used to assist in labelling an impulse.
It is very common for the S&P to exhibit Fibonacci ratios between only two of its three actionary waves within an impulse . Rarely will it exhibit Fibonacci ratios between all three actionary waves. The lack of a Fibonacci ratio for intermediate wave (5) and for minor wave 3 within it is entirely acceptable.
This wave count also fits neatly with the Elliott channel. It is extremely common for the end of a third wave within an impulse to overshoot the Elliott channel, because it is usually the strongest portion of movement.
This wave count has a neat fit in terms of subdivisions and fits with most common behaviour for this market. For this reason I have confidence in it.
The only problem here is one of proportion for minor wave 2 within intermediate wave (3). But then the S&P does not always exhibit nice proportion between its corrective waves.
DAILY CHART – TRIANGLE
Click chart to enlarge.
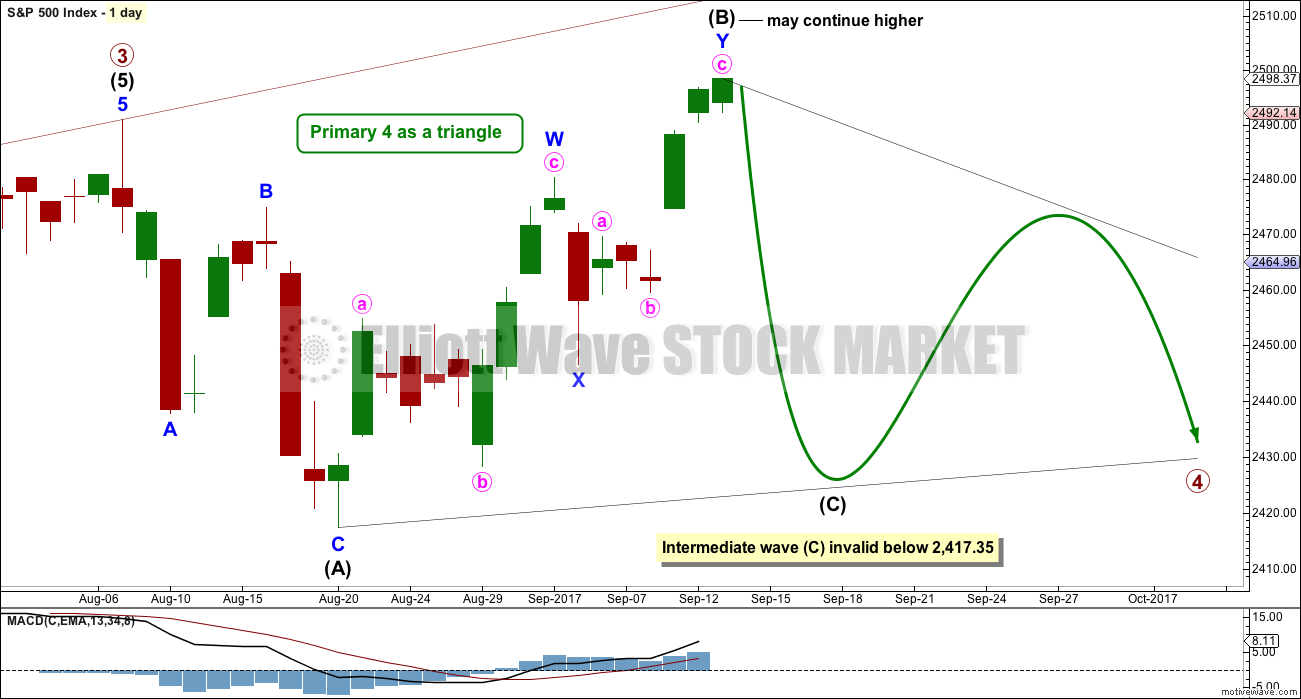
This first daily chart will illustrate how price might move if primary wave 4 unfolds as a triangle.
Intermediate wave (B) may be continuing higher as a double zigzag. One of the five sub-waves of a triangle should be a more complicated multiple; most commonly that is wave C, but it may be any sub-wave. Intermediate wave (B) has made a new all time high, so it may be a running triangle.
The triangle may still last a total of at least eight weeks, and possibly longer. If longer, then a Fibonacci 13 or 21 weeks may be expected.
Both intermediate waves (A) and (B) look like three wave structures.
Intermediate wave (C) may not move beyond the end of intermediate wave (A).
HOURLY CHART – TRIANGLE
Click chart to enlarge.
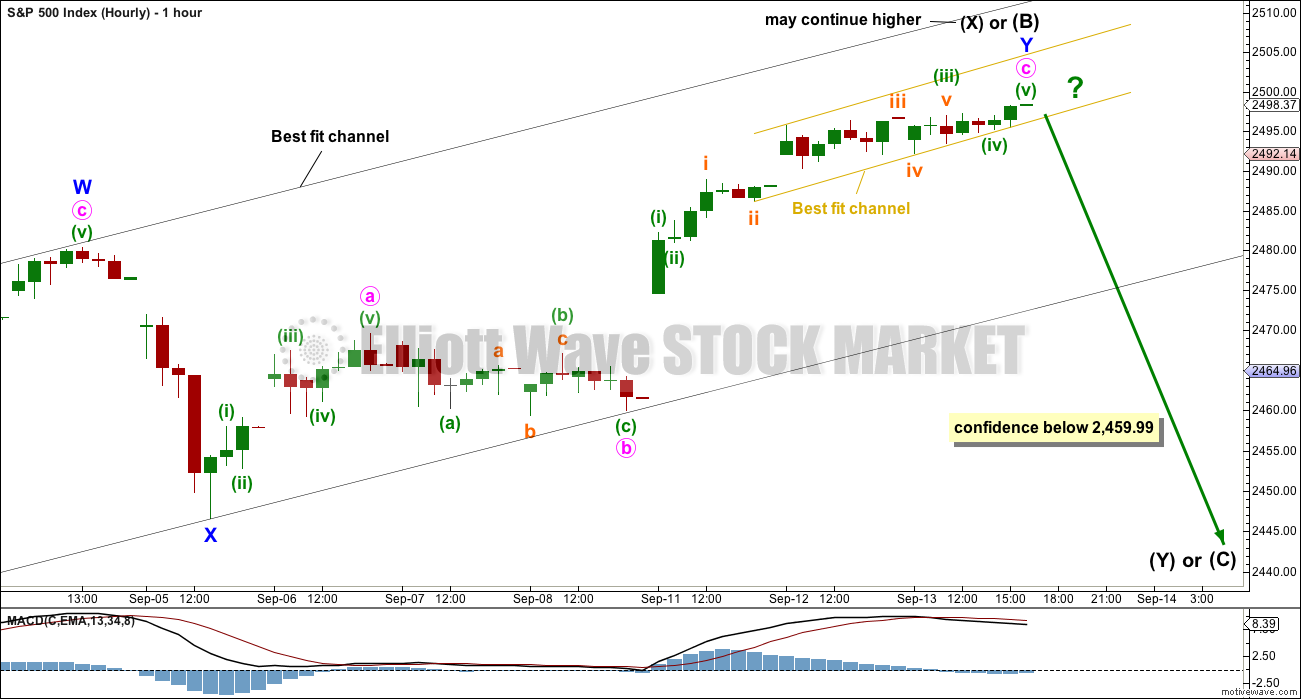
A double zigzag may be complete for intermediate wave (B).
Use the best fit channel. If price breaks below the lower edge, then expect the upwards swing is over and the next swing down has begun. While price remains within this channel, then it is entirely possible price may continue higher again tomorrow; minute wave c may not be complete.
A smaller best fit channel is again drawn about the end of minute wave c. The bottom line is that while price remains within this channel allow for it to continue higher. If this channel is breached by downwards movement, that would be an early indication of a possible trend change.
However, for any reasonable confidence in a trend change the wider black best fit channel still needs to be breached.
It is possible to see minute wave c a complete impulse on the five minute chart.
DAILY CHART – COMBINATION
Click chart to enlarge.
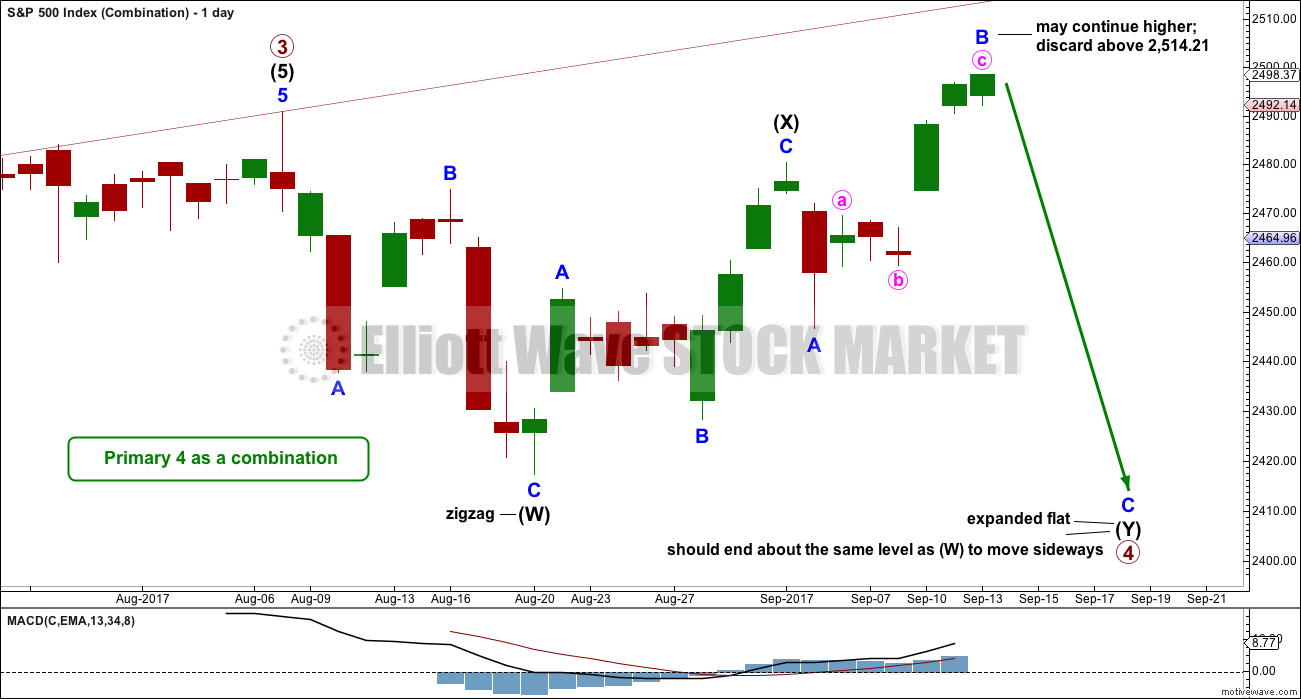
A combination for primary wave 4 would still offer some alternation with the regular flat of primary wave 2. Whenever a triangle is considered, always consider a combination alongside it. Very often what looks like a triangle may be unfolding or may even look complete, only for the correction to morph into a combination.
There may only be one zigzag within W, Y and Z of a combination (otherwise the structure is a double or triple zigzag, which is very different and is now discarded). At this stage, that would be intermediate wave (W), which is complete.
Combinations are big sideways movements. To achieve a sideways look their X waves are usually deep (and often also time consuming) and the Y wave ends close to the same level as wave W.
Here, intermediate wave (X) is very deep.
Intermediate wave (Y) may be a flat correction or a triangle. A flat correction should be expected for intermediate wave (Y).
Intermediate wave (Y) may be unfolding as an expanded flat, the most common variety. So far minor wave B may be a 1.53 length of minor wave A, within the most common range of up to 1.38. If minor wave B reaches twice the length of minor wave A at 2,514.21, then the idea of an expanded flat should be discarded based upon a very low probability.
It is also possible that intermediate wave (X) is continuing higher as a double zigzag, as labelled on the triangle daily chart. While waves W, Y and Z within combinations may only be simple corrections labelled A-B-C (or A-B-C-D-E as in the case of triangles within combinations), the X waves within combinations may be any corrective structure including multiples. However, while this is valid, it is fairly unusual. I am always uncomfortable with labelling X waves as multiples until price proves in hindsight that they were, because of the low probability.
Minor wave C should move below the end of minor wave A. This structure may take another few weeks to complete.
DAILY CHART – ALTERNATE
Click chart to enlarge.
This alternate is new in response to concerns from members that primary wave 3 may not be over.
If primary wave 3 isn’t over, then how would the subdivisions fit? Would it fit with MACD? What would be the invalidation point and would the Fibonacci ratios be adequate?
Of several ideas I have tried, this one has the best fit in terms of subdivisions and meets all Elliott wave rules.
However, this wave count is manufactured and forced. It does not fit with MACD. Because this possible third wave, if it is not over, exhibits long term and persistent weakness this wave count must be judged to have a very low probability. It is published primarily to illustrate why confidence is had in the main wave count. This wave count is not supported by the classic technical analysis given below, both at the weekly and daily chart levels, particularly the bearish signals recently given by On Balance Volume.
A target is provided for members who find that this wave count may fit with their own technical analysis, should they wish to attempt to trade an expected upwards movement.
Within minute wave v, no second wave correction may move beyond the start of its first wave below 2,417.35.
If tomorrow prints another green daily candlestick, then this alternate wave count would be the main wave count. Despite the low probability it is technically possible, and a very strong bullish signal from On Balance Volume would shift probability to being in favour of a more bullish outlook.
Low probability does not mean no probability. Low probability outcomes do occur sometimes, and when they do they are never what was expected as most likely. That is the nature of probability.
TECHNICAL ANALYSIS
WEEKLY CHART
Click chart to enlarge. Chart courtesy of StockCharts.com.
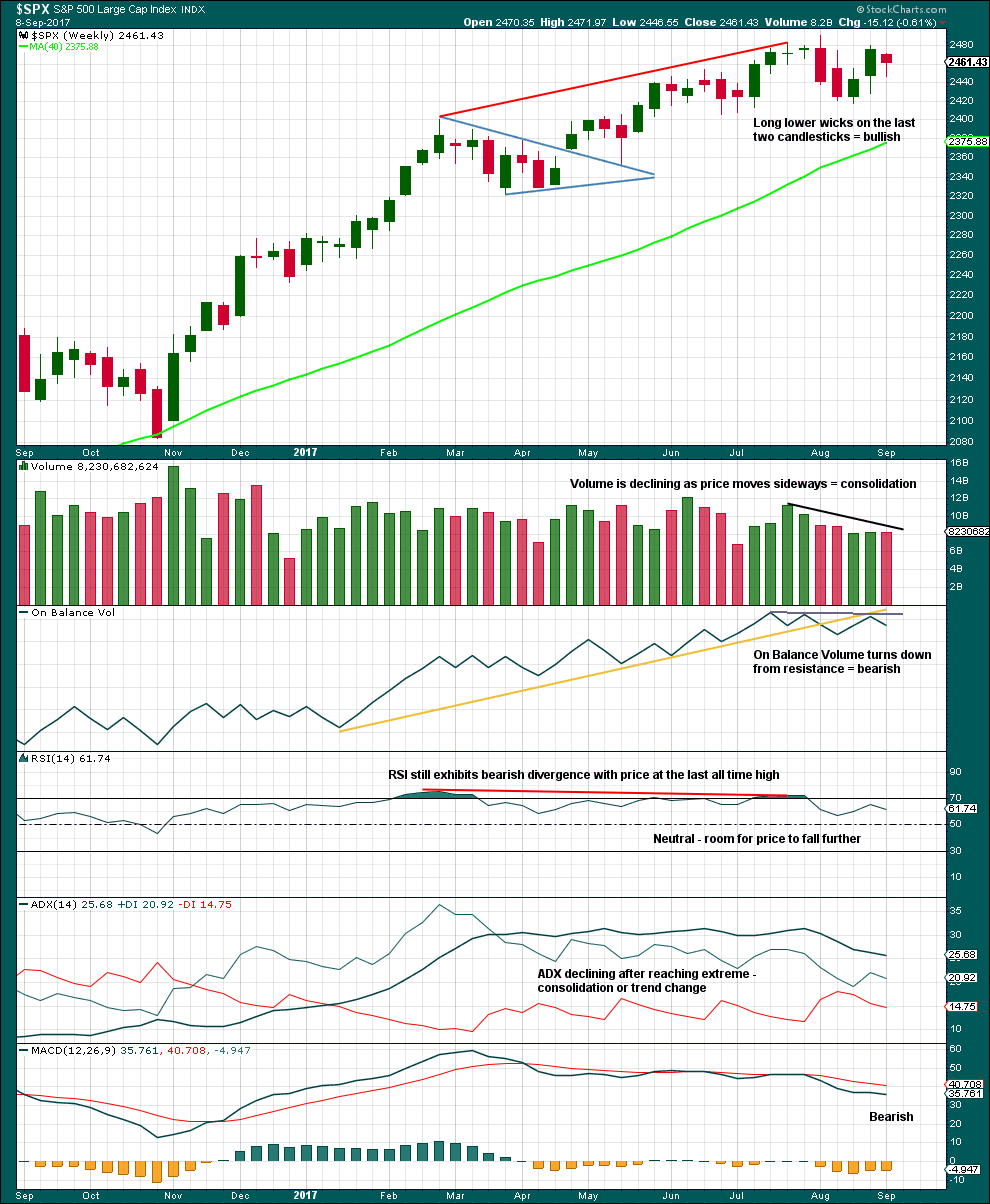
An inside week closes red and the balance of volume was down. Volume shows a slight decline; during the week, the market fell very slightly of its own weight. This will be read as neutral; the slight decline in volume is very small.
Overall, this chart is bearish. Give reasonable weight this week to the bearish signal from On Balance Volume because it supports the Elliott wave counts.
DAILY CHART
Click chart to enlarge. Chart courtesy of StockCharts.com.
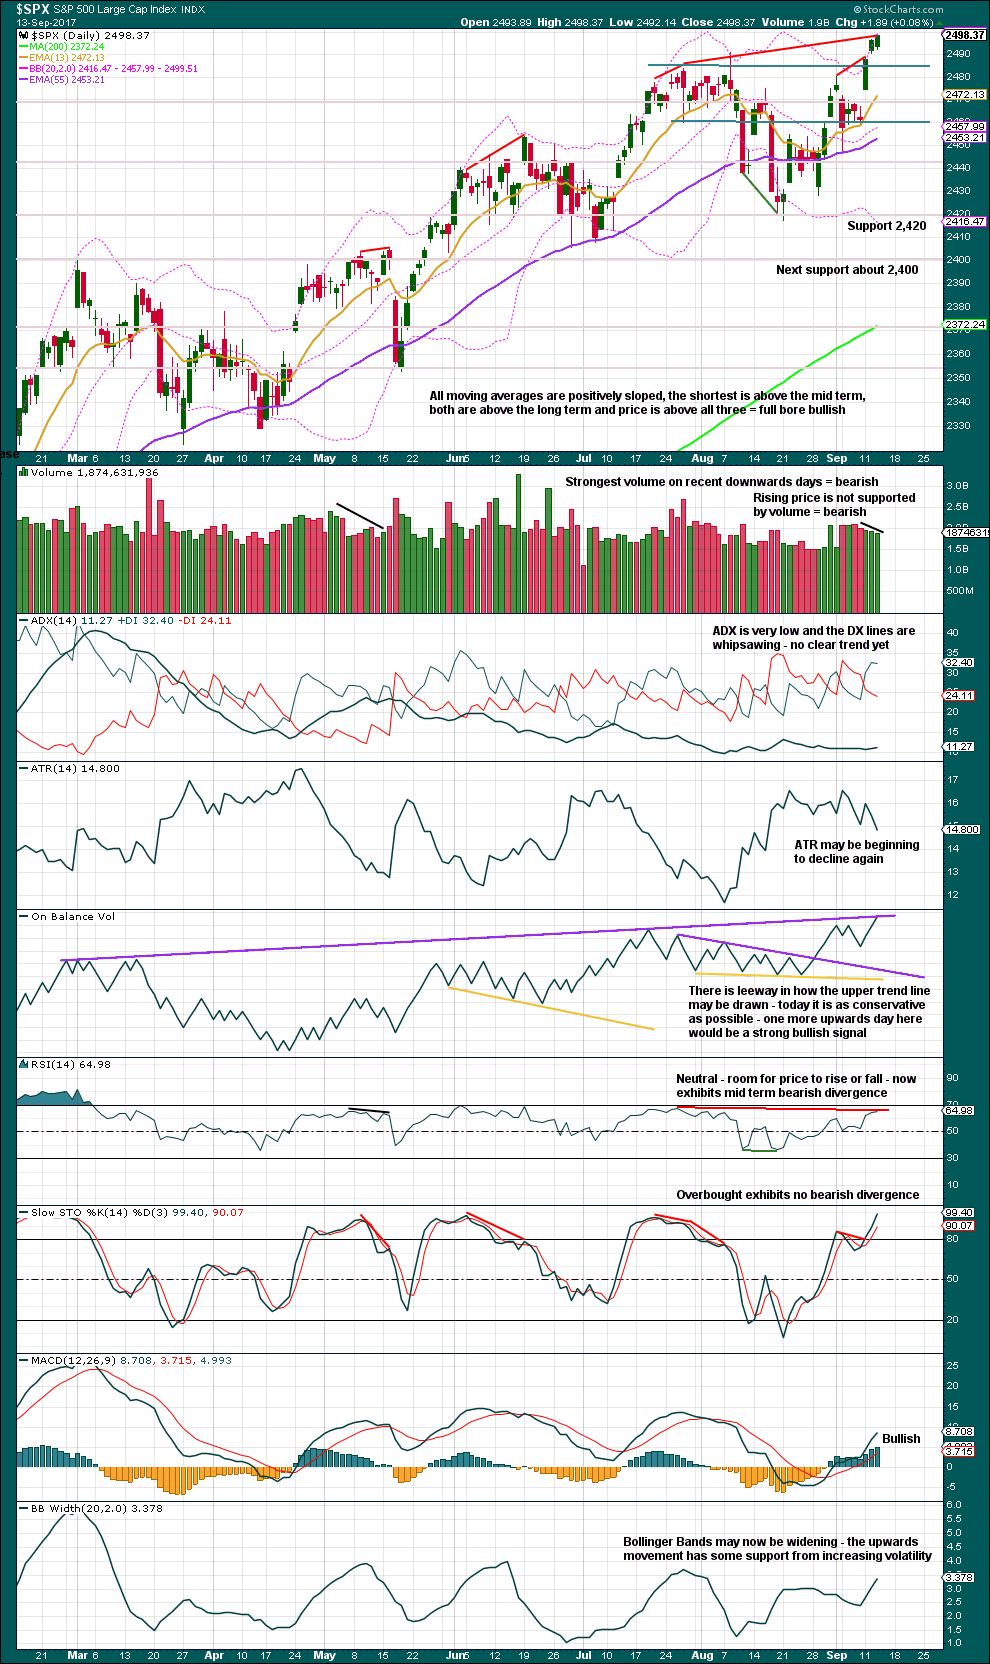
We have an upwards breakout to a new all time high, but it does not have support from volume. Upwards breakouts that are not supported by volume are suspicious. Be suspicious of this one.
However, it is noted that fairly recently on this chart there is evidence of a sustained upwards bull wave that began with weak and declining volume back on the 18th and 19th of May. Those two daily candlesticks also had long upper wicks suggesting bearishness, yet price continued to drift higher before finally turning into a sideways consolidation 10 sessions later. It is possible that may happen again. At this time, this market is exhibiting some highly unusual characteristics, such as the ability to drift higher on light and declining volume. This does make technical analysis and trading so much more difficult.
I will always give weight to trend line signals from On Balance Volume. The upper long resistance line is redrawn very slightly today to sit along the highs of the 27th of February to the 19th of June. With this more conservative drawing, today On Balance Volume looks to be right at resistance now. If resistance holds here, then tomorrow should see a day with the balance of volume downwards (it may still make a new price high first). If that happens, it will be read as a strong bearish signal from On Balance Volume.
But if tomorrow sees upwards movement with the balance of volume upwards, then On Balance Volume would give a very strong bullish signal. That would see the new alternate wave count become preferred. At that stage, expect upwards movement to continue.
While volume is declining as price rises, volume for the last two upwards days is still stronger than a fair number of recent upwards days.
Mid term bearish divergence remains between price and RSI, but has now disappeared between price and Stochastics.
VOLATILITY – INVERTED VIX CHART
Click chart to enlarge. Chart courtesy of StockCharts.com.
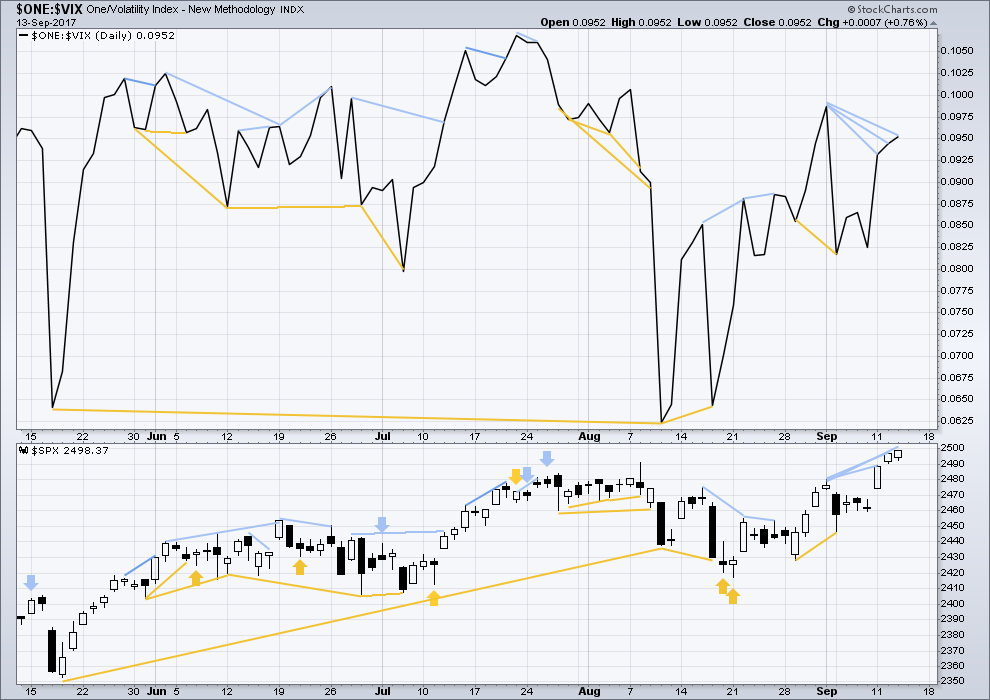
Normally, volatility should decline as price moves higher and increase as price moves lower. This means that normally inverted VIX should move in the same direction as price.
Regular bearish divergence between price and inverted VIX noted over the last two days has not been followed by any downwards movement, so it is considered to have failed.
With the new high today from price, there is still regular bearish divergence between price and inverted VIX. The new high in price does not come with a corresponding normal decline in market volatility, so there is weakness within price.
BREADTH – AD LINE
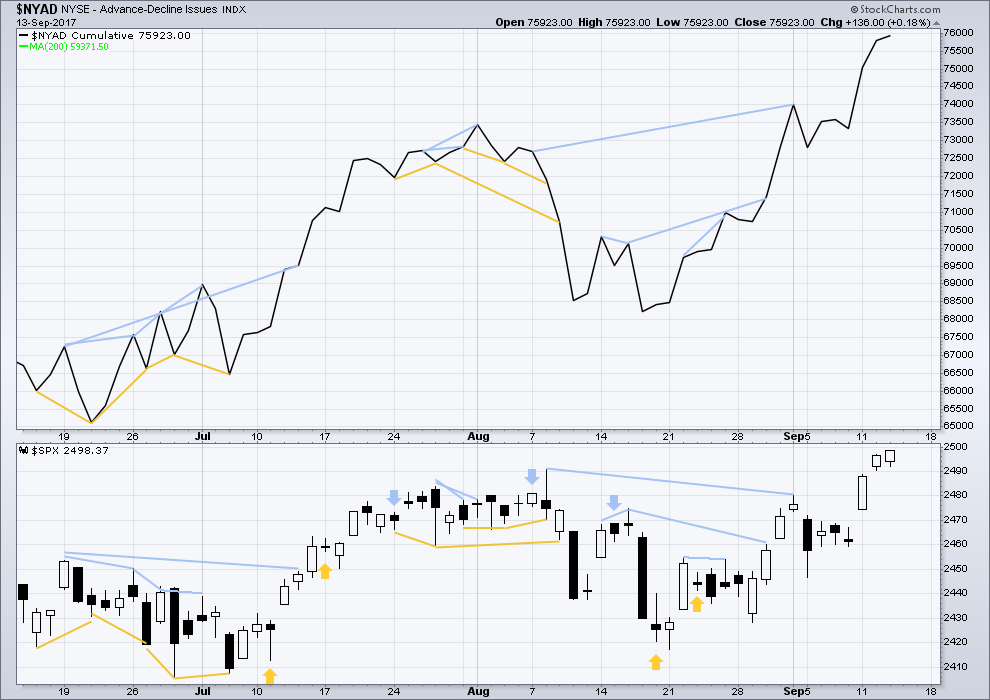
Click chart to enlarge. Chart courtesy of StockCharts.com.
With the last all time high for price, the AD line also made a new all time high. Up to the last high for price there was support from rising market breadth.
There is normally 4-6 months divergence between price and market breadth prior to a full fledged bear market. This has been so for all major bear markets within the last 90 odd years. With no divergence yet at this point, any decline in price should be expected to be a pullback within an ongoing bull market and not necessarily the start of a bear market.
There is no new divergence today between price and the AD line. The new high today for price has support from rising market breadth.
DOW THEORY
The S&P500, DJIA, DJT and Nasdaq have all made new all time highs recently.
Modified Dow Theory (adding in technology as a barometer of our modern economy) sees all indices confirming the ongoing bull market.
The following lows need to be exceeded for Dow Theory to confirm the end of the bull market and a change to a bear market:
DJIA: 17,883.56.
DJT: 7,029.41.
S&P500: 2,083.79.
Nasdaq: 5,034.41.
Charts showing each prior major swing low used for Dow Theory are here.
Published @ 09:26 p.m. EST.
The action in futures does not yet reflect true fear and is more likely some news reading algo. Remember the night of the election the working group managed to reverse a massive hedge fund shorting attack that had futures down over a thousand points. A real fear induced gap is going to send futures down by well over a thousand points. In an irresistible return to the mean, what will happen is that the corrective ebbs and flows stifled over that past 18 months or so will condense in time, possibly even in one session. This is what makes this market so dangerous, and what wild-eyed bulls fail to understand about what the banksters have done and the power of mean reversion. ‘Nuff said!
Count on the banksters to buy the dip. When I mentioned exogenous shocks this morning I had forgotten about the madman Kim. Tim Knight is right in that nothing short of an actual strike will disturb the complacent sleep of the investing public. I think we are seeing a trial run of how things will ultimately unfold. There will be no buying the dip in an outbreak of war…!
Look for new highs tomorrow courtesy of the court jesters, a.k.a central banks….
Sounds like NK just launched another missile. So after we gap down tomorrow morning, SPX is closing above 2500, right?
Could SPX be forming a rounding top….could we expect the move down to accelerate short term?
that would be pretty typical behaviour, and so far that does look like what it’s doing
I keep thinking about that constellation of Hindenburg Omens that everyone seems to have forgotten. That is indeed as round as rounding tops get…
I still think the futures market will be where the end is officially announced.
VXX shot up in the last 5 minutes, while the market shot up and VIX stayed quiet (compare 5 minute charts). So the VIX futures market tipped its hand just a bit, showing their expectations for tomorrow. We’ll see!!
I watched that as well. VXX kind of skyrocketed on the 1 min.
Well that was a less than satisfying close, but it does appear that the balance of volume closed down–whatever that means. It was not a very decisive move, so I suppose we will have to continue this agonizing waiting game.
I like the S&P daily candlestick. Outside day red doji on higher volume than black candlestick yesterday. Trend change?
Bearish harami on S&P/SPY and Russell2000/IWM, bearish candle on NDQ100/QQQ. DJI/DIA was the only strong daily candle today. What does it all mean? That’s why I follow Lara!
It is generally true that fractured markets are weak markets. It certainly does NOT mean we could not see further upward movement tomorrow market weakness notwithstanding; in fact the banksters’ ongoing conduct suggests that they are indeed going to attempt to intimidate any attempt on the part of the bears to take advantage of any such weakness. I do think it also means that we are close to a turn, if not tomorrow, then very likely early next week. Just my two pence!
While technically we have a harami cross today on the S&P… it’s not a very good one. The real body of yesterdays session was just too small, it should be considered “tall” and I don’t think it fits that definition.
Harami aren’t very strong reversal patterns as well.
And doji are just a pause, not on their own a reversal signal, and they do tend to turn up in bull trends yet price just keeps rising.
From the candlestick guru, Nison:
“the harami pattern is a small real body that is contained within what the Japanese call “an unusually long black or white real body” “.
So no harami on the S&P500 today. Nor DJT. Nor Nasdaq.
Yep!
A hangman might be forming on the Daily. If we have a close below would be bearish.
Nope. Just a small doji 🙁
A hanging man would’ve been nice.
Before I read comments and answer any questions, here’s your updated hourly chart:
Looks like minuette (iv) may have continued as an expanded flat, nice alternation with a quicker zigzag for minuette (ii).
There’s nothing yet on the 5 minute chart to indicate a high in place. This wave count certainly extend further.
This looks like a very typical slow moving rounded top that the S&P does. Every time it does, it tests our patience. I think that is its purpose.
With minuette (iv) moving sideways the channel is now redrawn using Elliott’s second technique. I’ve added a lilac line which is the lower edge of yesterday’s small channel, it’s now providing resistance.
Lets see how this candlestick closes. If it’s red or has a long upper wick that would be great. If not… then price may yet limp a little higher.
Well folk, we are not done yet. VIX says we are going higher tomorrow, and since as I mentioned I do not expect an intra-day reversal in the markets I think it will be at least until next week before we bears can celebrate. Cheerio!
In case anyone is interested, I added to my short positions in USO and KBE today as it appears that the counter-trend rallies concluded. Of all the difficult things I had to try and overcome as a trader, learning to take advantage of counter-trend moves to lower position cost basis was the most counter-intuitive. Clearly one can only confidently attempt this with excellent TA support, which thankfully, we have in spades on this site!
Added KBE October 42/44 bearish call spread and USO October 20 10.50 puts for 0.45.
Still holding KSS and AN shorts. 🙂
Figures its 3:15pm and I still have just as many questions where we are with regards to wave count.
While things are a bit murky, the weight of the evidence suggests that we are in some kind of corrective wave.
Nothing has changed (so far, still time to go), so the count is as described in the triangle and combination daily charts and hourly. Looking for a c wave down to start any moment now…but I expect a final head fake up early tomorrow to about 2513 (just below the invalidation point for the combination, I believe, but more significantly the 127% extension of the prior upmove), THEN a rockin’ c wave down. That said, a break below today’s low would be “indication #1” that c down is really initiating. Without that happening, no c yet, and until there is a clear c, no reason to get aggressive on the short side.
Despite obvious ongoing weakness, the absence of sellers in this market is truly remarkable. I think intimidated sellers is the one thing that starkly distinguishes the current bull market from previous ones so far as price ebb and flow is concerned- very little ebbing! 🙂
The banksters face absolutely no opposition in ramping the market higher on very low volume, and this continues to be the case….
yes, very interesting indeed
it looks like price just drifts higher with very little interest at all, drifting up like a deflating helium balloon, drifting higher simply due to lack of resistance
VIX needs to move past 10.50 with strong momentum if there is any chance that we have an interim top and even then it could still reverse. If it does not move above 10.50 today we will most certainly see more upward movement tomorrow.
The VIX is a computation driven by SPX put and call option pricing. Option traders set their price based on the current situation (the amount of volatility recently experienced, with the help of intricate mathmatical models). As the future unfolds (as price changes and volatility of price goes up or down), their option pricing changes, and the VIX value changes. My point being, as I see it, the VIX is an OUTPUT of market action, not a DRIVER of market action. This is a bit in contrast with the futures market for the VIX. In that market, the anticipated future is absolutely discounted (that’s the purpose of a futures market). So changes in those futures prices should generally anticipate market action. Those VIX futures markets are what is used in a blended way to create the pricing of the VIX etf’s: VXX, XIV, UVXY, and others. So changes in those may anticipate market action. But I do not see how or why the VIX itself would ever “lead” market action. My $0.02, and I’m not an expert, and certainly open to learning where I might be wrong about this.
Ergo, what I’ll be watching for in the final minutes of today’s session is a spike in VXX, even if/as market action and the VIX stay quiet. That to me could signal anticipation of sharp downward movement tomorrow, via the VIX futures market.
You are right to a certain extent… VIX is implied volatility on SPX options for a 30-day rolling window. Ergo it tells how much options traders expect SPX to move in that timeframe. VIX futures expire the third Wednesday of every month, so they are priced based on what VIX is expected to be at expiration. UVXY is 30-day rolling VIX futures, so its based on the expected move 30 days out. The next VIX expiration is next Wednesday, so UVXY is weighted more towards October’s contracts.
He! He! I used to believe that.
You are certainly right that they TELL us that the VIX price is merely a reflection of the SPX put/call ratio.
Then I met Bob Kudla, a M&A risk assessment manager and pretty good trader who explained a few things to me about the volatility pairs trade and VAR algos. I wish it were that simple! 🙂
Perhaps we’ve just had a truncated 5th of Primary 5
Now that DJI has printed a new high, I think we can turn at any time. We should get a signal from VIX with a move above 13 before I am confident a short term top is in….
I really really don’t think so.
There is not enough weakness yet to see a trend change at Grand Super Cycle degree.
No divergence with market breadth at all. No weakening of buying power, no expansion of selling pressure.
That technical weakness should begin and then persist for absolute minimum 4 months, and more likely 1-2 years.
I don’t think this bull market is ready to end now, maybe October 2018?
Yep. I suspect we could get a hair-on-fire fourth wave correction that ignites just enough fear to dispel the extreme level of bullishness prior to the last wave up. If this fourth wave correction is shallow though, I just don’t see where the momentum is going to arise to keep this bull run alive beyond a few months at the most…..
Another fascinating thing I have noticed about market price action the past few years is how buying action seems designed to negate idioms regarding price expectation. For example, you remember the old saying about “Sell in May and Go Away”?
It was absolutely fascinating to watch during that period the incredible cash dumps that would come into the market as short sellers, probably in anticipation of the usual decline, tried to get positioned. It is also well known that September is considered to be the most bearish month of the year. Again the cash dumps into the market the past few weeks have been pretty relentless. I know there are strong opinion on both sides of the argument about the influence of central bankers et al but all I do is look at what price is doing and it seems to be completely impossible not to see it actually happening. They continue to be successful in this kind of behavior because sentiment at large remains optimistic and that is a huge factor that simply cannot be ignored. Tim Knight jokingly said that even if a Nuke went off people would still be bullish, a truly scary prospect as it serves to underscore how profoundly sentiment has become divorced from reality. While we simply do not know when this farce is going to end, we do know how; the important thing is to be ready when it does….
what you’re describing sounds really toppy to me (yes spellcheck, it’s a word!)
at an historic market peak sentiment and social mood should be very extreme indeed, over optimistic and completely divorced from any reality
the new iPhone for USD1,000 is so ridiculous, another wee indicator of extremes in the global market
If I am reading my chart correctly, so far the balance of volume has been downward. Therefore despite the ferocious morning buyback, the resistance is holding… for now. I note that DJI recently broke a fairly significant OBV trendline and is still trending upward at the moment. It is hanging around the upper bollinger band on the daily chart just like it did in early February and early July. Both those scenarios ended with lows below the breakout point, but they lasted much longer than anyone would have expected. DJI stochastics are not even in overbought territory. The strongest component today is Pfizer, which has been one of the weakest components during this entire bull market. Meanwhile, NDX looks like the weakest index of all, despite being the strongest player by far during the April and May run-up.
At this point I still think it can go either way. My inclination is toward more upward movement due to the lack of downward catalysts.
Great points. All you have to do is look at the chart of Equifax to understand how quickly and dramatically things can change. I am reminded of Mark Twain’s retort to the question of how he went bankrupt – “First it happened slowly, and then all at once!”
I can easily understand how the herd is convinced that his market will continue to do what is has always done- go up..!!
BTW The price action you describe aptly depicts a fight against the trend…
If my memory serves me correctly, wasn’t it Hemingway who said that?
Feels like we are turning this supertanker around to the downside. Will use highs of today as final attempt to get some juice on downside action.
I noticed something in the futures market that I have been anticipating for some time as a signal the market is going to move down strongly. Price declined sharply just before the open and was very aggressively bought. This has been the pattern for quite some time and on-going evidence that the banksters are absolutely determined to attempt and arrest every decline. I do not think we are going to see a turn around of the markets during the regular session. I think the death knell will be sounded after hours in the futures market due to some sort of exogenous shock. What I continue to look for is the banksters fail in their attempt to arrest a violent futures decline and a massive gap open down. Nothing about what is currently obvious about the nature of this market has been able to dampen the remarkably bullish sentiment that still prevails. It is going to take actual price action in the market before the herd slowly awakes to the reality not yet obvious to them, or which they have chosen to blithely ignore.
I urge caution re: shorts. From a short term purely technical analysis perspective, price is just consolidating here in the midst of a very strong bull run, and most likely to continue that bull run (remember Lara’s constant advice: “we must always assume a trend will continue…”). The trend is pretty strongly up right now.
I agree. What we are seeing is consolidation in the context of an upward trend. We have seen this often enough to know that that is the outcome of this kind of price action. The only difference is I am starting to think this is a final wave up….
Also keeping an eye on VIX for a persistent day session divergence with market price….
I will add that I succumbed to a combination of impatience and lack of discipline this morning (my habitual fail, working HARD on fixing it!!) when I took a very small short on SPX pretty close to the low of the day. “It’s going to really fall now!!!”. Silly. For me, creating well defined triggers (“confirmation” prices or otherwise) helps me avoid this emotionally driven (layered on top of perceptual bias) trading. If I’d done that, no way was the action this morning firing a trigger! Sigh. I commit every day to getting more disciplined!!
Not easy in this environment that is for certain. Credit spreads work great for dealing with the whipsaw….I am currently holding both bullish and bearish spreads so I don’t really care which way price ramps. I moved expiration dates out to October so as not to have to react to daily market gyrations…
I have often told myself, I should make a rule not to take any trade, buy or sell, early in the morning. For me that means at least 2 cups of coffee, breakfast and to my office. BUT, I haven’t made the rule yet. So in the meantime, I find myself often regretting early morning decisions. Will ever learn?
That’s rather fascinating, as I tend to have the most reliable trades fairly early in the session. My experience is later action is less reliable, less follow through, etc. I’ve often thought of a “done after 2 hours” rule, but also haven’t put it in place. Why probably requires a psychotherapist, lol!!! (I’ll only accept one who know elliott wave though!)
I hear ya man. Sitting on hands is the toughest discipline to master. I have been chomping at the bit to jump into a few today but am determined to at least wait to see how we close…I think SVXY is ripe and juicy for at least a 5 bagger but waiting for a green light from VIX. If we get a turn this week the 79 puts expiring next week are going to trade for at least 5.00 on the next wave down.
It is very possible that we could see a final spurt higher in all the indices prior to a turn. I am watching NDX 100 closely as I have maximun target of around 6100 if it is indeed in an ending diagonal as I suspect…
Andy Pancholi just sent out another general market alert. A histogram he uses to signal market trend changes has spiked to the highest level he has ever seen in his 30 years of market analysis. Not sure what to make of it as so many formerly reliable market metrics have become broken beyond usefulness. I do agree it is a time for caution.
I’m not sure whether this is a bullish or bearish market alert?
He was deliberately vague as the alert was also a soft ad for his market timing report. However, the chart he showed in discussing a histogram that signaled a possible historic trend change was of one in which price has gone straight up so I think we can read between the lines…
There must be a hundred indicators that say it’s time for the stock market to pull back. Sadly, Andy has zero clue when it will start…but now he’s positioned to crow about his amazing call, at some date in the future, be it a month or a year. Compare and contrast to what we are provided here. Objective, transparent, rigorous, with timing information, and defined levels of confirmation and invalidation. It’s night and day (with all due respect to A.P., I am inferring a lot from such an “update”).
I am prepared to cut him some slack as he cited a specific histogram that he has reliably used in the past. I know of other analysts who also use histograms of overbought conditions tailored specifically to signal possible important market turns so he is not the only one noting these kinds of extremes in the market. My caveat is that, as I have stated before, we have no assurance that metrics that previously worked are still able to provide predictive value in a market that has been subjected to unprecedented central bank intervention.
Kevin,
I agree with you whole heartedly when you write, “Compare and contrast to what we are provided here. ” This site is really valuable to me. Lara is without peer, imho. On top of that we have so many valuable contributions from the membership. A great site indeed!
*blushing* thanks guys! a nice boost to hear my work is so valued, makes me want to work harder for you all
re the comment that lots of market metrics aren’t working so well at this time…
I keep looking at volume. light and declining volume.. yet price keeps rising. all the technical analysis books I have read say that when that happens it is suspicious, that a bull trend can’t be sustained without support from volume.
and yet this bull trend HAS been sustained for years. look at volume on the monthly charts… it’s quite amazing
now, that does make figuring out what’s most likely to happen next extremely tricky, as if it weren’t hard enough already
We finally have a new ATH in DJI, but the price action is looking very much like the recent stretch into the August 8 high with price pinned to the upper B band in a slow and torturous grind higher. This obviously calls for patience to allow the wave structure to go to completion and until then, noting much to see I am afraid…..
of course up we go again – who was I to think that we could sustain any meaningful downward movement!
The banksters are all in, they have no choice. We may actually be looking at a last hurrah. I think the longer we go without a meaningful correction, and we have not had one all year, the greater the likelihood that we do not get a correction but a collapse.
i agree Verne, just very unsure of what prompts them not to buy or over powers them. The DJIA looks like a w3 Peak in March in w5 now, imho. Transports in wave 2 up; once both roll it should be on, but I’m now used to seeing bearish set-ups go the other way.
Today isn’t over! Meanwhile, I’ve taken some XLU, which has been in a roaring uptrend for weeks and weeks, and pulled back nicely the last few days.
DJI needs to make a new high before a synchronous turn. An important fib re-tracement number (161.8 projection from 1982 low and 2007 high) lies at 22496.00
I think we end this week bullish and see a turn next week.
This is one chart (SPX hourly) I am working with. As usual, I am probably violating some EW rules. But it is just my musing. I intend to liquidate my long positions at the next high, v of iii, somewhere north of 2500. Then I am off to the mountains!
The knife is on the edge of P4’s throat!!! To P4…or to not P4!!! . I have sympathies with both alternatives, for better and for worse. This will be very interesting, I think I’m going to make myself popcorn with my coffee in the morning!
🙂 I’ll be very excited to see the outcome tomorrow too.
Hoping my stomach doesn’t fall too hard when I open the charts.
This show is keeping me on the edge of my seat! The P4 character just refuses to die…yet!! Just like a horror movie where you are certain it’s curtains…and then a brief escape! I need more popcorn…
I don’t think today is decision day. Probably tomorrow with quad witching and all that fun.
Lara. you mention probabilities on the various possible outcomes. Are these probabilities actual or learned? Are they from your experience? What I’m getting at is I would like to see the probabilities if they are known. If there is a 60 percent chance of a triangle vs 40 percent for an upwards breakout that information would be useful in setting up trades. Thanks.
I’m basing it on experience.
The difference is in whether or not P3 is over and P4 is underway. So it cannot be broken down into which corrective structure is more likely than another, because that is not the difference in the two wave counts.
And so it has to rely on the overall right look, Fibonacci ratios, how it fits into a channel. And classic technical analysis.
I am still so far relying heavily on the bearish signals given most recently from On Balance Volume at the weekly and daily chart levels.
So it’s an overall balance of judgement.
Sorry, I don’t see how it could be more accurately measured and distilled down to a number.
You also use Lowry’s which has helped us immensely during this bull market.
Yeah, that’s true.
for the first time this year Lowry’s end of week analysis last week wasn’t so helpful
they outlined how their analysis works, but didn’t relate it to current market conditions
Different Ronald, same FIRST!! Another excellent analysis, Lara. Thanks!
Most welcome RonU 🙂