
A quick spike up was expected to begin the week, but it was expected to move just above 2,469.64 before turning. Price has moved comfortably higher, reaching so far to 2,488.95.
Summary: In the short term, it is entirely possible that price may move higher tomorrow. There is weakness, but as yet no evidence that upwards movement is over. The lack of a candlestick reversal pattern or a long upper wick, along with only slightly lighter volume and support today from rising market breadth, indicates price may yet move a little higher.
This upwards swing is still expected to end here or very soon; strong resistance about 2,485 and 2,490 may force a turn. The next swing downwards may find support about 2,420.
In the short term, a new low below 2,459.99 would add confidence to the view that the upwards swing is indeed over and the next swing downwards has begun.
Last monthly and weekly charts are here. Last historic analysis video is here.
ELLIOTT WAVE COUNT
WEEKLY CHART
Click chart to enlarge.
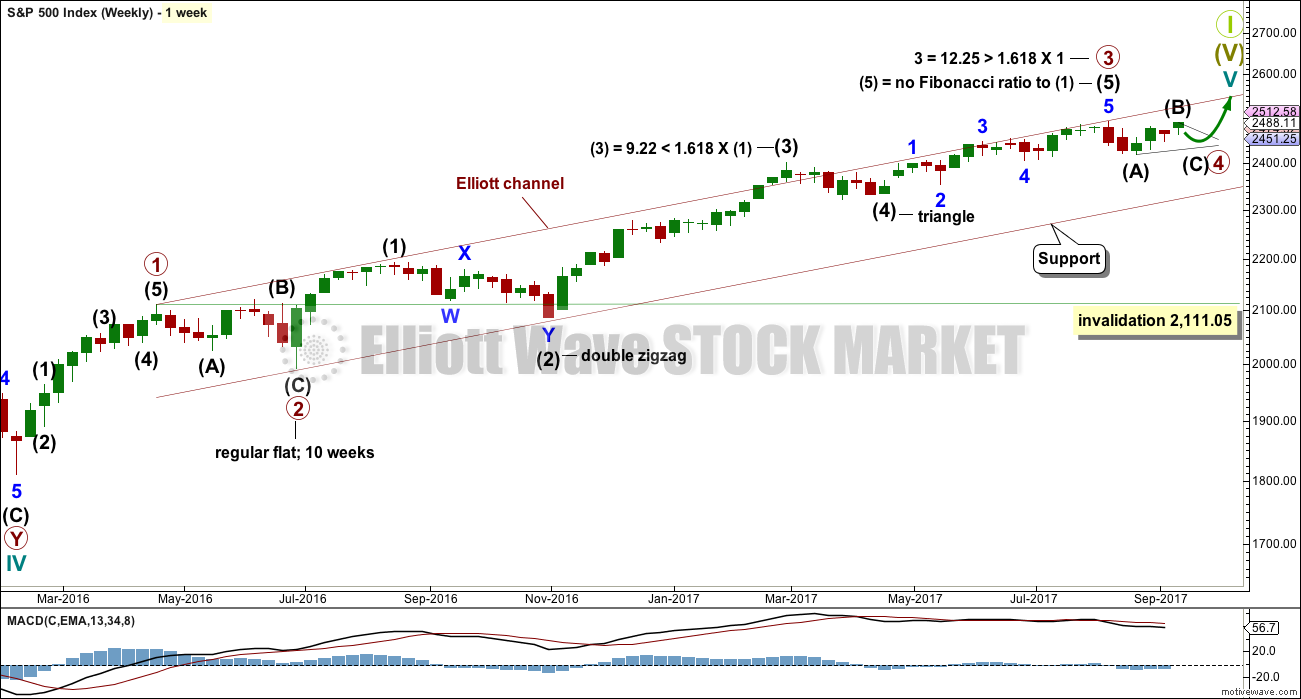
Primary wave 3 now looks complete. Further and substantial confidence may be had if price makes a new low below 2,417.35 now. That would invalidate a new alternate published below.Fibonacci ratios are calculated at primary and intermediate degree. If primary wave 3 is complete, then it still exhibits the most common Fibonacci ratio to primary wave 1.
Primary wave 4 may not move into primary wave 1 price territory below 2,111.05.
Primary wave 4 should last about 8 weeks minimum for it to have reasonable proportion with primary wave 2. It is the proportion between corrective waves which give a wave count the right look. Primary wave 4 may last 13 or even 21 weeks if it is a triangle or combination. So far it may have completed its fourth week.
If primary wave 4 unfolds as a single or double zigzag, then it may find support about the lower edge of the maroon Elliott channel. If it is a triangle or combination, it may be more shallow, ending about mid way within the channel.
At this stage, the analysis gets complicated because there are several possible structures that primary wave 4 may be. The ideas for a triangle, combination, double zigzag, and single zigzag will be separated out into different daily charts in order for members to have a clearer picture of how price may behave for each. It is still impossible for me to tell you with any level of confidence which structure primary wave 4 may take, so all possibilities must be considered. I can only say that a single or double zigzag, or a triangle, would be most likely to exhibit good alternation with the flat correction of primary wave 2.
The daily charts are presented below in order of probability based upon my judgement.
The final target for Grand Super Cycle wave I to end is at 2,500 where cycle wave V would reach equality in length with cycle wave I. If price reaches the target at 2,500 and either the structure is incomplete or price keeps rising, then the next target would be the next Fibonacci ratio in the sequence between cycle waves I and V. At 2,926 cycle wave V would reach 1.618 the length of cycle wave I.
DAILY CHART – DETAIL
Click chart to enlarge.
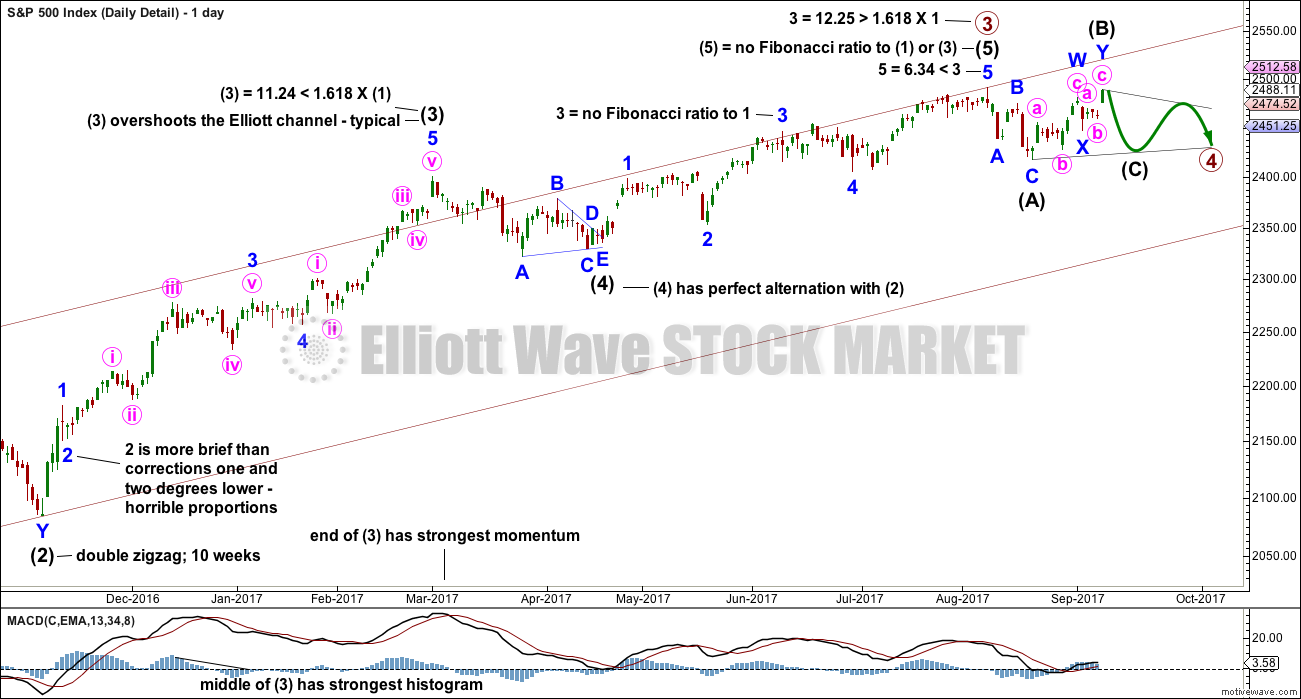
In order for members to compare and contrast this main wave count with the new alternate published below, it is necessary to publish a chart showing all movement from the low labelled intermediate wave (2), which is shown on the weekly chart. I would not want to try and see any alternate which does not have primary waves 1 and 2, and intermediate waves (1) and (2), in any other position than that labelled on the weekly chart. Any variation should be taken from that point.
This wave count fits with MACD. The end of a third wave is very often the strongest portion of MACD, and the middle of the third wave is very often the strongest portion of the histogram on MACD. In this way MACD can be used to assist in labelling an impulse.
It is very common for the S&P to exhibit Fibonacci ratios between only two of its three actionary waves within an impulse . Rarely will it exhibit Fibonacci ratios between all three actionary waves. The lack of a Fibonacci ratio for intermediate wave (5) and for minor wave 3 within it is entirely acceptable.
This wave count also fits neatly with the Elliott channel. It is extremely common for the end of a third wave within an impulse to overshoot the Elliott channel, because it is usually the strongest portion of movement.
This wave count has a neat fit in terms of subdivisions and fits with most common behaviour for this market. For this reason I have confidence in it.
The only problem here is one of proportion for minor wave 2 within intermediate wave (3). But then the S&P does not always exhibit nice proportion between its corrective waves.
DAILY CHART – TRIANGLE
Click chart to enlarge.
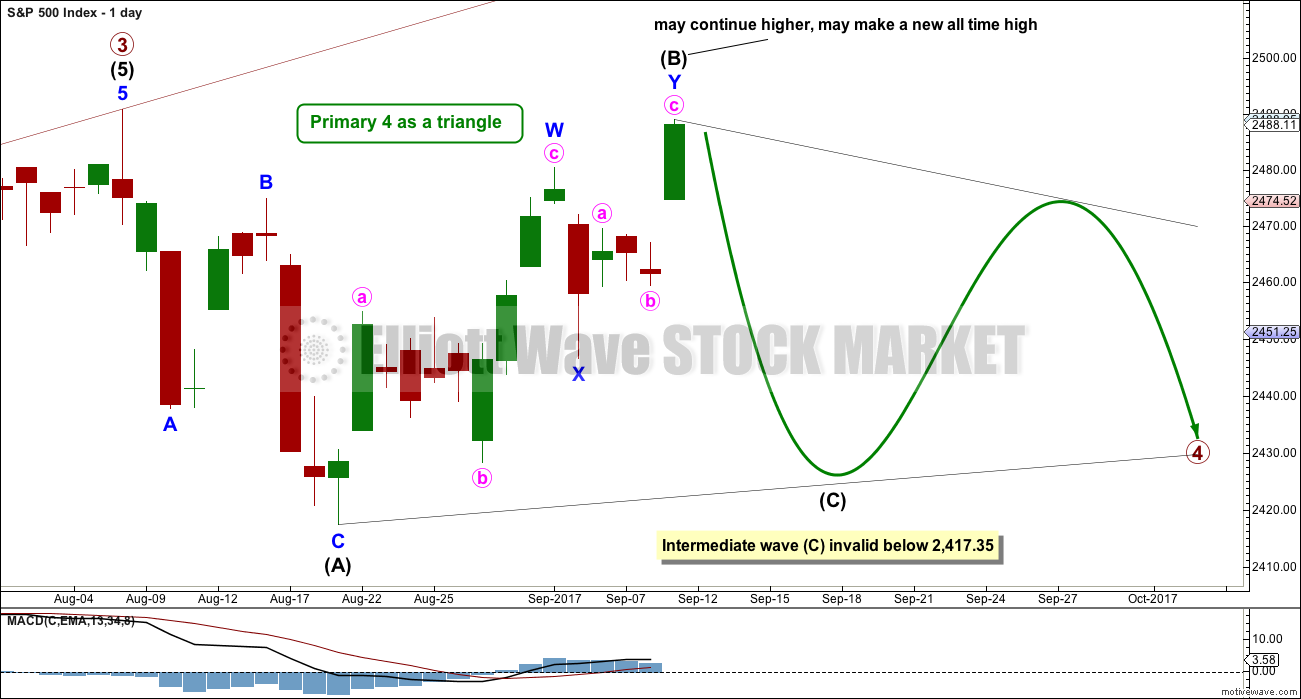
This first daily chart will illustrate how price might move if primary wave 4 unfolds as a triangle.
Intermediate wave (B) may be continuing higher as a double zigzag. One of the five sub-waves of a triangle should be a more complicated multiple; most commonly that is wave C, but it may be any sub-wave. If intermediate wave (B) continues higher, it may make a new all time high as in a running triangle.
The triangle may still last a total of at least eight weeks, and possibly longer. If longer, then a Fibonacci 13 or 21 weeks may be expected.
Both intermediate waves (A) and (B) look like three wave structures.
Intermediate wave (C) may not move beyond the end of intermediate wave (A).
DAILY CHART – COMBINATION
Click chart to enlarge.
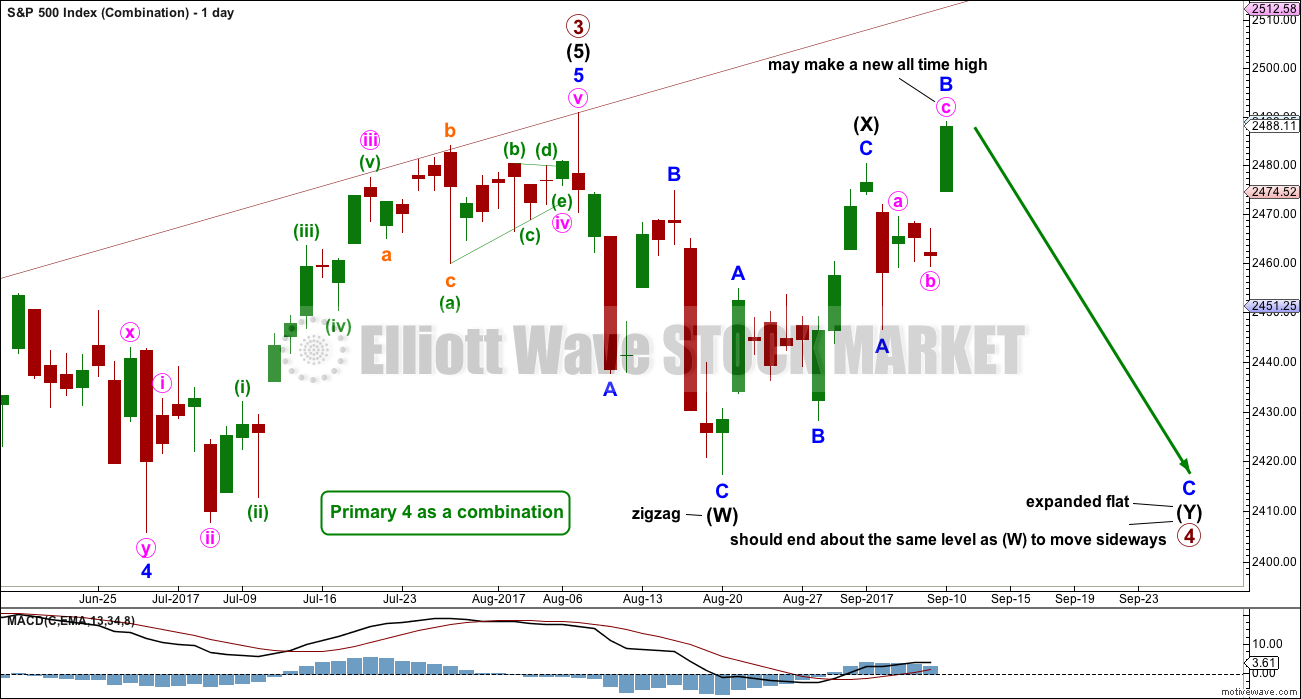
A combination for primary wave 4 would still offer some alternation with the regular flat of primary wave 2. Whenever a triangle is considered, always consider a combination alongside it. Very often what looks like a triangle may be unfolding or may even look complete, only for the correction to morph into a combination.
There may only be one zigzag within W, Y and Z of a combination (otherwise the structure is a double or triple zigzag, which is very different and is considered below). At this stage, that would be intermediate wave (W), which is complete.
Combinations are big sideways movements. To achieve a sideways look their X waves are usually deep (and often also time consuming) and the Y wave ends close to the same level as wave W.
Here, intermediate wave (X) is very deep.
Intermediate wave (Y) may be a flat correction or a triangle. A flat correction should be expected for intermediate wave (Y).
Intermediate wave (Y) may be unfolding as an expanded flat, the most common variety. So far minor wave B may be a 1.25 length of minor wave A, within the most common range of up to 1.38. If minor wave B reaches twice the length of minor wave A at 2,514.21, then the idea of an expanded flat should be discarded based upon a very low probability.
It is also possible that intermediate wave (X) is continuing higher as a double zigzag, as labelled on the triangle daily chart. While waves W, Y and Z within combinations may only be simple corrections labelled A-B-C (or A-B-C-D-E as in the case of triangles within combinations), the X waves within combinations may be any corrective structure including multiples. However, while this is valid, it is fairly unusual. I am always uncomfortable with labelling X waves as multiples until price proves in hindsight that they were, because of the low probability.
Minor wave C should move below the end of minor wave A. This structure may take another few weeks to complete.
DAILY CHART – DOUBLE ZIGZAG
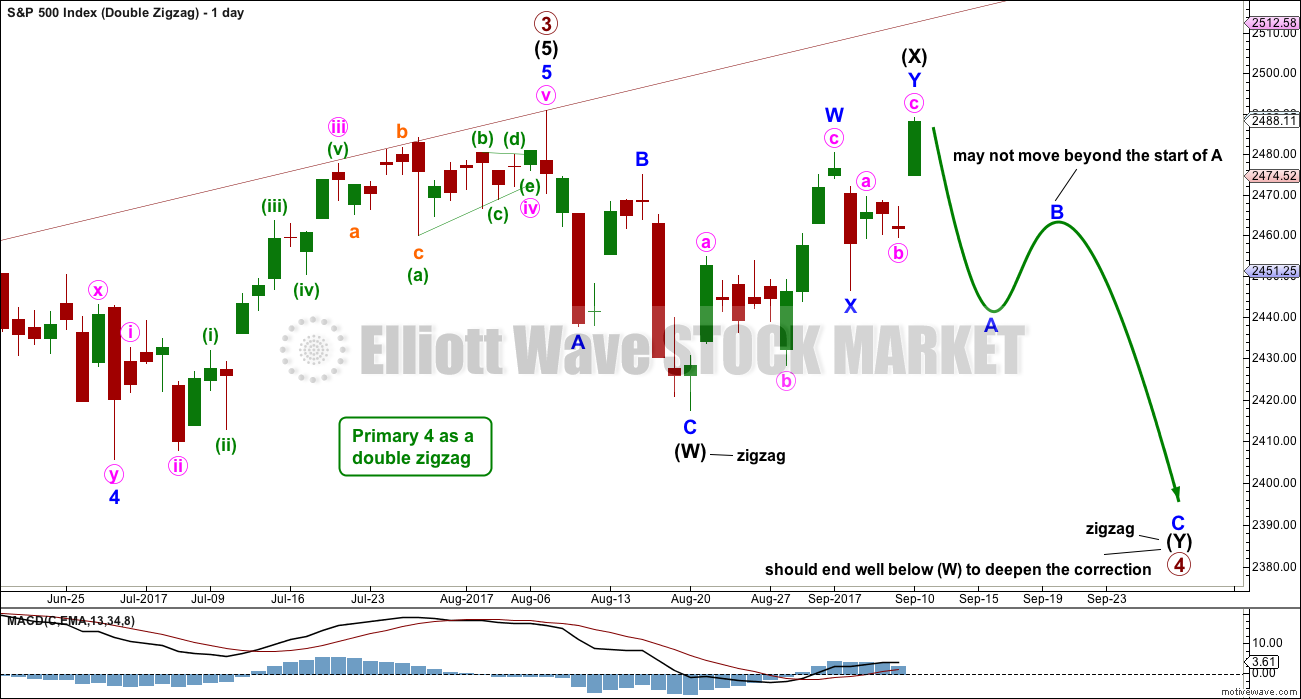
Click chart to enlarge.
While combinations and double zigzags are both labelled W-X-Y, they are very different structures.
Double zigzags (and very rare triples) belong to the zigzag family of corrections. Combinations are more closely related to flats (these are sideways movements). Double zigzags have a strong slope, as do single zigzags. The second zigzag exists when the first zigzag does not move price deep enough; its purpose is to deepen the correction.
To achieve a strong slope the X waves of double zigzags (and the very rare triple zigzags) are almost always brief and shallow. Here, intermediate wave (X) is neither brief nor shallow reducing the probability of this wave count.
With intermediate wave (X) today moving much higher and now subdividing as a multiple, the probability of this wave count is now extremely low. It is my judgement that today will probably be the last day this should be published.
Within the second zigzag, minor wave B may not move beyond the start of minor wave A.
It would still be possible for this wave count for primary wave 4 to end about the lower edge of the maroon channel on the weekly chart.
A channel is added about intermediate waves (W) and (X). For all three ideas at the daily chart level, if my labelling is correct, then any upwards movement at this stage should find very strong resistance at the upper edge of this channel. This channel is copied over to the hourly chart below.
The alternate that was published up until yesterday, which looked at a leading diagonal unfolding, will no longer be published today based upon a very low probability. While it remains technically valid, the second wave correction would now be much deeper than normal and would now subdivide as a double and not a single zigzag. Second and fourth waves within diagonals are almost always single zigzags; although double zigzags may take the place of single zigzags and the rules still be met, it is highly unusual.
HOURLY CHART
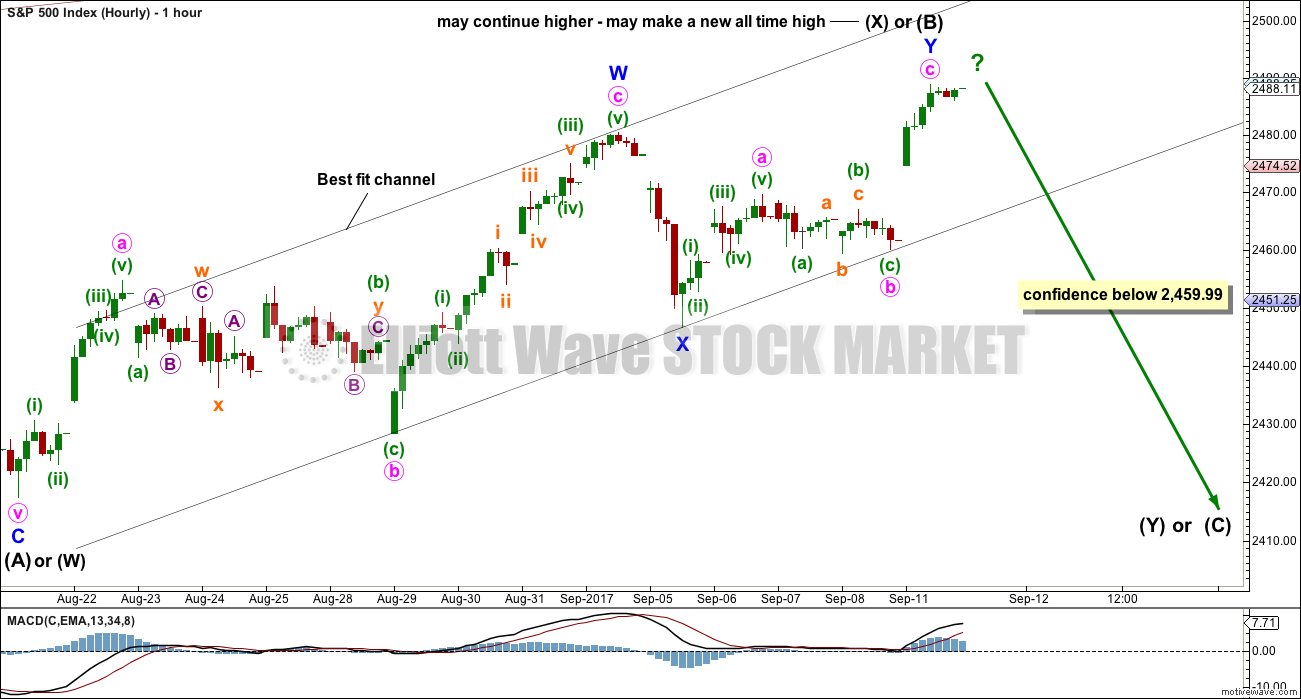
Click chart to enlarge.
A double zigzag may be complete for intermediate wave (B) or intermediate wave (X).
Use the best fit channel. If price breaks below the lower edge, then expect the upwards swing is over and the next swing down has begun. While price remains within this channel, then it is entirely possible price may continue higher tomorrow; minute wave c may not be complete.
DAILY CHART – ALTERNATE
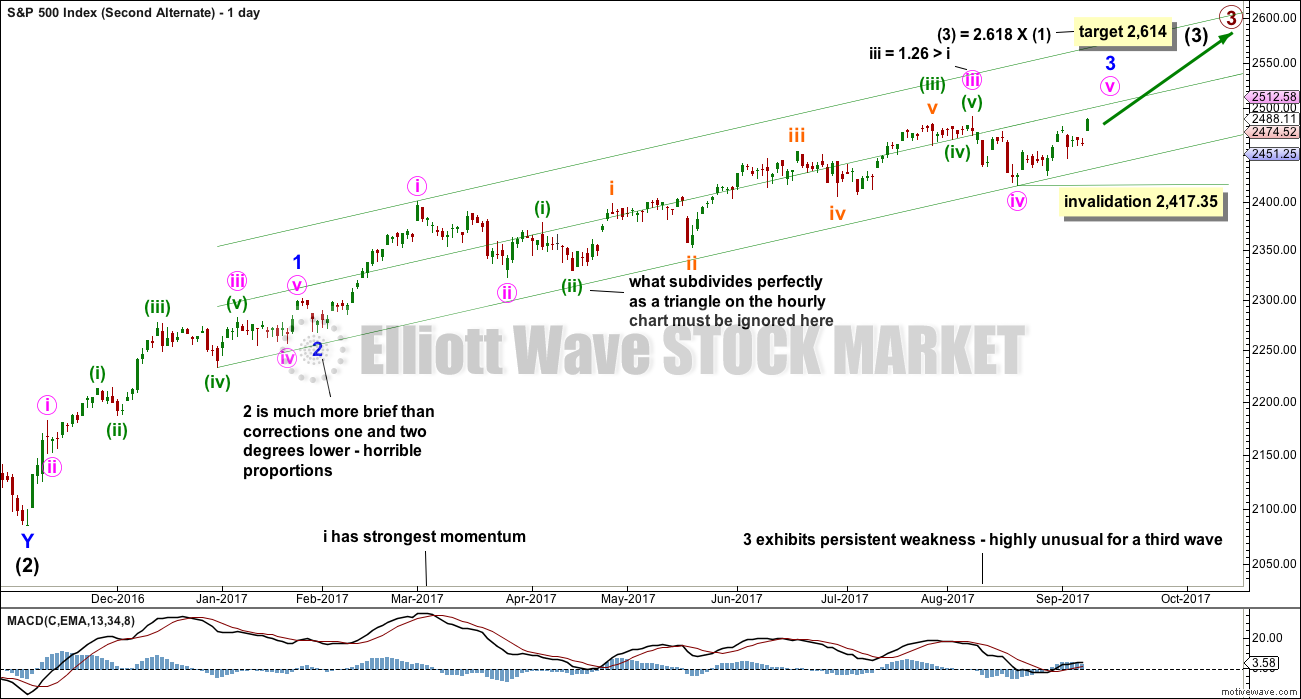
Click chart to enlarge.
This alternate is new in response to concerns from members that primary wave 3 may not be over.
If primary wave 3 isn’t over, then how would the subdivisions fit? Would it fit with MACD? What would be the invalidation point and would the Fibonacci ratios be adequate?
Of several ideas I have tried today, this one has the best fit in terms of subdivisions and meets all Elliott wave rules.
However, this wave count is manufactured and forced. It does not fit with MACD. Because this possible third wave, if it is not over, exhibits long term and persistent weakness this wave count must be judged to have a very low probability. It is published primarily to illustrate why confidence is had in the main wave count. This wave count is not supported by the classic technical analysis given below, both at the weekly and daily chart levels, particularly the bearish signals recently given by On Balance Volume.
A target is provided for members who find that this wave count may fit with their own technical analysis, should they wish to attempt to trade an expected upwards movement.
Within minute wave v, no second wave correction may move beyond the start of its first wave below 2,417.35.
TECHNICAL ANALYSIS
WEEKLY CHART
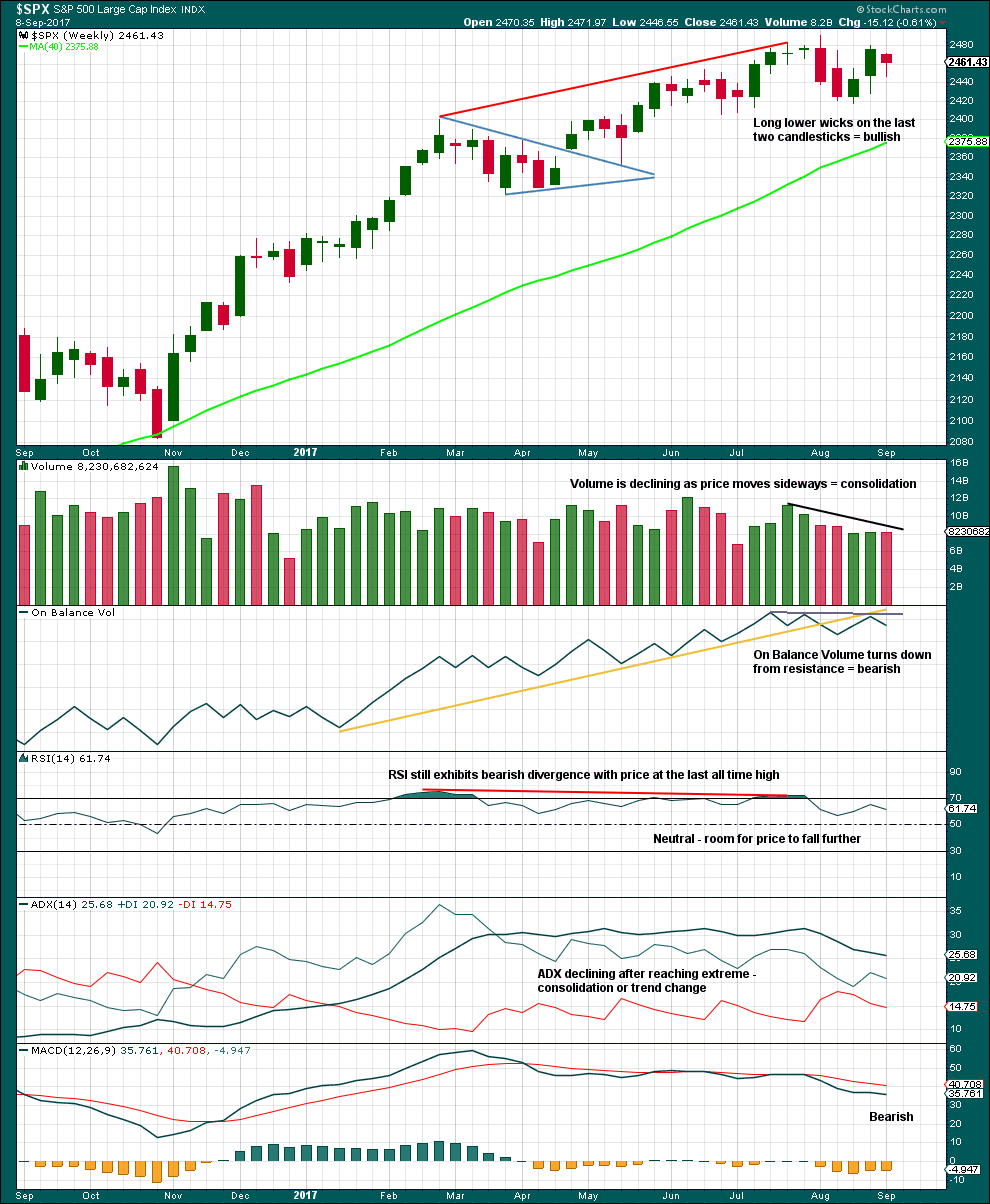
Click chart to enlarge. Chart courtesy of StockCharts.com.
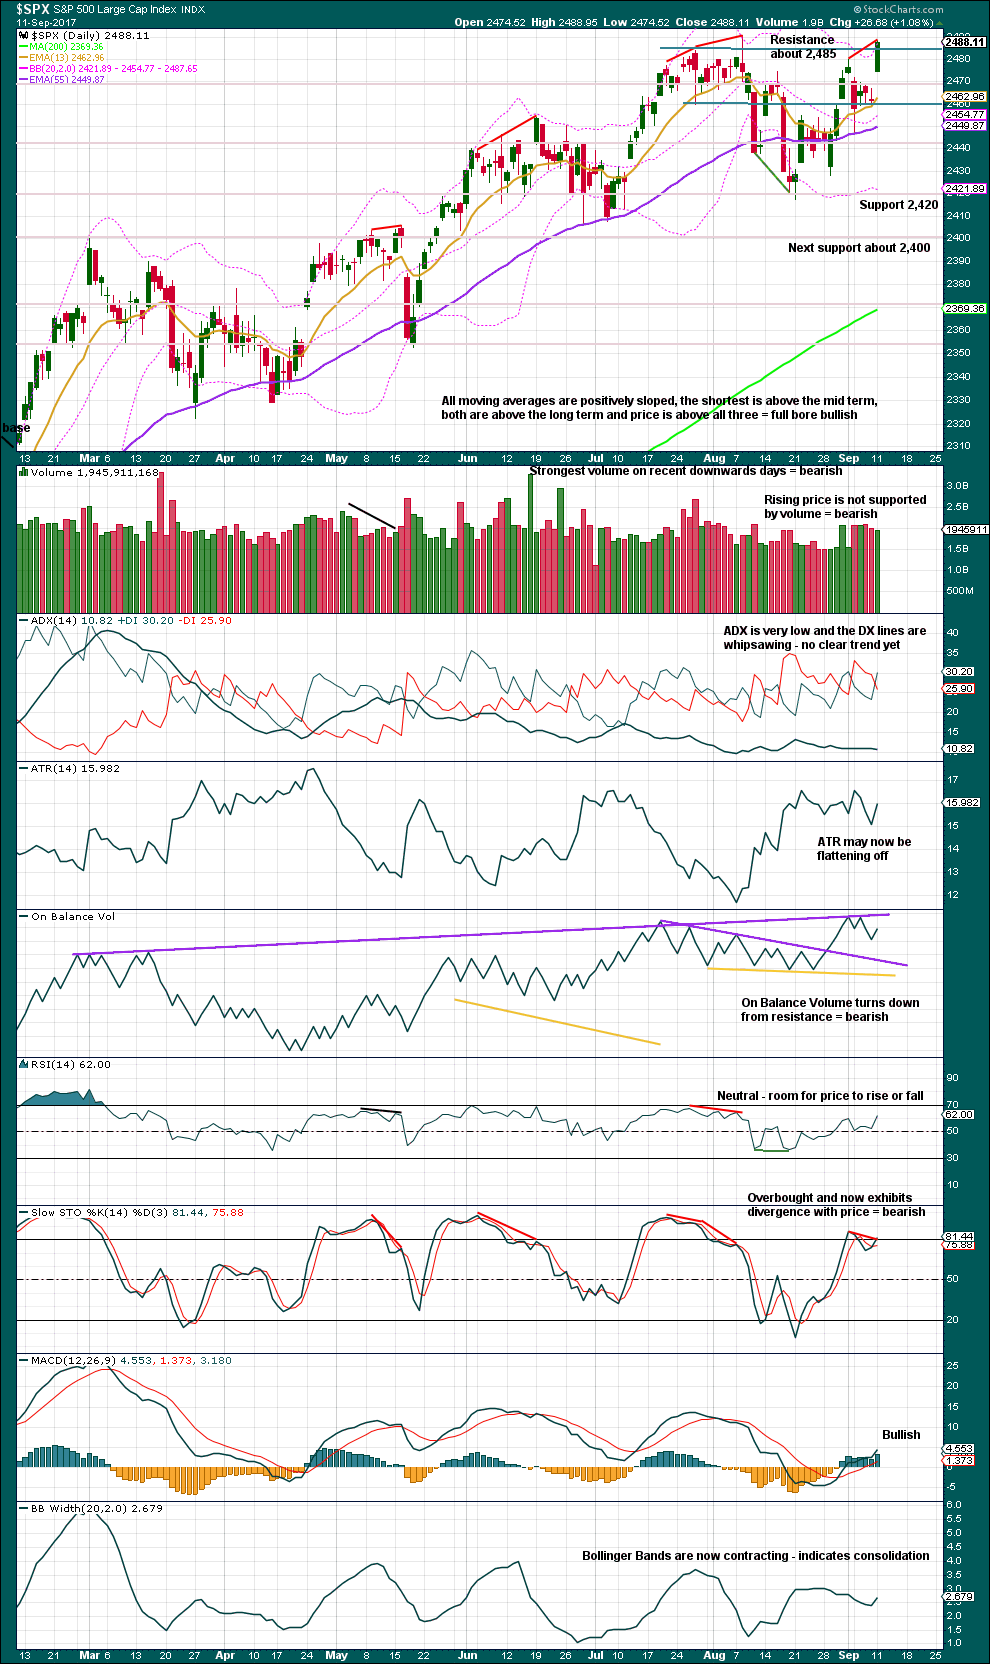
An inside week closes red and the balance of volume was down. Volume shows a slight decline; during the week, the market fell very slightly of its own weight. This will be read as neutral; the slight decline in volume is very small.
Overall, this chart is bearish. Give reasonable weight this week to the bearish signal from On Balance Volume because it supports the Elliott wave counts.
DAILY CHART
Click chart to enlarge. Chart courtesy of StockCharts.com.
Only if an upwards breakout to a new all time high is seen, which very importantly should have support from volume, would the view that price is consolidating have to change.
Price is still within a consolidation zone. Expect swings from resistance to support and back again. Stochastics is now again overbought and now exhibits clear short term divergence with price at the new high today. This is a very typical look and very often is followed by a downwards swing.
ADX, Bollinger Bands, and now maybe also ATR, all agree that price is consolidating. This is what should be expected for a larger correction such as primary wave 4, and this supports the main Elliott wave count.
For the very short term, there is weakness today from volume but the candlestick is strong. It is entirely possible that price may yet move higher tomorrow and then exhibit multiple divergence with Stochastics. For confidence in the end to this upwards swing and the next swing down beginning, I would prefer to see a candlestick reversal pattern or a candlestick with a long upper wick. There is neither today.
Price does not move in straight lines within consolidations. It may also overshoot resistance or support before turning. Stochastics may remain overbought or oversold for a while; it is not an exact timing tool for price turns. This makes trading consolidations very risky. Typically, swing trading systems will have a series of small profits and a few large losses. Please manage risk carefully using my two Golden Rules:
1. Always use a stop.
2. Invest only 1-5% of equity on any one trade. Less experienced members should reduce that to 1-3%.
VOLATILITY – INVERTED VIX CHART
Click chart to enlarge. Chart courtesy of StockCharts.com.
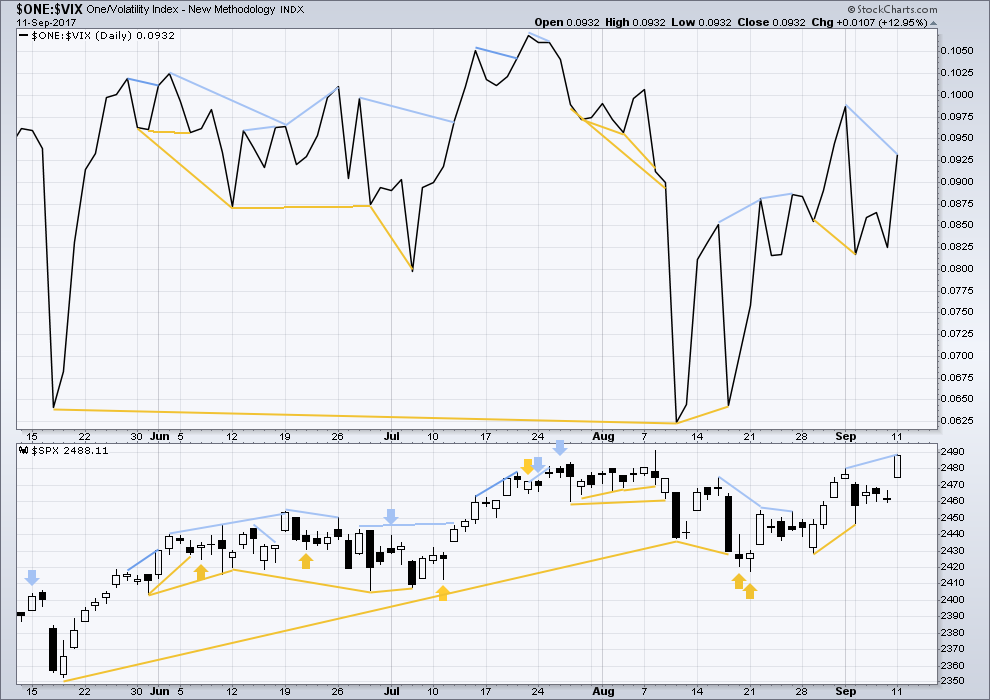
Normally, volatility should decline as price moves higher and increase as price moves lower. This means that normally inverted VIX should move in the same direction as price.
There is regular bearish divergence today between price and inverted VIX: price has made a higher high beyond the prior short term high five sessions ago, but inverted VIX has failed to make a corresponding high. This indicates that upwards movement for price does not have a normal corresponding decline in market volatility, that there is weakness here within price.
BREADTH – AD LINE
Click chart to enlarge. Chart courtesy of StockCharts.com.
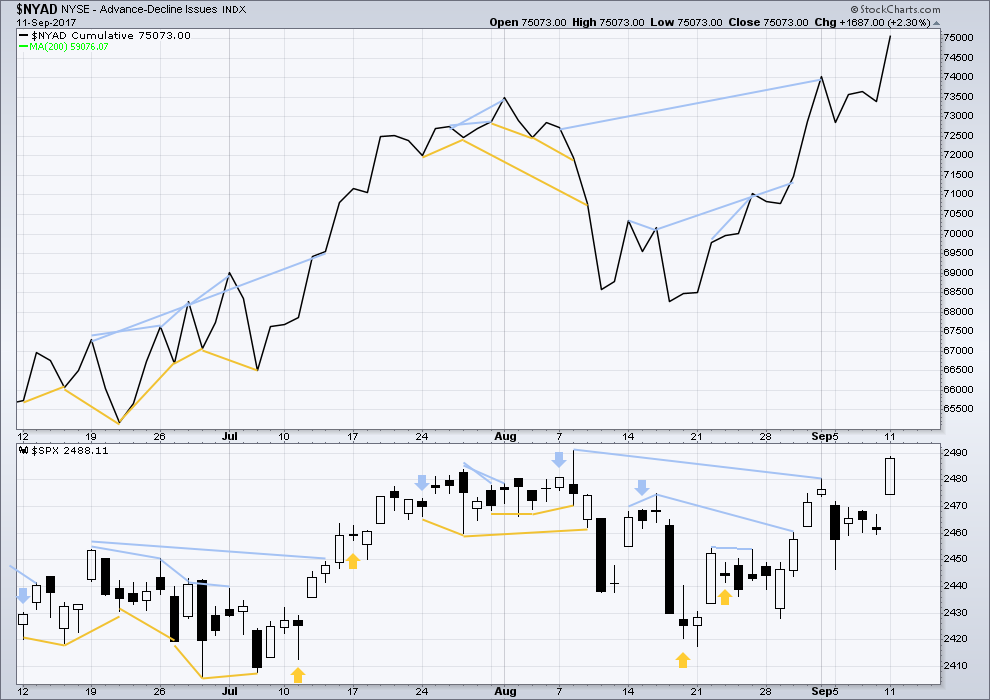
With the last all time high for price, the AD line also made a new all time high. Up to the last high for price there was support from rising market breadth.
There is normally 4-6 months divergence between price and market breadth prior to a full fledged bear market. This has been so for all major bear markets within the last 90 odd years. With no divergence yet at this point, any decline in price should be expected to be a pullback within an ongoing bull market and not necessarily the start of a bear market.
There is no new divergence today between price and the AD line. The new short term swing high today for price comes with normal increase in market breadth above the same point five days ago. The rise in price today is supported by a corresponding rise in market breadth.
DOW THEORY
The S&P500, DJIA, DJT and Nasdaq have all made new all time highs recently.
Modified Dow Theory (adding in technology as a barometer of our modern economy) sees all indices confirming the ongoing bull market.
The following lows need to be exceeded for Dow Theory to confirm the end of the bull market and a change to a bear market:
DJIA: 17,883.56.
DJT: 7,029.41.
S&P500: 2,083.79.
Nasdaq: 5,034.41.
Charts showing each prior major swing low used for Dow Theory are here.
Published @ 10:50 p.m. EST.
The failure of DJI to notch a new all time high today is very strange indeed. It makes no sense whatsoever considering the complete absence of selling pressure. I know one thing for sure and that is it is not a neutral sign. It is either very bullish, or very bearish.
Considering Dow Theory, I’d take it as bearish to neutral. Failure to confirm means the ongoing bull market is unconfirmed at this stage.
Which means P4 could be upon us.
If DJIA does make a new ATH then we would still have to wait for DJT to also do the same, and it’s a fair way off.
Before I jump into comments below, an updated hourly chart:
I have been repeatedly warning a new ATH may be seen, could in fact be fairly likely, and still part of P4. This does not mean P4 cannot be underway.
B waves do this, so do X waves. And they do it reasonably commonly.
The key is to look at the B or X wave for signs of weakness, or lack of. If it has weakness then that supports a B or X wave. So far this one has weakness.
But now we come to our current problem. This bull market has been marked by some persistent weakness, particularly volume. The 18th, 19th and 22nd of May volume was declining yet that was the start of a great bull run. Upper candlestick wicks on 18th and 19th also pointed to weakness.
So I’m wary of it, and will consider alternates. But P4 has to turn up sooner or later.
I know the wave count does not call for it but what if we see a decisive break above 2500.00?!
I cannot recall how many times this market has taken what would seem a highly illogical course contrary to all reasonable and rational expectations so nothing is beyond the realm of possibility. You know what they say about rational market behavior and investor solvency! 🙂
If we see any strength to this upwards move then it’s going to have to be the new alternate 🙁
I don’t like it. But then the S&P just doesn’t always have nice looking waves.
I certainly have to agree that the overall larger picture is quite bearish. Then again, I have been saying that a few hundred SPX points back! 🙂
But seriously, we are some some hugely important fib numbers going back all the way to 1980, here around the 2490 area so I am expecting (and trading) as if at at least important interim top is at hand. I could be wrong….it would not be the first, or last time! 🙂
Fourth shooting start since the last DJI top on August 8. Every single one has been followed by at least one day of decline. Buying SPX 249.50 puts expiring tomorrow for
0.28 per contract. Very small contingent for a very short term trade. They owe me some from last Friday! 🙂
Crossing my fingers for you.
I’ll probably get skunked again. These short term speculative plays have simply not had any co-operation from Mr. Market of late…lol!
I play a buy at close, sell at open game with SPY and IWM calls/puts based on certain criteria… It’s been a rough few weeks for those. However, both call for puts today. Not sure how much I trust it, however.
Based on late day VIX action looks like we have another high to go on this low volume. Likely be tagging of 2500 plus level tomorrow and then hopefully that will be it.
Classic paint the tape to end session at highs. Almost always means at least initial move higher for start of trading tomorrow. One more day up hopefully, then that last gap should become an exhaustion gap or this analysis needs reworking and I need to deleverage my anticipation of a imminent dump. I do get some satisfaction from seeing relative low volume on SPY and TVIX.
Yep. Looks to me like we need a fourth and then a final fifth wave up to end this wedge so I think we go up until Friday.
Hang tough for 1-2 days of low volume push up. The way the VIX was initially trading after that pop on SPY up to 250, I thought that may be it but obviously not. So underwater little while longer. Patience. Volume is my friend so long as there are no hi daily volumes in next 1-2 days and some divergence creeps in.
Volatility has now become another pawn of the big players so I don’t pay as much attention to it as I used to. I am simply buying VIX whenever it falls below 11.00 and selling it when it goes above 13.50, rinse and repeat….
I have (had) a cluster of symmetry projections for SPX to the 2492 to 2497.5 zone, and at the moment a turn is developing right in that zone. Tomorrow will be telling.
Looks like we have an impulse down off this morning’s highs…can the bears keep up the pressure?!
followed by a new high…
there’s a big overlap between what could be wave 4 and wave 1 in that last little wave down during today’s session (on the 5 minute chart)
a fade up into the close…. no trend change yet.
Good ole Apple popped SPY over the $250 mark. Crazy.
DJI needs to make a new high so all the indices can turn together. If it does not do it today we are likely to see another spurt higher tomorrow.
I have to say on taking a step back and looking as some of the indices, things are looking ending diagonal-ish to me folk…is it just me and am I missing somethin’?!
Just saw that myself on the qqq.s…rising bearish wedge. However there are the commercials who have gotten out of their short positions. I think the only thing fueling this market now is short sellers who the govt see as anti American and therefor ripe for picking. They ramp the markets at will when short positions by speculators rise hi enough where they can pump money into the market via the working group mandate and exfoliate the small for the big commercials. Volume doesn’t matter when they make up there minds. Banks take the other side of the trade and go long, at least those being used as pump primers. When this ponzi scheme ends those who perpetuated it will be hung in the town centers to much cheering by those who were fleeced. The madoffs are many and they are powerful and aligned.
I am afraid you are right. When all those folk who think their hard-earned pensions have been protected by good stewardship via risk-averse instruments
find out exactly what was done with their nest egg there will be hell to pay….
Anyone aware of the inverse correlation between Yen and SPX that a lot of the trader talking heads are talking about over the last week? Today, more of the same general inverse correlation. HOWEVER, I see that FXY is all the way down on a 2 month long trend line and perhaps ready to turn back up? I’m even tempted to buy some. What I wonder though is…why such an inverse correlation? John Carter even claims you can watch Yen prices and they give a 10 minute lead indicator on what SPX is going to do. Seriously??? Why would that be??
For the longest while now, the short the Yen, juice equities trade has been well known, reported, and observed…..I’ve mentioned it a few times here in the comments. The same trade has been in vogue for quite some time with regard to volatility.
Are they really? The correlation co-efficient of $SPX and $USDJPY is currently 0.24.
They are quite simply not correlated.
Looking at the fluctuation of their correlation co-efficient it is completely and utterly unreliable. Big swings from positive, through no correlation, to negative…
The talking heads are talking rubbish. And that’s not my opinion, that’s math.
Where are you able to pull up co-efficient on currency pairs?
Stockcharts. Indicators > correlation > choose your market.
Traders shorting they yen and buying the indices are more than likely doing it on a day trading basis, so this could be why the CC does not reflect it but it is really no different than what they use to call the “carry trade” which took advantage of interest rate disparities among central banks. It is certainly true that carry trades were held for longer periods with a resulting much clearer correlation.
I suspect this kind of trading activity is primarily responsible for EW triangles with prices whipsawing back and forth as traders enter and exit positions but with price essentially moving sideways.
The last session Nasdaq came down to fill the gap but they still managed to ramp prices higher. We are seeing a replay today with another initial gap fill by tech, but will they be able to again keep this thing elevated into the close?! I doubt it…
*edit* They did not actually close the gap from Monday’s open so I stand corrected on that score…
Exiting short leg of my bullish diamond credit spread. Holding DIA 112 October puts just at about zero cost basis. Will add substantially to short position with a break of 2475…
Oops! I meant DIA 212 puts, of course! 🙂
We have an upper B band penetration/shooting star combination in both DJI and SPX.
I am not saying prices cannot go higher; I am definitely saying the odds are firmly against it! 🙂
And if price closes lower today in yesterday’s range we’ll have ourselves some Dark Cloud Cover! Day’s not over yet though, as gap fills, buying pressure will resume I’d expect. I do believe SPX is topping, but I think a few days to roll over will be required.
Yep! They will not go gentle, into that good night, now will they?! 🙂
If anyone’s looking for intra-day longs, you might look at incy and/or algn (though if they are still set up by when this posts I don’t know…).
Ka-ching. I love scalping GS, INCY, ALGN, and ICE. I find them “well behaved” for such trading, and many days I’m able to squeeze something out of them on the long side at some point. I got GS first this morning, now a good bite after the pullbacks in INCY and ALGN.
I am raising my trigger for entering fully short and exiting remaining hedges to 2475 as that places us in the price area of the Monday gap….
These series of opening gaps are glaring red flags. You get these series at the start, and at the end of protracted bull runs. The volume profile continues to suggest “deep pockets” buying as well as possibly indicating that all the bullish buyers are already “all-in”.
I have wondered over the years about the market’s ability to continue higher on such thin volume and I am starting to suspect that the answer may lie in the amount of leverage being employed. We know banks, many of whom are buying equities, are permitted to leverage as much as 32:1, and if they are doing that in these markets, the unwind is going to be quite interesting. I would expect the first sign of trouble to be corresponding gaps down.
I cheerfully unloaded my SPY 249 calls for 0.95 at the open. That was a nice triple! 🙂
The central banks have succeed in creating asset scarcity. From a non-EW perspective, I don’t see how it’s possible to get a primary degree correction that is not also the end of the bull cycle. The absolutely only way a bear shows up is if the central banks are spooked into selling.
I have also entertained similar musings Chris. I have long suspected that the reason for the extended duration absent any real correction in the market is that the banksters simply cannot afford to have that happen because of the spectacular leverage they have used to push the market to these heights. I concluded that the next real correction would mark the end of their ability to control the market as it would be taking place despite their determined efforts to prevent it. I know this is not in sync with the current EW count but I have been giving that idea some serious thought as well.
It could be a very shallow sideways chop? Which they could interpret as the normal and usual market consolidation, nothing to see here, and with no big drops down.
If (A) is indeed the end of A of a triangle, then that could even be the lowest extent of the price range for P4
I don’t see any volume on SPY. No “conviction” supporting this up move…yet. Gaps below hungry to be filled. And just above, a cluster of symmetric move lengths terminate, creating a decision zone. A turn is approaching, consistent with the main count.
Going to be looking for 5 waves up to complete from recent SPX low of 2486.09 to try to determine point to add to shorts on this gap up. Thinking immediate target of 2493 as new ATH on SPX and then likely take out of round number of 2500 by a small margin and then hopefully retest of 2420 in works in the days thereafter. Perhaps towards then end of the Apple tech event after 1pm est, will serve as time for turning point. Buy the rumor , sell the news. If we penetrate 2500 to any significant extent to upside I am going to have to bail on short position.
Nobody is going to buy that $1,000 phone! Only the very well off.
IMO… that phone is not worth it. Only foolish or well off will buy. Spend your money wisely… and certainly don’t go into more debt or take on another big monthly payment to buy that expensive toy!
I think you underestimate the cult.
Maybe… But it’s still Foolish to spend that kind of money on that type of device!
The fools are creating inflation on a product that is deflationary in nature.
The Fools believe the “Con”!
Is it foolish when it replaces your cable tv, Internet, and computer though?
I not watching a movie or TV or Sporting event on a 5″-6″ screen where the battery is going to die near the end of it! I am not listening to music for enjoyment with that tin sounding ear plug!
Same for the internet… those phones take you to sites that the phone wants to take you to. I want the freedom to explore what I want… without being pushed to the highest bidder sites! The phone is very controlling!
Personally I am going from a 55″ screen soon to 70″ – 80″ screen with pulsating surround sound where the Bass vibrates the Body. That’s how you watch a Sporting event or a movie!
Those tech jerks thing they can change that? No way in hell!
It’s just another “Con” on the population!
Same thing with a self driving Car! Give me that 5.7 367hp Hemi engine…
Maybe you won’t but all the 20-30 yr olds are. I’d say 50% of my friends have no cable tv. Netflix/Amazon Prime + Phone/computer.
Give me that 5.7 367hp Hemi engine… Complete freedom behind the wheel… not crawled up in the back seat on a smart phone like a zombie!
Self driving Car… That’s another Con!
Another way to control you and everything in your life ! Don’t believe it???
It was revealed this weekend… When “Some Florida Tesla owners were surprised to see their vehicles were granted extended range capabilities thanks to an over-the-air update quietly pushed out by the company in advance of Hurricane Irma’s arrival.” https://www.usatoday.com/story/news/nation-now/2017/09/10/tesla-remotely-extends-range-vehicles-help-hurricane-irma-evacuations/651232001/
That’s is Control!
Self Driving Cars are Complete Control of you!
Your Future… Miss a Debt payment and your car takes you right to the Debt Police to extract that payment directly from you while they keep you in a cage until it transmits.
If you don’t have the money they force you to sign over assets so you can get out of the cage!
Mommy and Daddy’s money will run out some day and then then how will they afford it?
I will shut up now! Sorry, but I can go off on a tangent replying to this off topic stuff about some tech. I will now fade into the background again!
Booh! Yah! Love the Panasonic 5.1 surround sound with that bowel shaking sub-woofer dude! 🙂
Thanks for the chuckle Joseph 🙂
And we all here are by now used to your passion about some subjects. It’s all good.
I do tend to agree with you re the cost of the iPhone. And surround sound 🙂
I would however like an electric car, powered by solar panels on my roof, and able to self drive me if I drink too much wine. That sounds pretty good to me.
I recently read about abounding hubris in the tech sector. In addition to the new headquarters being planned for Amazon, this 1000.00 dollar I-Phone certainly qualifies. Remarkable that anyone is willing to pay that kind of money. I was finally dragged kicking and screaming into the world of smart phones owing to constant ribbing by my daughters about the “dinosaur” flip phone I carried quite contentedly. It was a rugged little devil made by Kyocera for construction folk that I really was quite fond of. It did not do Whatap and all the other fun stuff that my Zen Phone by Asus does, and my daughters are also now happy they can keep me busy with various and sundry requests, if ya know whatta mean! 😉
I was late to a smart phone as well… now my Galaxy 4s is 3 Years old. When it breaks, I will get a new one.
A few years back I was driving my daughter and her friends somewhere and instead of talking to each other on the ride they all had heads down playing with their phone… and then texting each other when they had something to say.
Smart phones are fueling and anti-social Society…. of mutes!
There are some very serious studies that have been published about what these things are doing to the population, mentally, psychologically, socially, and yes, biologically. For you dudes, it has implications regarding your ability to propagate the species; and I am NOT kidding! 🙂
I have an iPhone, I think it’s an iPhone 4? It’s years old now.
I’ve named it “stupid phone” because it’s really not that smart.
Then I named my laptop “God”, and my desk top “The Fourth Dimension”.
Every morning to start work I have to connect God to the Fourth Dimension.
And when I play music and scroll through devices on the bluetooth speaker, it tells me “connected to God” or “connected to The Fourth Dimension”.
It amuses me no end 😉
Yeah, the $1,000 iPhone sure does look toppy…
The high will come soon… ish. It’s on it’s way. Things can get more extreme and stretched first.
I will absolutely not be buying one of those anytime soon. My old iPhone 4 will have to limp along for a while yet.
Ugh. Facial recognition to unlock my phone? I can see how that could be all kinds of bad. I don’t think they thought that one through too much…
It’s $1000 now, to extract top $$$$ from the core cult. Then they drop it to $800 and get another set to buy. Then to $600, etcetera. It a process of maximizing income over time, and it works for new highest end products like this.
That was likely end of second wave correction of early morning high. 3 more waves to go unless high of today stands and gap is filled.
Sorry Verne – what is AN?
Auto Nation.
My credit spread on AN resulted in an option assignment today. This is an attempt by the call holders to lock in my losses (they could have sold their in the money calls) ahead of the inevitable plunge in AN over the next few weeks, or possibly the call holders expect more upside (which I doubt) and plan on holding onto their shares. When this happens if you are trading credit spreads, if the long side of the spread is in the money you should immediately exercise it to cover the short sale. In my case, the long calls bought are out of the money so the trade will be managed by immediately buying to cover, and re-selling the spread at a later expiration date. I had planned on rolling the position today as the spread did not expire until this Friday but they beat me to it. AN remains an excellent short candidate, and trades that temporarily go under water do not necessarily have to become loosing trades if you know how to manage them and are right about the main trend. Cheers, and short AN! 🙂
Honestly, just reading that gives me a headache. I find it hard enough to buy low and sell high (and v.v.). The added multi-dimensional and process complexity of options…not for me!!!
I don’t think you’re the only one Kevin. While I understand academically what Verne is doing, I would never try to follow it.
I prefer simpler cash markets. It’s hard enough to try and get price right, let alone time!
I learn just a little more each time I read Verne’s trades though, so thank you again Verne very much for sharing.
Oh…it’s not so bad…! 😀
Futures suggest gap up to new highs. As posted previously every other gap up to new highs in last while has been filled so hopefully this will be exhaustion gap to complete C today.
Yep… futures market players controlling price with yet another gap up. Cash market players can only buy (go long) at the inflated prices… if you dare.
I am going short sometime today… Yes, I like the continued pain of picking these spots.
If you’re new here, don’t follow my lead!
I have always liked your sense of humor Joe. I have been long for a while and will be liquidating my positions today or in the next few days. I would be looking to join you on the short side except that next week I leave for a week long expedition in the mountains. I am hoping I can avoid any snow fall since I be about 11,000 feet above sea level.
Some of the newer members may not realize it, but members like Joe, Vern, Olga, myself and others have been here for many years. I think I joined in January 2012. Some years ago we began sharing our trades on this forum for all to see. I have appreciated that courtesy and have posted my trades as well; winners and losers. But based on Lara’s commentary yesterday regarding her concern for members risk management or lack thereof, I am thinking perhaps it is time for me to cease listing of my actual trades. So after I liquidate these long positions in my short term account for a handsome profit, I will no longer list my trades. I will keep my commentary to EW and TA. Perhaps no one really cares one way or the other if I/we share our trading. I will miss doing so. But I, in no way, want to be a contributor to the angst of our leader or the trading decisions of EWSM members.
Blessings all and have a great day.
PS – Vern, I am glad you did not suffer any bodily harm by the forces of Irma. I hope your friends in BVI are safe and wish your rebuilding goes well.
I’m sorry to hear that you’ll not be posting trades Rodney. I think it’s just fine, and I’m quite happy to jump in from time to time with my words of caution.
There is literally nothing any one of us can do, not me nor any of the long standing very experienced traders here, to stop novices from ignoring risk management advice and wiping out their accounts.
I can get frustrated with it, but I don’t think I can stop it. I just need to relax and keep giving the advice.
There may still be plenty of other members who are more disciplined who can follow your trades and maybe even join you.
Another trip up the mountain, I think that bear is in hibernation. Don’t poke the bear Rodney!
For what it’s worth… I am now positioned short!
Yes, self deprecating humor. Most of the time I am a touch early… every once in a while I am spot on. Although, the last time I was spot on was May/June 2015… But positioned a good portion Long-term that did not pan out.
This time around… no Leap options will be used or options at all.
All cash trades and trading more actively as the waves unfold.
Yep! I will be selling my SPY 249 calls at the open and half of my bullish 212/215 diamond spreads. The last half will be held until we break 2470 to the downside, which may not be that far off….
Thank you Lara for providing the alternate with an extended P3. It is helpful to compare to the other wave counts and technical analysis. Upon seeing it, I agree the proportions are rather bad and line up poorly with technicals. If VIX heads below 10 though, as it seems wont to do, I wouldn’t be surprised if we just keep going up and up and up…
That one was the best of several scenarios I tried to chart and discarded.
Is there a possibility that somewhere in the intermediate wave 3 to end of intermediate wave 5 action, that some kind of wave 3 extension occurred, resulting in the smaller (approaching 4 weeks) correction we’ve seen being a complete 4 of a smaller degree? Not possible, scale all messed up with such a count? I don’t know. I just wonder IF this move gets legs, what changes.
Oops, I failed to see the daily alternate!! Yes, that…hmmm.
Hi Lara,
Is there hourly chart for today’s main and alternate wave count?
Thanks,
Hourly chart now in today’s analysis.
number 1 again