
Upwards movement was expected to continue to about 2,467. Price reached to 2.64 points above this target.
Summary: With the last wave up now looking very much like a three, have some confidence that primary wave 4 is underway. Look for price to move either sideways or lower with a lot of overlapping choppy movement for a few weeks.
In the short term, downwards movement is expected for tomorrow.
Last monthly and weekly charts are here. Last historic analysis video is here.
ELLIOTT WAVE COUNT
WEEKLY CHART
Click chart to enlarge.
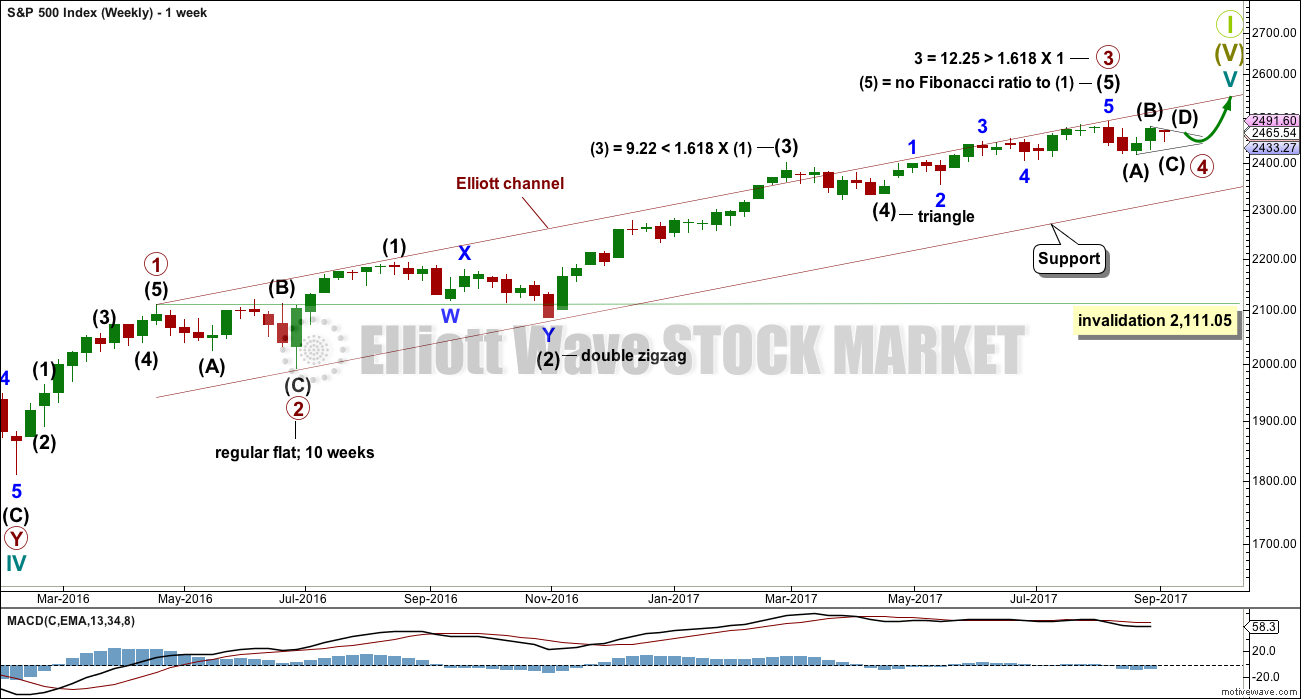
Primary wave 3 now looks complete. Further and substantial confidence may be had if price makes a new low below 2,405.70, which is the start of minor wave 5 within intermediate wave (5). A new low below 2,405.70 may not be a second wave correction within an extending fifth wave, so at that stage the final fifth wave must be over. Fibonacci ratios are calculated at primary and intermediate degree. If primary wave 3 is complete, then it still exhibits the most common Fibonacci ratio to primary wave 1.
Primary wave 4 may not move into primary wave 1 price territory below 2,111.05.
Primary wave 4 should last about 8 weeks minimum for it to have reasonable proportion with primary wave 2. It is the proportion between corrective waves which give a wave count the right look. Primary wave 4 may last 13 or even 21 weeks if it is a triangle or combination. So far it may have just begun its fourth week.
If primary wave 4 unfolds as a single or double zigzag, then it may find support about the lower edge of the maroon Elliott channel. If it is a triangle or combination, it may be more shallow, ending about mid way within the channel.
At this stage, the analysis gets complicated because there are several possible structures that primary wave 4 may be. The ideas for a triangle, combination, double zigzag, and single zigzag will be separated out into different daily charts in order for members to have a clearer picture of how price may behave for each. It is still impossible for me to tell you with any level of confidence which structure primary wave 4 may take, so all possibilities must be considered. I can only say that a single or double zigzag, or a triangle, would be most likely to exhibit good alternation with the flat correction of primary wave 2.
The final target for Grand Super Cycle wave I to end is at 2,500 where cycle wave V would reach equality in length with cycle wave I. If price reaches the target at 2,500 and either the structure is incomplete or price keeps rising, then the next target would be the next Fibonacci ratio in the sequence between cycle waves I and V. At 2,926 cycle wave V would reach 1.618 the length of cycle wave I.
DAILY CHART – TRIANGLE
Click chart to enlarge.
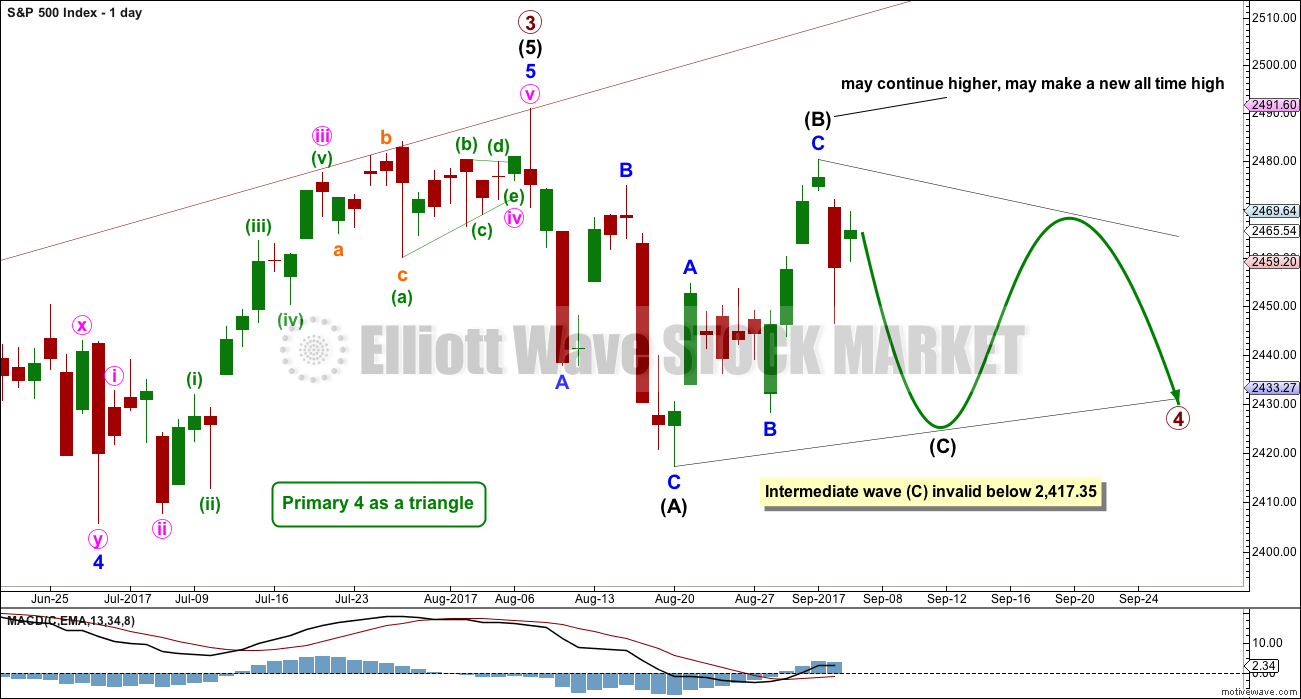
This first daily chart will illustrate how price might move if primary wave 4 unfolds as a triangle.
Intermediate wave (B) may possibly be complete at Friday’s high. If it is complete there’ then it would be a 0.86 length of intermediate wave (A), which is very close to the common range for triangle subwaves of about 0.8 to 0.85.
It is still possible that intermediate wave (B) may continue higher as a double zigzag. One of the five sub-waves of a triangle should be a more complicated multiple; most commonly that is wave C, but it may be any sub-wave. If intermediate wave (B) does continue higher, it may make a new all time high as in a running triangle.
The triangle may still last a total of at least eight weeks, and possibly longer.
Both intermediate waves (A) and (B) look like three wave structures.
If intermediate wave (B) is over, then intermediate wave (C) may be more complicated and time consuming than either of intermediate waves (A) or (B). Intermediate wave (C) may not move beyond the end of intermediate wave (A).
DAILY CHART – COMBINATION
Click chart to enlarge.
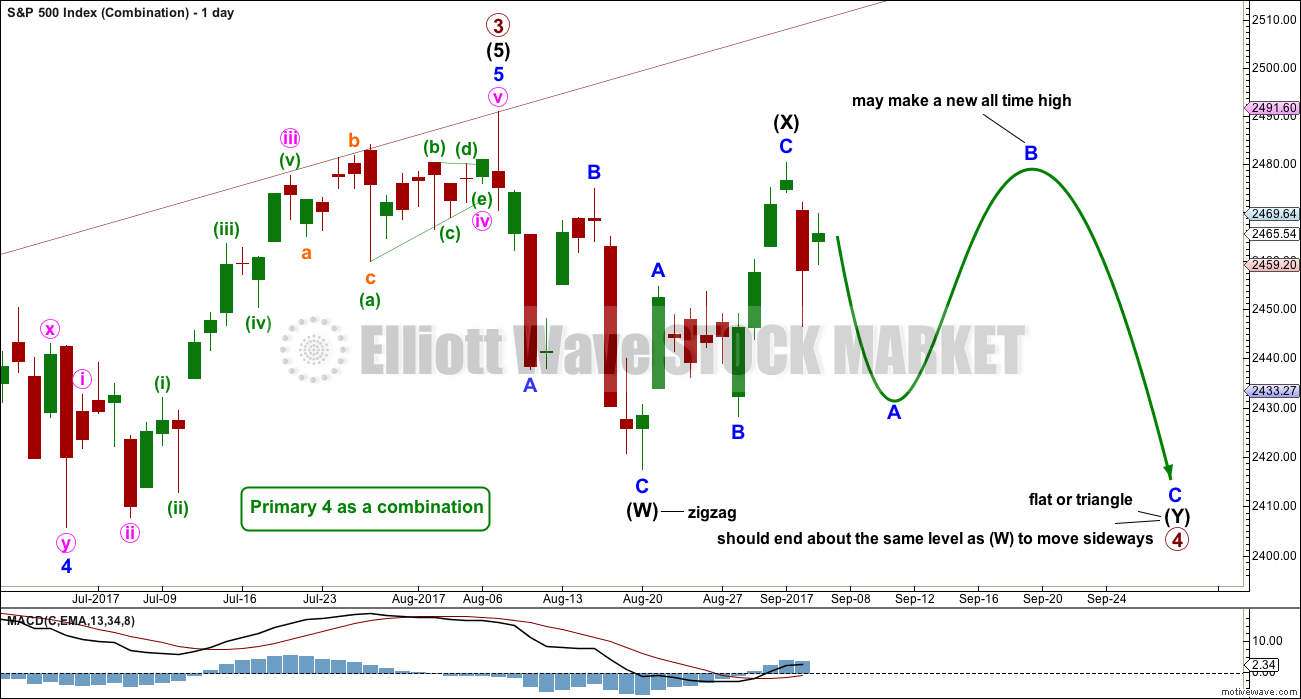
A combination for primary wave 4 would still offer some alternation with the regular flat of primary wave 2. Whenever a triangle is considered, always consider a combination alongside it. Very often what looks like a triangle may be unfolding or may even look complete, only for the correction to morph into a combination.
There may only be one zigzag within W, Y and Z of a combination (otherwise the structure is a double or triple zigzag, which is very different and is considered below). At this stage, that would be intermediate wave (W), which is complete.
Combinations are big sideways movements. To achieve a sideways look their X waves are usually deep (and often also time consuming) and the Y wave ends close to the same level as wave W.
Here, intermediate wave (X) is very deep.
Intermediate wave (Y) may be a flat correction or a triangle. Within intermediate wave (Y), minor wave B may make a new high above the start of minor wave A as in an expanded flat or running triangle; this may include a new all time high. There is no upper invalidation point for a combination.
While intermediate wave (Y) may be a triangle, it is much more likely to be a flat correction. The combination of one zigzag and one flat within a combination is the most common by a very wide margin. A flat correction should be expected for intermediate wave (Y).
Within a flat correction, minor wave A must subdivide as a three, most often a zigzag and minor wave B must then retrace a minimum 0.9 length of minor wave A. Thereafter, minor wave C should move below the end of minor wave A. This structure may take another two or so weeks to complete.
DAILY CHART – DOUBLE ZIGZAG

Click chart to enlarge.
While combinations and double zigzags are both labelled W-X-Y, they are very different structures.
Double zigzags (and very rare triples) belong to the zigzag family of corrections. Combinations are more closely related to flats (these are sideways movements). Double zigzags have a strong slope, as do single zigzags. The second zigzag exists when the first zigzag does not move price deep enough; its purpose is to deepen the correction.
To achieve a strong slope the X waves of double zigzags (and the very rare triple zigzags) are almost always brief and shallow. Here, intermediate wave (X) is neither brief nor shallow reducing the probability of this wave count.
Within the second zigzag, minor wave B may not move beyond the start of minor wave A.
It would still be possible for this wave count for primary wave 4 to end about the lower edge of the maroon channel on the weekly chart.
HOURLY CHART
Click chart to enlarge.
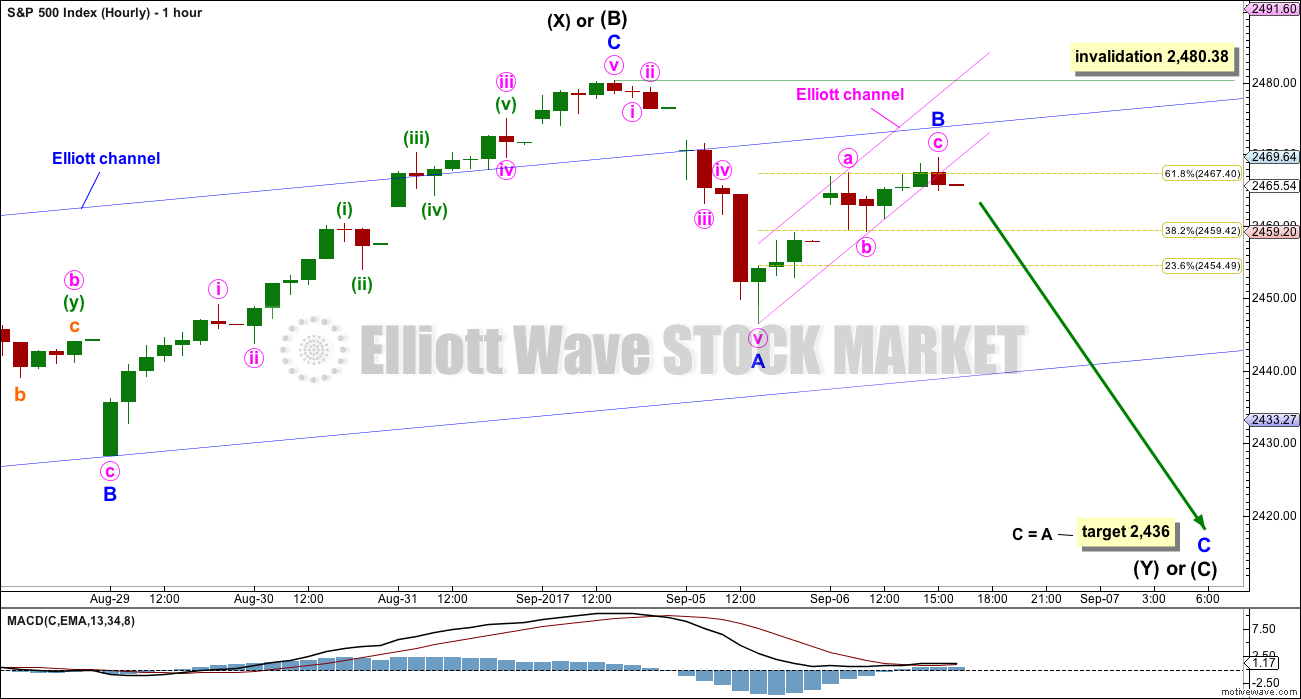
This hourly chart will suffice for all three daily charts above. All three daily charts see the last upwards movement as a complete zigzag for intermediate wave (B) or (X).
With a three down (labelled intermediate wave (A) or (W) ), and now a three up complete, some reasonable confidence may be had that this market is in a larger correction which is incomplete.
Minor wave B may have ended just above the 0.618 Fibonacci ratio of minor wave A, a common point for B waves to end. There is no Fibonacci ratio between minute waves a and c.
A small channel in pink is drawn about minor wave B. This small channel was breached at the end of the session indicating minor wave B may possibly be over. However, the S&P has a tendency to form slow rounding tops. It will breach channels only to continue higher before turning. This is an early indication that minor wave B may be over, but it does not add substantial confidence.
If minor wave B continues higher as a double zigzag (a fairly common structure), then it may not move beyond the start of minor wave A above 2,480.38.
How low the next wave goes should offer some clues as to the larger structure of primary wave 4.
ALTERNATE WAVE COUNT
DAILY CHART
Click chart to enlarge.
The first three daily charts all consider the possibility that the first wave down was a complete three. This alternate considers the possibility that a five down is still underway.
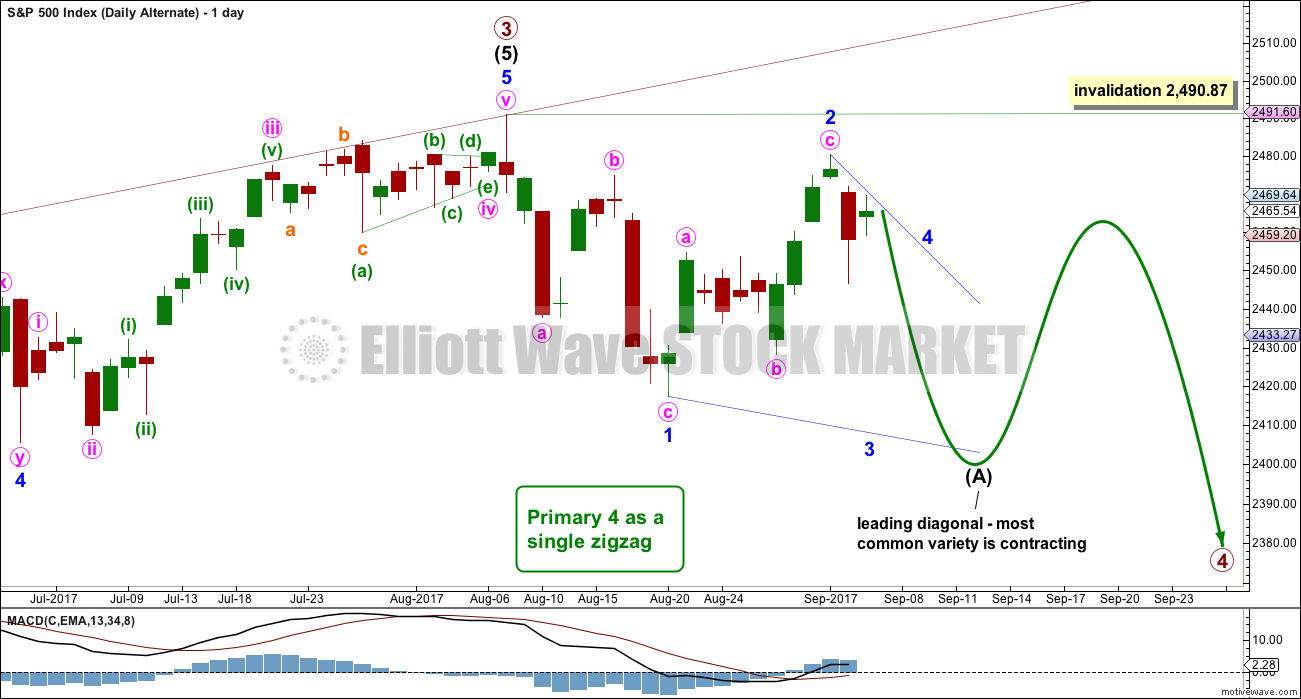
If intermediate wave (A) is an incomplete five down, then the larger correction for primary wave 4 would be a single zigzag.
Intermediate wave (A) may not now be an impulse, because the first wave down is clearly a three and not a five. It may be a leading diagonal.
Leading diagonals have sub-waves one, three and five that most commonly subdivide as zigzags, although they may also be impulses.
Within diagonals, the second and fourth waves must be zigzags and are commonly from 0.66 to 0.81 the length of the prior wave. Here, minor wave 2 would now be 0.86 the length of minor wave 1, not too much deeper than the common length.
Minor wave 3 must make a new low below the end of minor wave 1 below 2,417.35. It would most likely be shorter than minor wave 1, which was 73.52 points in length, as contracting diagonals are the most common variety.
Minor wave 2 may not move beyond the start of minor wave 1 above 2,490.87.
HOURLY CHART
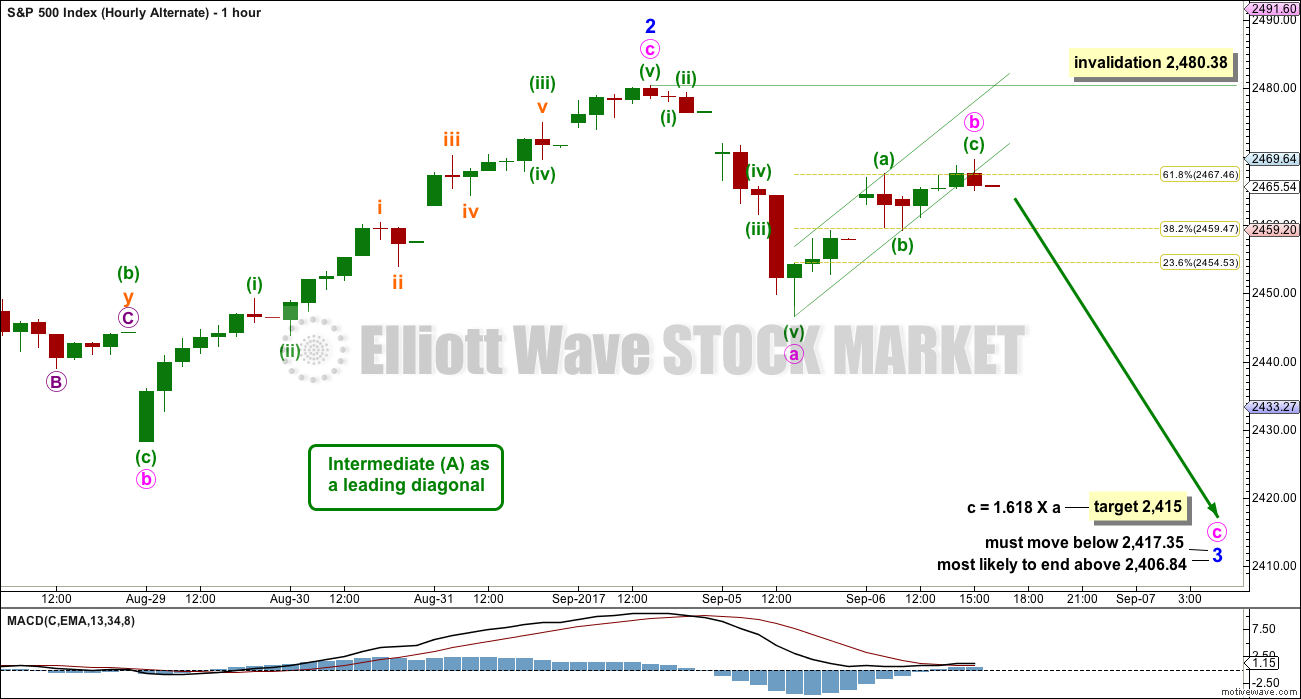
Click chart to enlarge.
Subdivisions at the hourly chart level are the same for all wave counts. Only the degree of labelling and the larger structure differ. All wave counts see a zigzag complete downwards to the last low, and now a zigzag upwards complete.
The most common type of leading diagonal is a contracting variety. In a contracting diagonal the third wave should be shorter than the first wave and the fifth wave shorter still, so that the third wave is not the shortest. If this leading diagonal is contracting, then minor wave 3 must move below the end of minor wave 1 at 2,417.35, and must end above 2,406.84 to be shorter than minor wave 1. The target would meet these conditions.
TECHNICAL ANALYSIS
WEEKLY CHART
Click chart to enlarge. Chart courtesy of StockCharts.com.
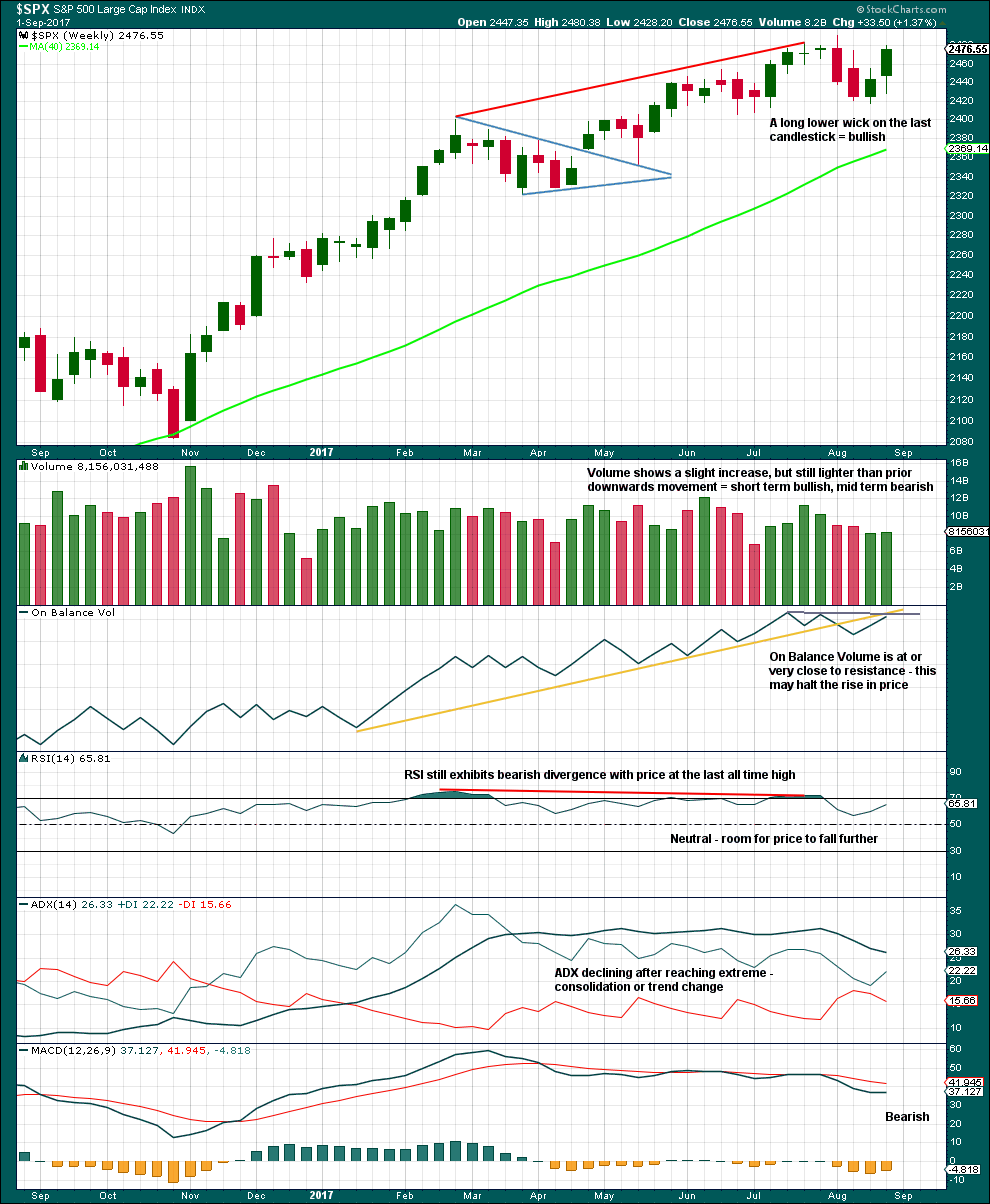
An upwards week has a long lower wick and slight support from volume. In the short term, it is entirely possible that this upwards movement is not over.
However, volume remains relatively light, relative to recent downwards weeks. There is still more support for downwards movement than upwards, so it still looks like a consolidation may be continuing.
Consolidations do not move in straight lines. Price whipsaws from support to resistance, and back again. At this stage, it looks like that is what price may still be doing.
ADX had been extreme for a long time and is now declining. The black ADX line is now declining but has not yet been pulled down below both directional lines, so the consolidation or pullback may be expected to continue.
DAILY CHART
Click chart to enlarge. Chart courtesy of StockCharts.com.
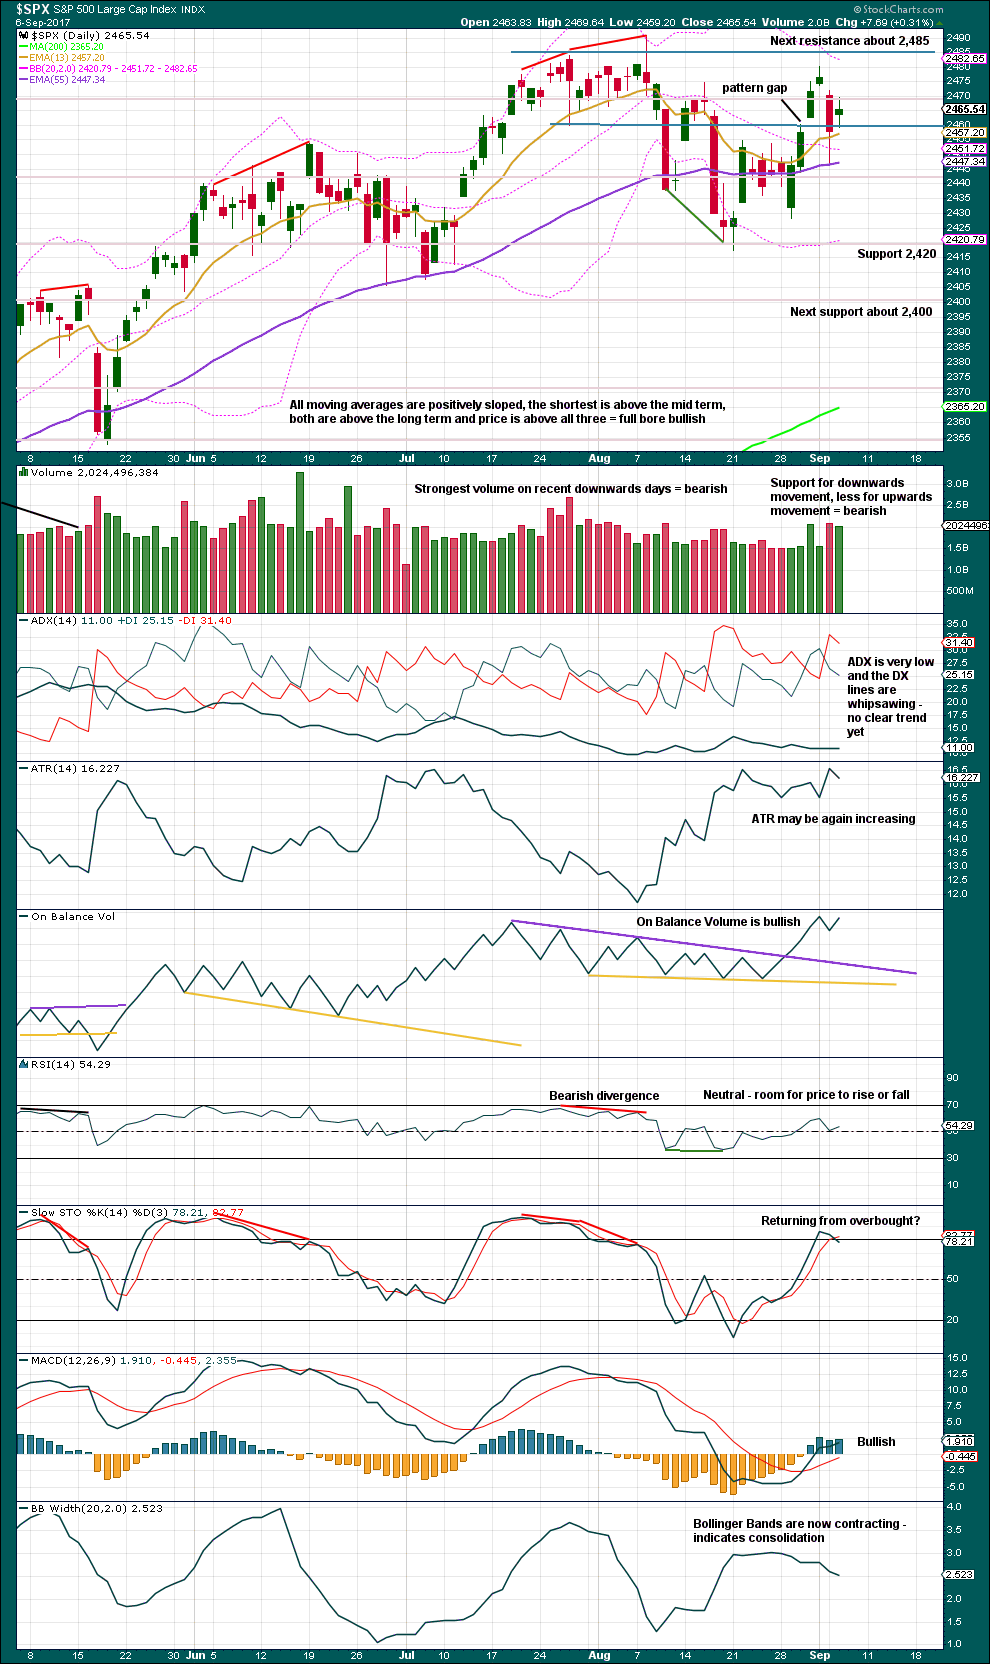
Only if an upwards breakout to a new all time high is seen, which very importantly should have support from volume, would the view that price is consolidating have to change.
Price has bounced up today from support about 2,460. Lighter volume and a small spinning top candlestick indicates weakness within upwards movement today.
Overall, this chart is bearish to neutral with the exception of bullish On Balance Volume and MACD. The bullish signal from On Balance Volume is now balanced out by bearish divergence with the high three sessions ago and the all time high.
One of the best techniques for trading a consolidation is to use resistance and support along with Stochastics to indicate when price may turn. This is a high risk strategy though: price can overshoot resistance or support before turning, and Stochastics is useful but not as an exact technique for timing a turn. Losses can be large but should be few while profits may be many and small. Only the most experienced traders should attempt it.
It is absolutely essential that good risk management and money management techniques are used. Anyone trading a consolidation without using stops is inviting financial losses.
Please use my two Golden Rules of risk management: always use a stop and invest only 1-5% of equity on any one trade.
VOLATILITY – INVERTED VIX CHART
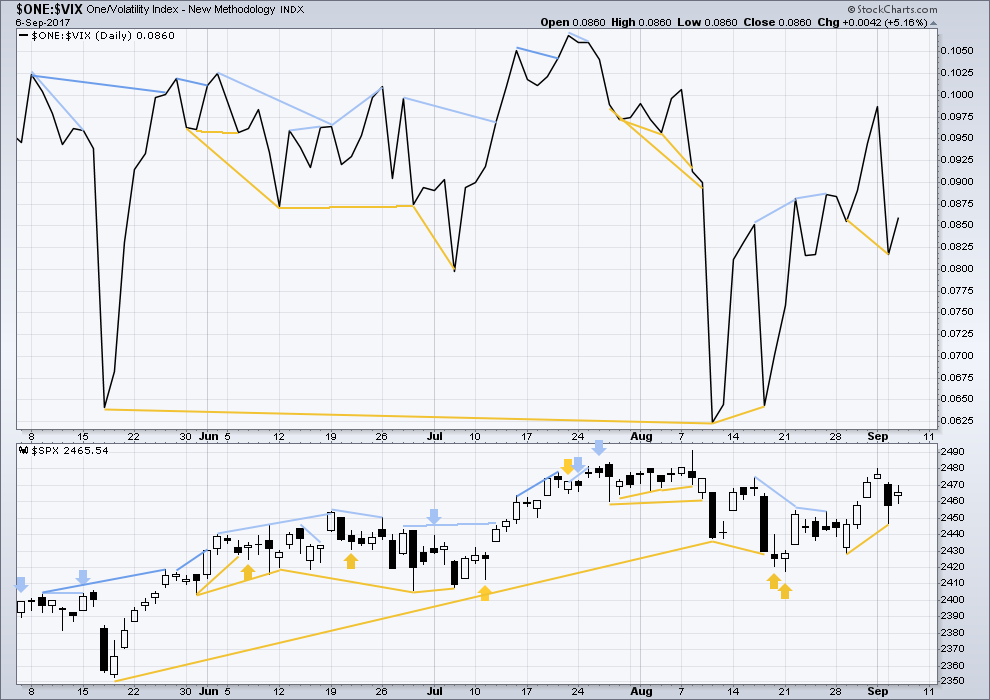
Click chart to enlarge. Chart courtesy of StockCharts.com.
Normally, volatility should decline as price moves higher and increase as price moves lower. This means that normally inverted VIX should move in the same direction as price.
Bullish divergence noted in last analysis has now been followed by one green daily candlestick. It may now be resolved, or it may need one more green daily candlestick to resolve it. There is no new divergence today between price and inverted VIX.
BREADTH – AD LINE
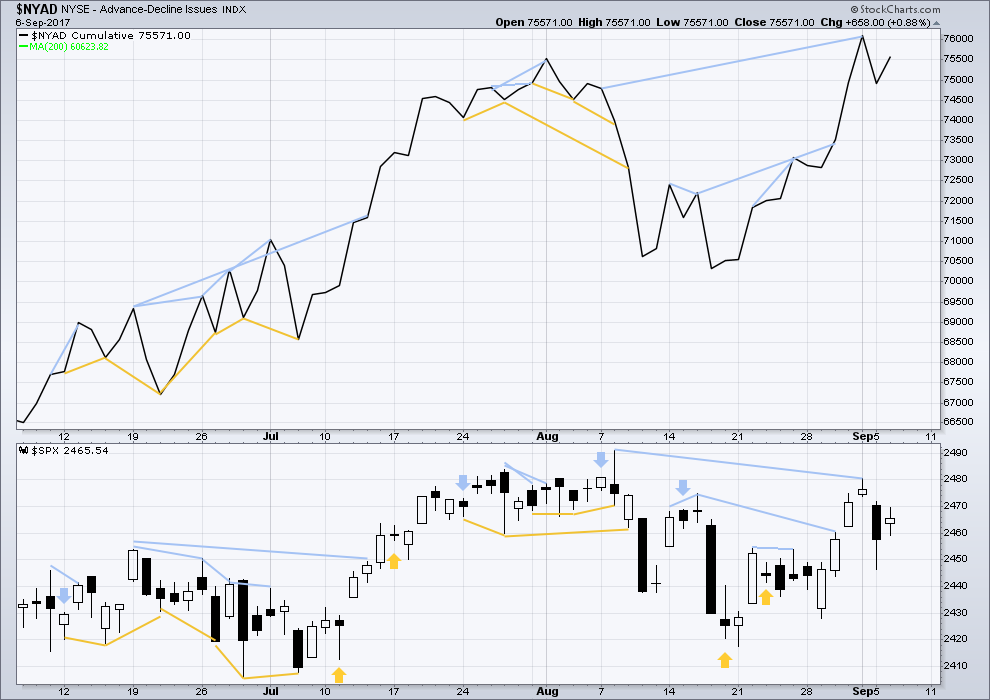
Click chart to enlarge. Chart courtesy of StockCharts.com.
With the last all time high for price, the AD line also made a new all time high. Up to the last high for price there was support from rising market breadth.
There is normally 4-6 months divergence between price and market breadth prior to a full fledged bear market. This has been so for all major bear markets within the last 90 odd years. With no divergence yet at this point, any decline in price should be expected to be a pullback within an ongoing bull market and not necessarily the start of a bear market.
There is no new divergence today between price and the AD line.
DOW THEORY
The S&P500, DJIA, DJT and Nasdaq have all made new all time highs recently.
Modified Dow Theory (adding in technology as a barometer of our modern economy) sees all indices confirming the ongoing bull market.
The following lows need to be exceeded for Dow Theory to confirm the end of the bull market and a change to a bear market:
DJIA: 17,883.56.
DJT: 7,029.41.
S&P500: 2,083.79.
Nasdaq: 5,034.41.
Charts showing each prior major swing low used for Dow Theory are here.
Published @ 07:53 p.m. EST.
Continuing general musings about all things market, KBE today cleanly broke a critical support level. The financial sector has lead this long-in-the-tooth bull market and any widespread break-down there could be a harbinger….
Opened buy order for October 40 puts for 1.00 or better. That is quite a ways below the current bid but knowing the banksters, they are going to pretend that break did not happen with a quick ramp back above that support pivot and offer a very nice entry the next day or two…
Eventually they’ll give in the the fact that they have to raise rates significantly to save the financials and thus the capital markets in general. BKK looks like nested 1-2s, but as you said any clear bearish formations have been quickly arrested. Lara you agree?
Stan Fischer is leaving the FED. Sometimes it is the little, not-much-noticed things that offer a wealth of insight as to what is likely coming down the pike. Fischer is an extremely well regarded individual in financial circles, having been mentor and professor to both Bernanke and Draghi at MIT. Is it possible that this enormously experienced financial veteran is getting out while the getting is good??! 🙂
Both learned and astute Verne. Bernake and Fischer know very well what’s coming, and coming from someone who provides for a young family through asset management, I’m am much more nervous with him gone. Ironic that it coincides with the raising and possible elimination of the debt ceiling. Debt at these levels will never be paid back and is indeed a weapon of mass destruction.
Hourly chart updated:
Looking at the wave down I’ve labelled minute i today on the five minute chart, it will fit as either a three wave zigzag or a five wave impulse. It’s impossible to tell with confidence which one it is.
And so minor B certainly could move higher as a double zigzag. The invalidation point must remain the same.
I’ve drawn an Elliott channel about intermediate (A) and (B). The upper edge should provide very strong resistance if price moves higher. If price breaks above that trend line then I’d have to be much more bullish. But while price remains below the line and we have lower lows and lower highs, then I’m sticking with the view that P4 looks most likely underway.
The tug-of-war should end with a decisive break of 2460 and a rapid conclusion of the current zig zag….
What is your near term (intraday) target to the downside?
I am expecting a tag of the lower boundary line of a possible developing triangle and stay above 2430.
Markets are made up of many opinions. Mine is different here. I see this market pretty clearly moving up to finish a 5 way up. If correct and the 4 wave bottom is in (likely IMO), and the 5 wave is the length of 1, it’s going to about 2471.7. If the 5 wave is the length of 3, it’s going to around 2477.0. Which, BTW, would FILL THE GAP sitting above us, lest we have forgotten it. I’ll know I’m wrong if 2460 is taken out to the downside before price cracks the swing high at 2467.5. The latter, and my confidence in a final 5 wave soars.
Check out the market structure on hourly bars Aug 17 – 28 (middle of the day). Compare to Sept 5 to right now. We are going through a 1/2 size version of a very similar sequence of price action. If it continues (?!), we’d see a blast to the up side tomorrow or Monday, perhaps launched again with an opening gap down.
But if it’s finishing a five up, how can you reconcile the overlap between 4 and 1?
It is the move back below 2,454.77 that indicated the last wave up to the last high was a three, and was complete. Most likely.
The trading desks of the big banks have traders and funds dedicated to “spiking” the price of dead-man-walking stocks. These ambush traders have a pretty good idea of where stops are placed by traders short these stocks, and the ambush of positions can go on for weeks at a time. For traders who are short these stocks and do not understand what is happening it can be a quite frustrating process to get stopped out of short positions, only to see the down-trend resume after the ambush. Option traders have a distinct advantage in dealing with this particular tactic as it presents an opportunity to lower cost basis on option contracts while the counter-trend rally is underway. Clearly it is also critical to be holding contracts far enough into the future to withstand the assault. Another effective tactic is to roll the option position at a small cost farther out to allow the position more time to pay off. We are currently seeing a classic example of this maneuver in stocks like CBI, AN and KSS. They have all seen significant counter trend rallies recently which in no way changes their ultimate fate. Just so you know…. 🙂
Excellent insight and advice, thank you very much Verne for sharing 🙂
Most welcome! 🙂
If a 5 wave kicks off here in the final hours, I expect finance, which has taken it on the chin today, will kick off with it. GS in particular looks really good to me, and I’m long there with a very tight stop.
Although the trend is being fiercely resisted, it nonetheless is clearly down. What is likely to happen here with this silly attempt to erect a dam against the wave down is that the dam is going to suddenly give way…
I would expect so. And yes the short term action is down, but if it’s a 4 wave, to be expected. There there GS, a finance sector leader, now looking like a giant bear flag, to your point! One additional data point: I see QQQ clearly in an uptrend lasting several days, and the down action today a simple abc pullback, indicating it’s going next to the 1.27% extension of it’s prior up move.
The financial sector is toast; to it can be added retail, automotive (ignore the lying analysts recent upgrade), and thanks to recent events, insurers. For those bored with the daily market gyrations, a few well chosen puts 18 months out should do quite nicely!
I can count 3 waves up overall on this up move (including the 5 waves of the 3), making this sideways/down action a 4. So here’s one possible model, anyway. Beware, shorts. Chart posted…
Chart…
What time frame is this chart? Almost looks like 10 min?
top left, 10 min. yes.
Special way to view these images on PC? Google Chrome doesn’t allow me to click or enlarge them when they are in the comments.
I’m on a Mac and I use Safari.
So this advice may not work for you.
I open the chart in a new tab, on that tab I control + to enlarge
The ADX line on the SPX 5 minute chart showed growing divergence between the late afternoon succession of higher highs price and the sequence of lower and yet lower ADX readings. Add on a probable gap down opening, and I’m comfortable being short going into tomorrow. Time to zag!
Bullish symmetry (largest downmove during the upmove) is rather large and will be busted if/when price breaks about 2461.6. Price just now breaking all the short term trend lines. I won’t consider the up move truly over until the b.s. is broken though. (may be busted by the time this is posted…)
Two day head/shoulders top in SPX?? Or…triangle forming here?? All markets churning. Ain’t we got fun! If it breaks down through the H/S neckline, the old measuring rule (neckline to high, project downward from neckline) says its going to 2452-ish, which happens to be a 76% fibo retracement price too.
If a triangle completes here (looking more and more likely), price should bust UP out of it. Minimal target as I see it is the 76.4% fibo at 2472.43. If THAT gets busted, to quote John Carter, “almost every time price moves to the 1.27% external extension”. That would be about…2487.9. In other words, a test of the ATH. So heads up.
two in a row for the doc