
A downwards swing was expected to begin the week. This is exactly what has happened.
Summary: With the last wave up now looking very much like a three, have some confidence that primary wave 4 is underway. Look for price to move either sideways or lower with a lot of overlapping choppy movement for a few weeks.
In the short term, look for the bounce to end about 2,467 and then another small wave down. Price should not move above 2,480.38 tomorrow.
Last monthly and weekly charts are here. Last historic analysis video is here.
ELLIOTT WAVE COUNT
WEEKLY CHART
Click chart to enlarge.
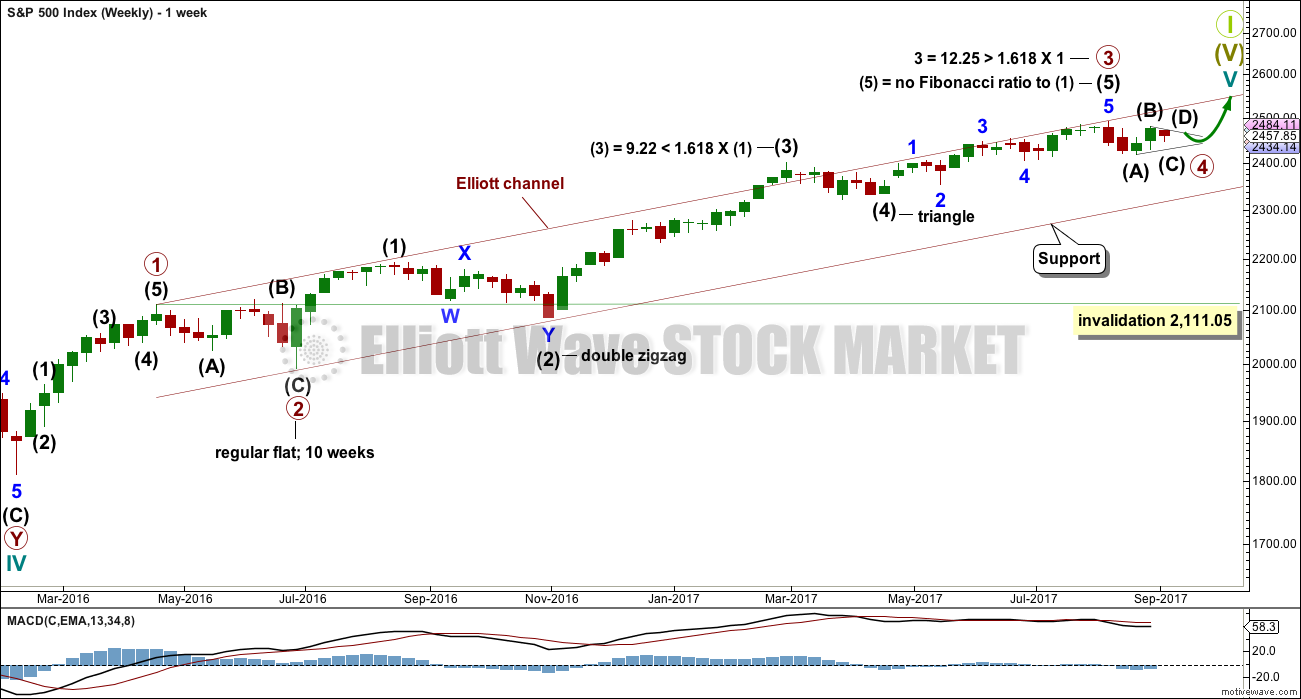
Primary wave 3 now looks complete. Further and substantial confidence may be had if price makes a new low below 2,405.70, which is the start of minor wave 5 within intermediate wave (5). A new low below 2,405.70 may not be a second wave correction within an extending fifth wave, so at that stage the final fifth wave must be over. Fibonacci ratios are calculated at primary and intermediate degree. If primary wave 3 is complete, then it still exhibits the most common Fibonacci ratio to primary wave 1.
Primary wave 4 may not move into primary wave 1 price territory below 2,111.05.
Primary wave 4 should last about 8 weeks minimum for it to have reasonable proportion with primary wave 2. It is the proportion between corrective waves which give a wave count the right look. Primary wave 4 may last 13 or even 21 weeks if it is a triangle or combination. So far it may have just begun its fourth week.
If primary wave 4 unfolds as a single or double zigzag, then it may find support about the lower edge of the maroon Elliott channel. If it is a triangle or combination, it may be more shallow, ending about mid way within the channel.
At this stage, the analysis gets complicated because there are several possible structures that primary wave 4 may be. The ideas for a triangle, combination, double zigzag, and single zigzag will be separated out into different daily charts in order for members to have a clearer picture of how price may behave for each. It is still impossible for me to tell you with any level of confidence which structure primary wave 4 may take, so all possibilities must be considered. I can only say that a single or double zigzag, or a triangle, would be most likely to exhibit good alternation with the flat correction of primary wave 2.
The final target for Grand Super Cycle wave I to end is at 2,500 where cycle wave V would reach equality in length with cycle wave I. If price reaches the target at 2,500 and either the structure is incomplete or price keeps rising, then the next target would be the next Fibonacci ratio in the sequence between cycle waves I and V. At 2,926 cycle wave V would reach 1.618 the length of cycle wave I.
DAILY CHART – TRIANGLE
Click chart to enlarge.
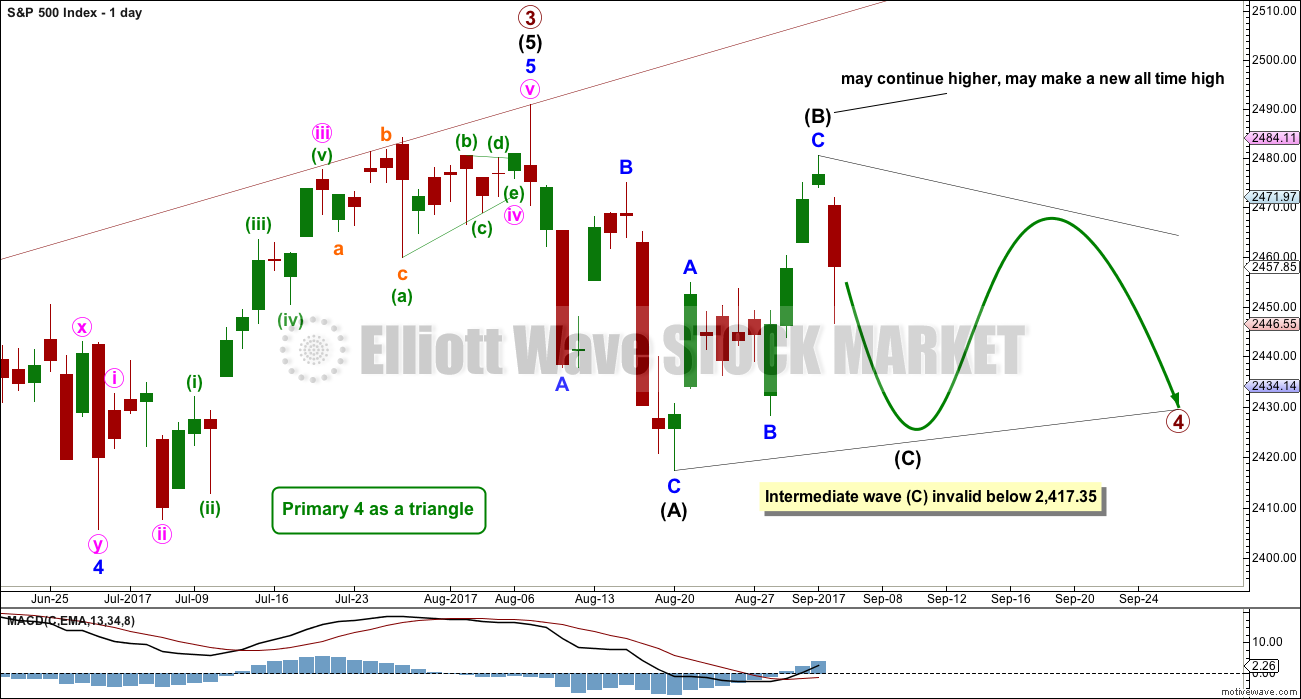
This first daily chart will illustrate how price might move if primary wave 4 unfolds as a triangle.
Intermediate wave (B) may possibly be complete at Friday’s high. If it is complete there’ then it would be a 0.86 length of intermediate wave (A), which is very close to the common range for triangle subwaves of about 0.8 to 0.85.
It is still possible that intermediate wave (B) may continue higher as a double zigzag. One of the five sub-waves of a triangle should be a more complicated multiple; most commonly that is wave C, but it may be any sub-wave. If intermediate wave (B) does continue higher, it may make a new all time high as in a running triangle.
The triangle may still last a total of at least eight weeks, and possibly longer.
Both intermediate waves (A) and (B) look like three wave structures.
If intermediate wave (B) is over, then intermediate wave (C) may be more complicated and time consuming than either of intermediate waves (A) or (B). Intermediate wave (C) may not move beyond the end of intermediate wave (A).
DAILY CHART – COMBINATION
Click chart to enlarge.
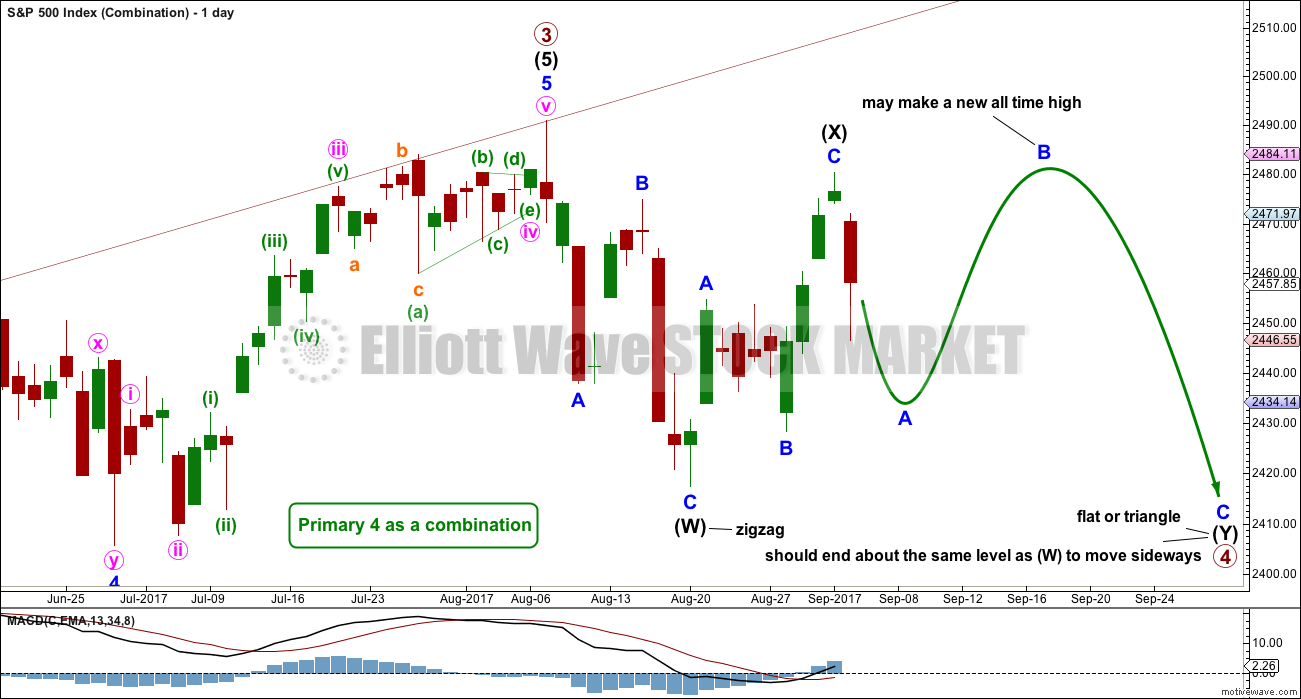
A combination for primary wave 4 would still offer some alternation with the regular flat of primary wave 2. Whenever a triangle is considered, always consider a combination alongside it. Very often what looks like a triangle may be unfolding or may even look complete, only for the correction to morph into a combination.
There may only be one zigzag within W, Y and Z of a combination (otherwise the structure is a double zigzag, which is very different and is considered below). At this stage, that would be intermediate wave (W), which is complete.
Combinations are big sideways movements. To achieve a sideways look their X waves are usually deep (and often also time consuming) and the Y wave ends close to the same level as wave W.
Here, intermediate wave (X) is very deep.
Intermediate wave (Y) may be a flat correction or a triangle. Within intermediate wave (Y), minor wave B may make a new high above the start of minor wave A as in an expanded flat or running triangle; this may include a new all time high. There is no upper invalidation point for a combination.
While intermediate wave (Y) may be a triangle, it is much more likely to be a flat correction. The combination of one zigzag and one flat within a combination is the most common by a very wide margin. A flat correction should be expected for intermediate wave (Y).
Within a flat correction, minor wave A must subdivide as a three, most often a zigzag and minor wave B must then retrace a minimum 0.9 length of minor wave A. Thereafter, minor wave C should move below the end of minor wave A. This structure may take another two or so weeks to complete.
DAILY CHART – DOUBLE ZIGZAG
Click chart to enlarge.
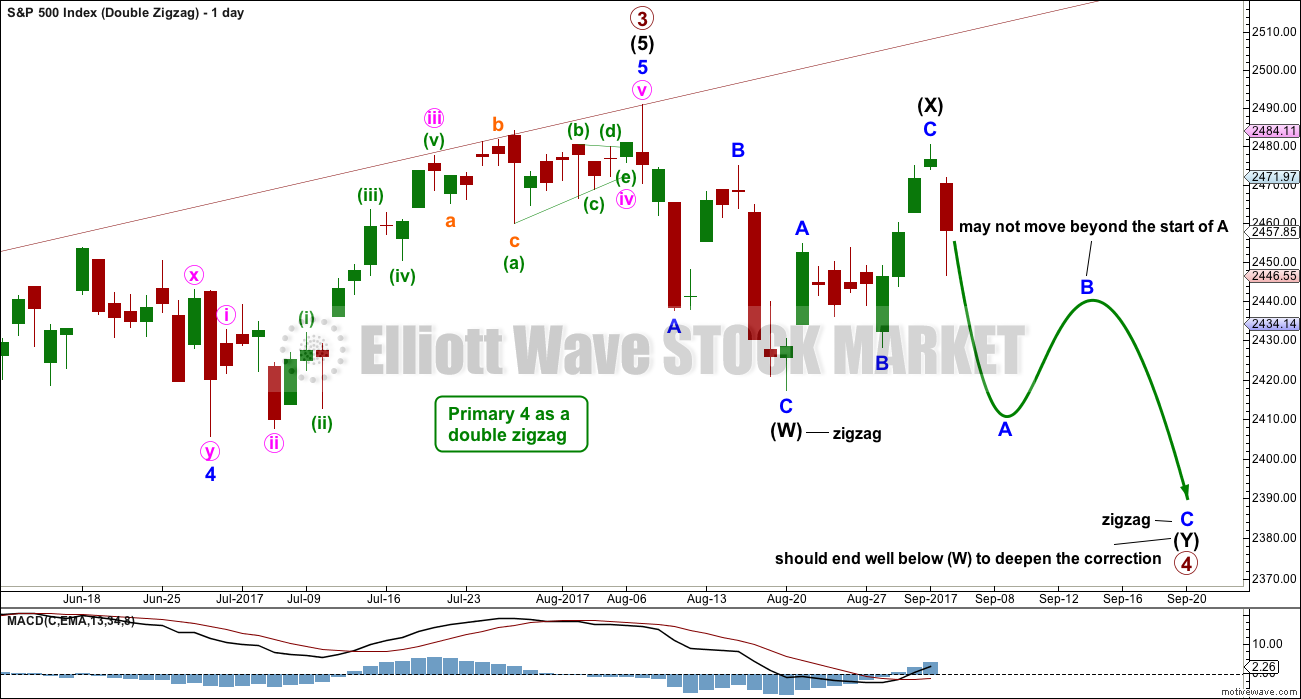
While combinations and double zigzags are both labelled W-X-Y, they are very different structures.
Double zigzags (and very rare triples) belong to the zigzag family of corrections. Combinations are more closely related to flats (these are sideways movements). Double zigzags have a strong slope, as do single zigzags. The second zigzag exists when the first zigzag does not move price deep enough; its purpose is to deepen the correction.
To achieve a strong slope the X waves of double zigzags (and the very rare triple zigzags) are almost always brief and shallow. Here, intermediate wave (X) is neither brief nor shallow reducing the probability of this wave count.
Within the second zigzag, minor wave B may not move beyond the start of minor wave A.
It would still be possible for this wave count for primary wave 4 to end about the lower edge of the maroon channel on the weekly chart.
HOURLY CHART
Click chart to enlarge.
This hourly chart will suffice for all three daily charts above. All three daily charts see the last low as the end of a zigzag, either for intermediate wave (A) or (W). All three daily charts see the last upwards movement as a complete zigzag for intermediate wave (B) or (X).
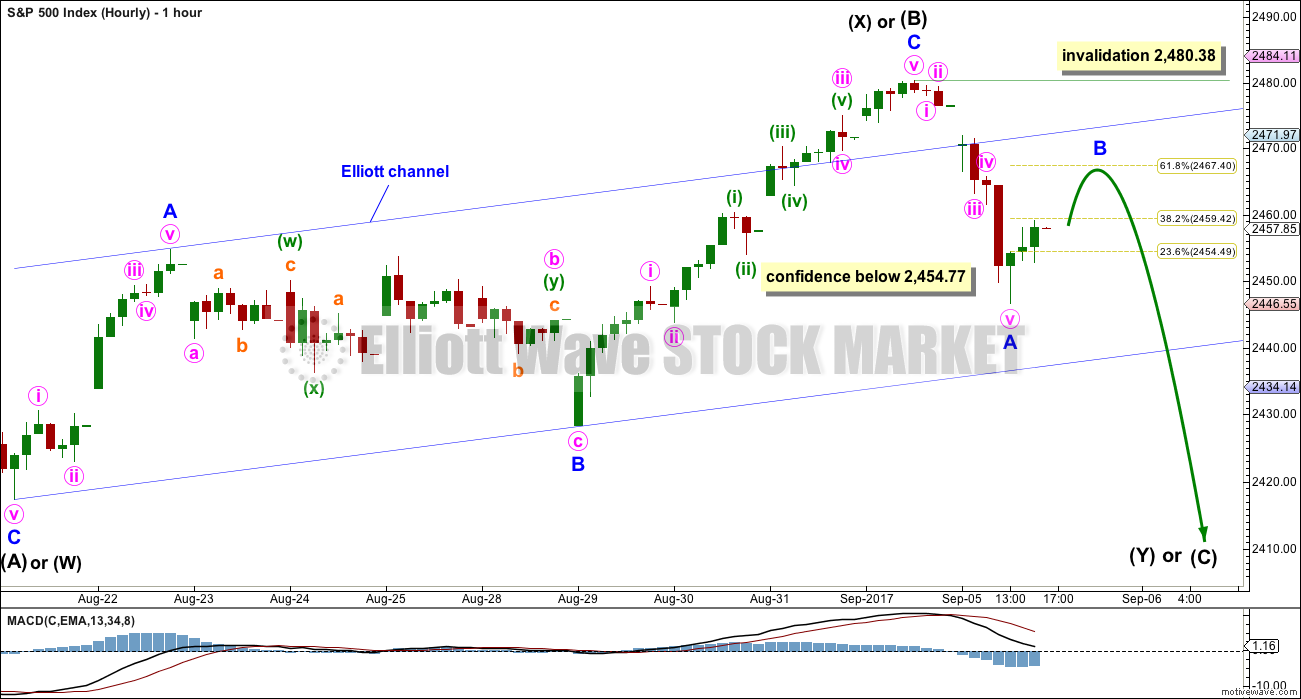
The zigzag upwards for intermediate wave (B) or (X) now looks to be over. Importantly, price has made a new low below 2,454.77 during this session. This downwards movement today cannot be a fourth wave of an impulse continuing higher, because it is now overlapping into what would be its counterpart first wave price territory. The last upwards wave labelled intermediate wave (B) or (X) is now complete and is probably a three.
With a three down (labelled intermediate wave (A) or (W) ), and now a three up complete, some reasonable confidence may be had that this market is in a larger correction which is incomplete.
On the five minute chart level, the wave down today labelled minor wave A fits well as a five wave impulse. The bounce at the end of this session may be minor wave B. It is possible it could be over at the close, but the long lower wick on today’s candlestick is bullish. So it seems more likely that minor wave B may move higher tomorrow and may end close to the 0.618 Fibonacci ratio of minor wave A about 2,467.
Thereafter, minor wave C downwards should move below the end of minor wave A.
How low the next wave goes should offer some clues as to the larger structure of primary wave 4.
ALTERNATE WAVE COUNT
DAILY CHART
Click chart to enlarge.
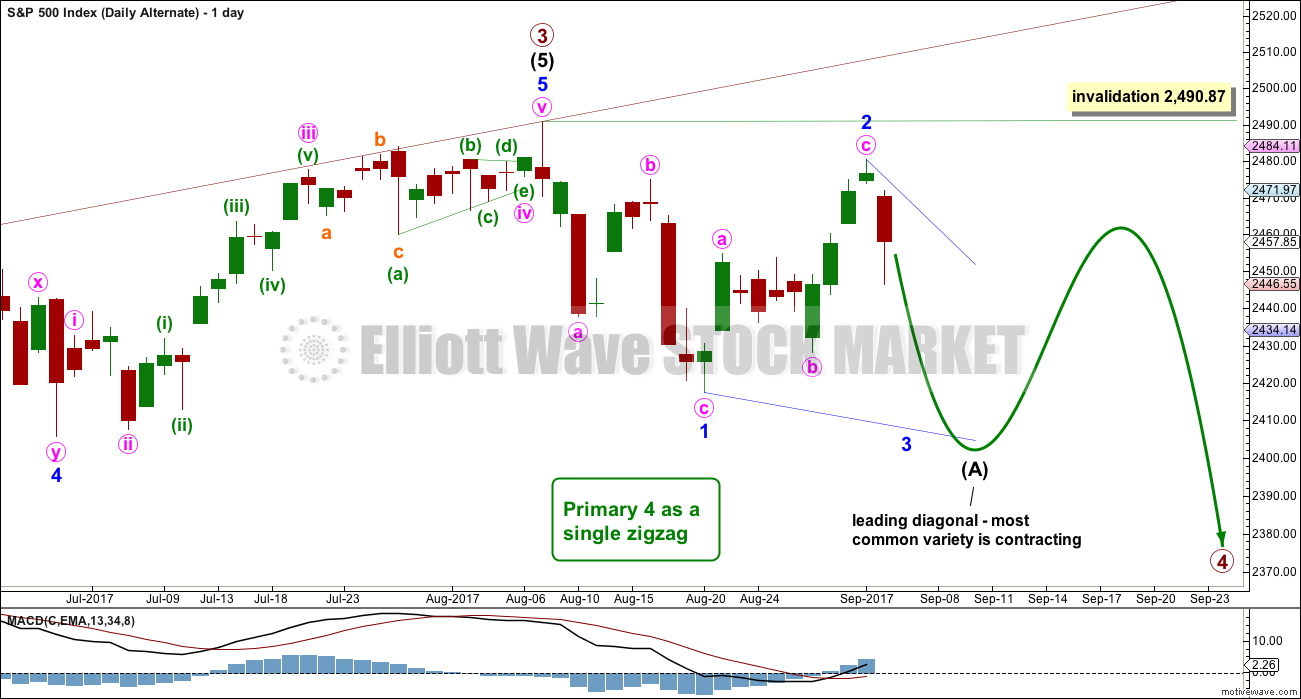
The first three daily charts all consider the possibility that the first wave down was a complete three. This alternate considers the possibility that a five down is still underway.
If intermediate wave (A) is an incomplete five down, then the larger correction for primary wave 4 would be a single zigzag.
Intermediate wave (A) may not now be an impulse, because the first wave down is clearly a three and not a five. It may be a leading diagonal.
Leading diagonals have sub-waves one, three and five that most commonly subdivide as zigzags, although they may also be impulses.
Within diagonals, the second and fourth waves must be zigzags and are commonly from 0.66 to 0.81 the length of the prior wave. Here, minor wave 2 would now be 0.86 the length of minor wave 1, not too much deeper than the common length.
Minor wave 3 must make a new low below the end of minor wave 1 below 2,417.35. It would most likely be shorter than minor wave 1, which was 73.52 points in length, as contracting diagonals are the most common variety.
Minor wave 2 may not move beyond the start of minor wave 1 above 2,490.87.
HOURLY CHART
Click chart to enlarge.
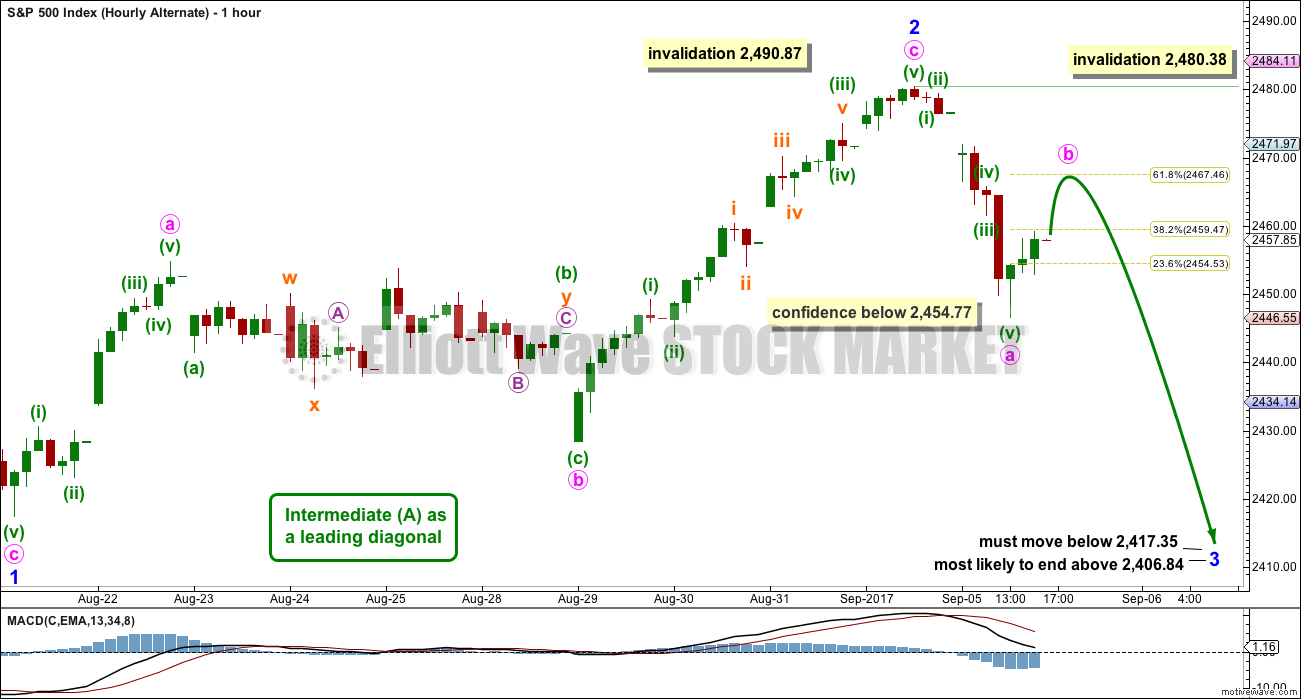
Subdivisions at the hourly chart level are the same for all wave counts. Only the degree of labelling and the larger structure differ. All wave counts see a zigzag complete downwards to the last low, and now a zigzag upwards complete.
The most common type of leading diagonal is a contracting variety. In a contracting diagonal the third wave should be shorter than the first wave and the fifth wave shorter still, so that the third wave is not the shortest. If this leading diagonal is contracting, then minor wave 3 must move below the end of minor wave 1 at 2,417.35, and must end above 2,406.84 to be shorter than minor wave 1.
TECHNICAL ANALYSIS
WEEKLY CHART
Click chart to enlarge. Chart courtesy of StockCharts.com.
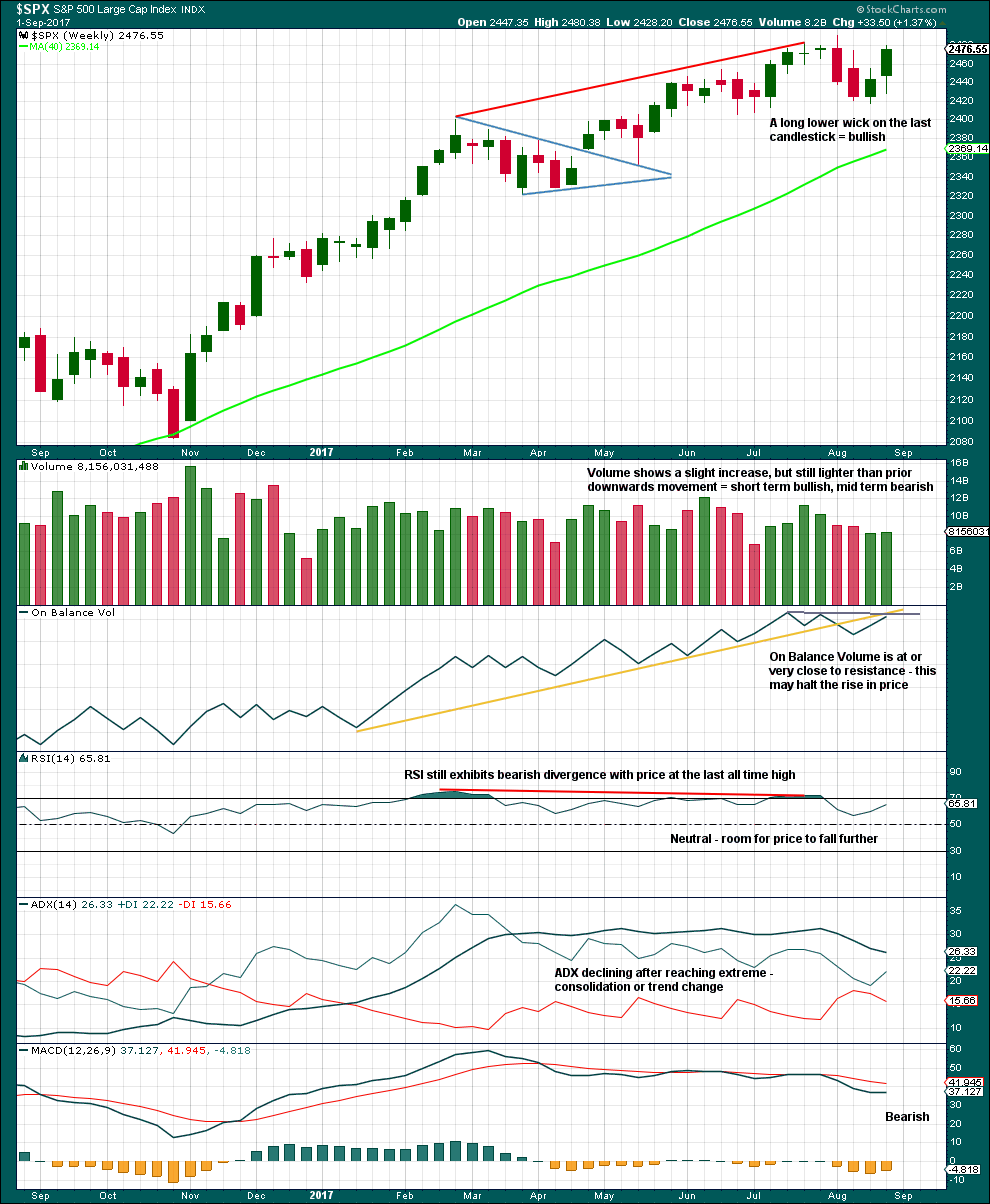
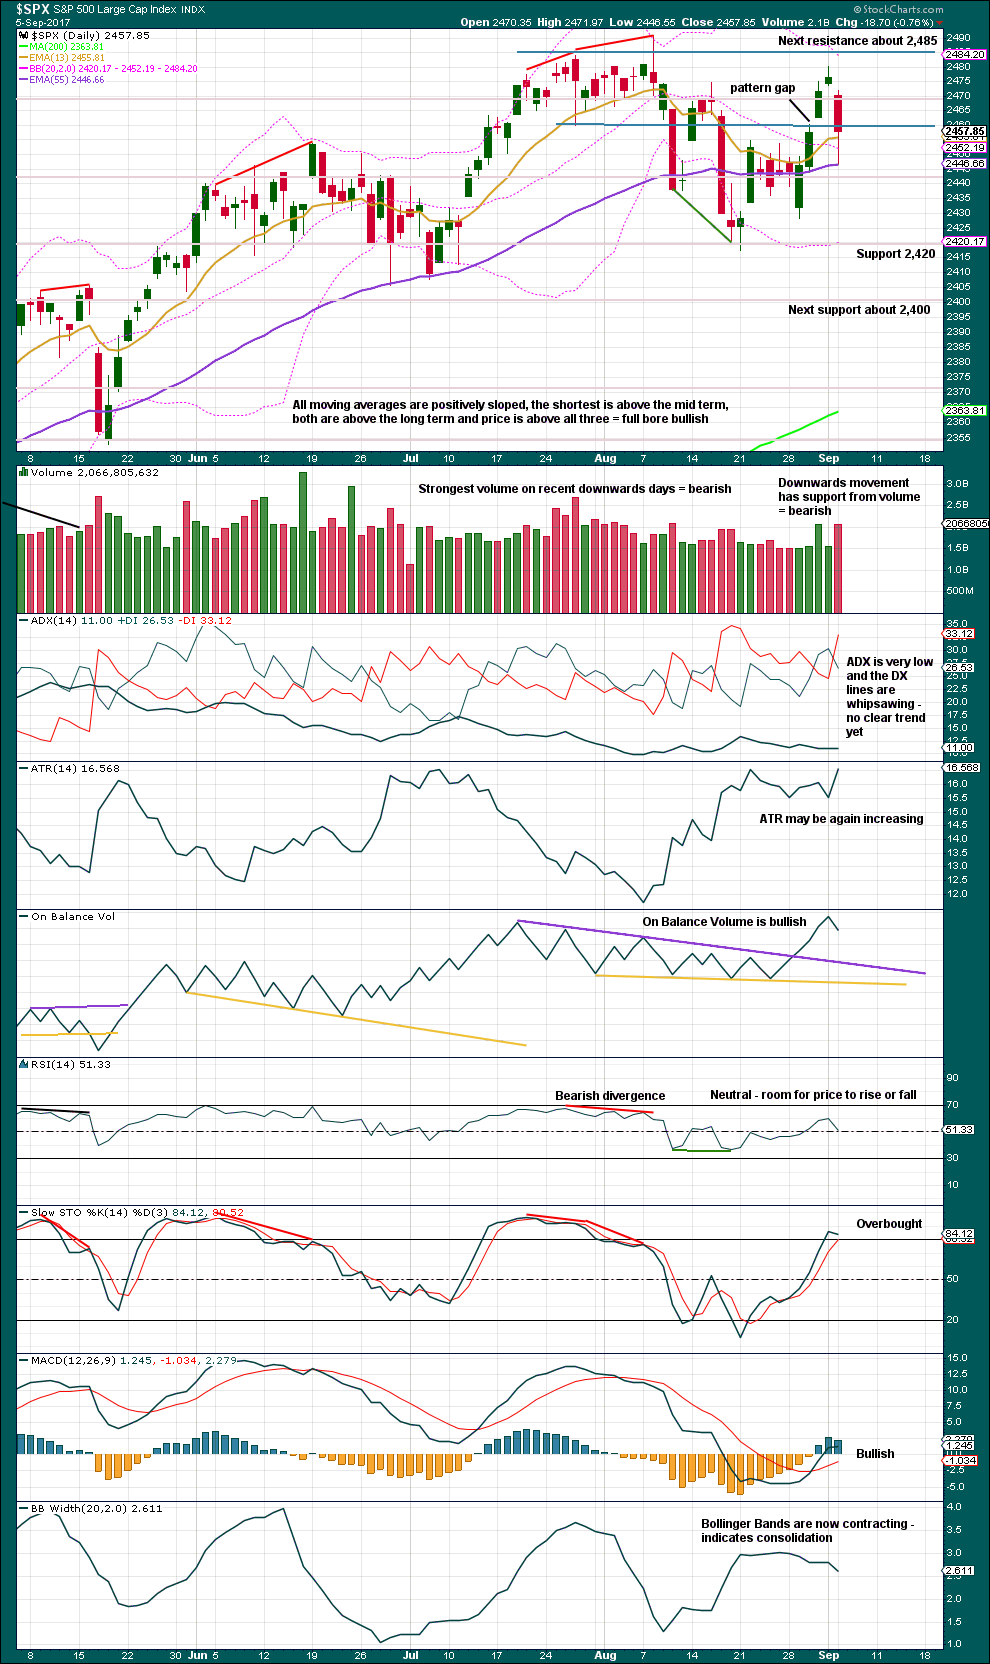
An upwards week has a long lower wick and slight support from volume. In the short term, it is entirely possible that this upwards movement is not over.
However, volume remains relatively light, relative to recent downwards weeks. There is still more support for downwards movement than upwards, so it still looks like a consolidation may be continuing.
Consolidations do not move in straight lines. Price whipsaws from support to resistance, and back again. At this stage, it looks like that is what price may still be doing.
ADX had been extreme for a long time and is now declining. The black ADX line is now declining but has not yet been pulled down below both directional lines, so the consolidation or pullback may be expected to continue.
DAILY CHART
Click chart to enlarge. Chart courtesy of StockCharts.com.
Only if an upwards breakout to a new all time high is seen, which very importantly should have support from volume, would the view that price is consolidating have to change.
ADX and Bollinger Bands all agree that so far it looks like price may still be consolidating. ATR today may be disagreeing because it looks now to be increasing. This may happen for larger corrections; downwards movement does tend to be more volatile and have greater range.
Price is nearing resistance and Stochastics is nearing overbought. Expect this upwards swing to end here or fairly soon. Stochastics may remain extreme and then develop divergence before price turns. There is a little room for price to rise further before it finds resistance.
For the short term, the long lower candlestick for Monday’s session indicates more upwards movement tomorrow. Look for strong resistance about 2,485. Strong volume for downwards movement indicates a downwards swing to support looks likely to have begun. These swings do not move in straight lines though; they are choppy and overlapping.
One of the best techniques for trading a consolidation is to use resistance and support along with Stochastics to indicate when price may turn. This is a high risk strategy though: price can overshoot resistance or support before turning, and Stochastics is useful but not as an exact technique for timing a turn. Losses can be large but should be few while profits may be many and small. Only the most experienced traders should attempt it.
It is absolutely essential that good risk management and money management techniques are used. Anyone trading a consolidation without using stops is inviting financial losses.
Please use my two Golden Rules of risk management: always use a stop and invest only 1-5% of equity on any one trade.
VOLATILITY – INVERTED VIX CHART
Click chart to enlarge. Chart courtesy of StockCharts.com.
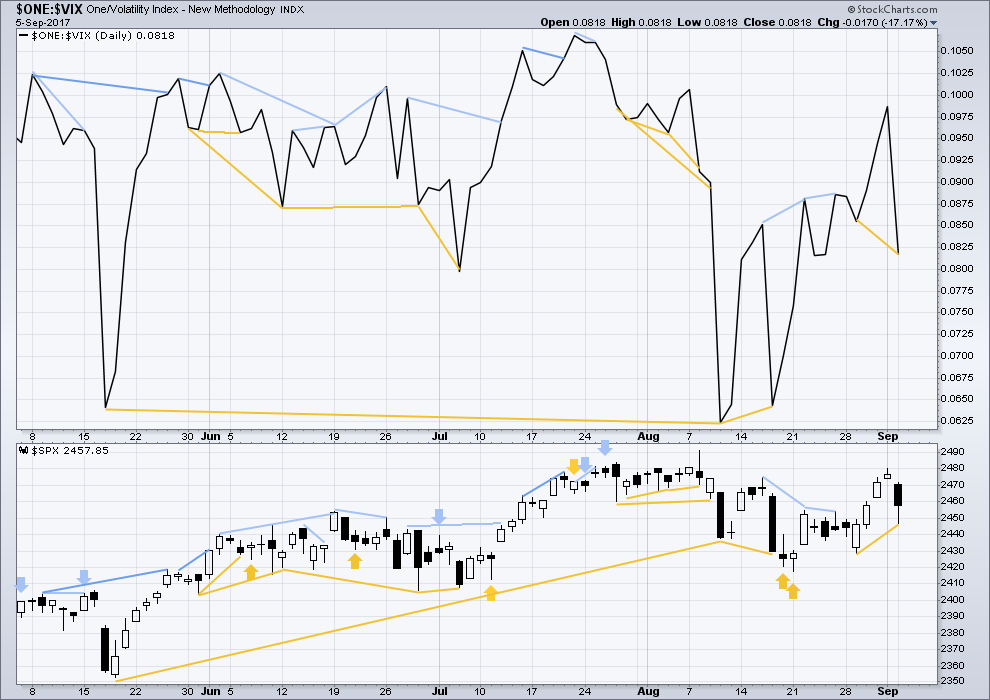
Normally, volatility should decline as price moves higher and increase as price moves lower. This means that normally inverted VIX should move in the same direction as price.
There is new bullish divergence today between price and inverted VIX: inverted VIX has made a new short term low, but price has not. This indicates weakness within price movement today. It may be followed by one or two upwards days to be resolved. This supports the idea of the bounce, which began at the end of this session, to continue into tomorrow.
BREADTH – AD LINE
Click chart to enlarge. Chart courtesy of StockCharts.com.
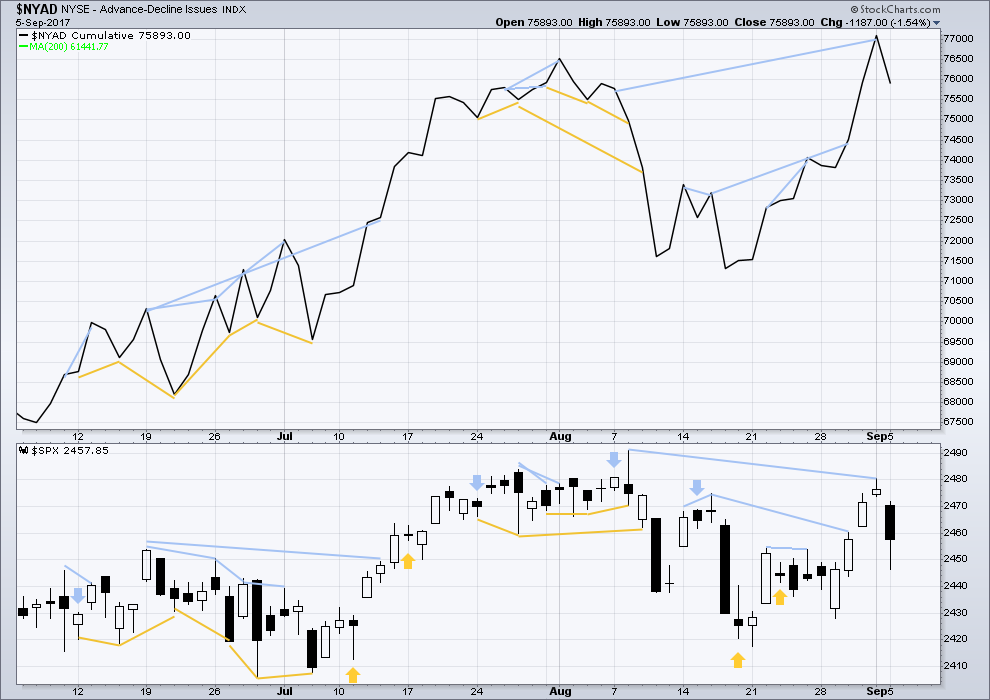
With the last all time high for price, the AD line also made a new all time high. Up to the last high for price there was support from rising market breadth.
There is normally 4-6 months divergence between price and market breadth prior to a full fledged bear market. This has been so for all major bear markets within the last 90 odd years. With no divergence yet at this point, any decline in price should be expected to be a pullback within an ongoing bull market and not necessarily the start of a bear market.
Hidden bearish divergence between price and the AD line noted in last analysis has now been followed by a reasonably strong downwards day. It may be now resolved, or it may yet be followed by another downwards day.
There is no new divergence today between price and the AD line.
DOW THEORY
The S&P500, DJIA, DJT and Nasdaq have all made new all time highs recently.
Modified Dow Theory (adding in technology as a barometer of our modern economy) sees all indices confirming the ongoing bull market.
The following lows need to be exceeded for Dow Theory to confirm the end of the bull market and a change to a bear market:
DJIA: 17,883.56.
DJT: 7,029.41.
S&P500: 2,083.79.
Nasdaq: 5,034.41.
Charts showing each prior major swing low used for Dow Theory are here.
Published @ 07:24 p.m. EST.
In Evanston today visiting my daughter at NU.
Good day for dead cat bounce!
I’m getting rather nervous about this upward move. It looks a lot more broad and has more support from volume than it should if it is assumed to be a corrective B wave. The retracement is still hovering around the 0.618 fib level but the wave is extending too far in time. What is the verdict? Is the wave count wrong or is wave C still to come?
I think we will know by tomorrow morning!
Yea, when the markets finally accept that the US has another $200B in storm damage costs coming with hurricane IRMA soon to wipe Florida, and realize that this is just going to continue over, and over, and over…maybe they’ll start selling off. Or not. The market can climb a wall of worry, and be quite irrational for extended periods of time. That all said, I’m short, I’m in the red, and I’m not overly worried (yet).
Tim Knight recently opined that even if a NUKE went off, the market would go up… 🙂
No need for oubt folk, trend is clearly down. Trade accordingly!
I agree with Kevin, the bounce looks weak. So far.
The gap from yesterday may provide resistance, it may not be filled, if it’s a breakaway gap.
Nice fade into close….
One of my perceptual filters on market action is the nature of moves up. This one in SPX is what I view as a “sharp bounce”, meaning, it’s immediately after a quite large and high momentum downmove. In between, zero time spent “backing and filling”. Sharp bounces are often just that, bounces, without real power. Real power usually takes some consolidation (“backing and filling” is what Larry Williams calls it), such as the 4 days prior to the Aug 27-Sept 1 run up. Ergo, I’m not buying this bounce, and view it as an opportunity to add to my short position, when it appears to be over.
SPX has just about tagged the 61.8% retrace of the entire downmove, and it definitely is a “decision point” for the market. (may be blown through by the time this is posted…). I believe a “likely” scenario is an ABC down with this leg being the B, and this would be likely place for it to end and start C.
So far the 61.8% retrace is holding and the general direction seems to be down, and the gap just about filled. If this is a (completed) B of an ABC down, the lengths of A, B and C should have fibo relationships. When I look at the length of A being 61.8% of a total move down, I see that B back up ended exactly at the 23.6% (a fibo %) of the total move down, which tells me this projection just might be right (as internal fibo geometries are there). And with that I have a target for the end of the C wave: 2425.7. Could be wildly wrong of course, but it’s something to do while waiting for this market to fall more!!
Just to be crystal here, the ABC I’m referring to is (would be) minor wave A in the combination alternative laid out by Lara, of which she said “Within a flat correction, minor wave A must subdivide as a three, most often a zigzag”.
SPX pushed slightly through the 61.8% fibo, but that allowed QQQ to hit a perfect intra-day double top itself. Overall, I view this action as pretty darn weak after yesterday’s sell-off. If SPX comes back below the last significant swing low on the 5 minute (about 2465.5) I’ll be viewing this B wave of the likely zigzag minor A down as potentially complete, and consider a short add at a decent pullback and renewed thrust downward point. On the other hand, if we quickly get yet new daily highs, it’s probably going to around the 2472.3 level before (possibly) turning (the 76.4% retrace fibo).
It will be profoundly probative of the bears’ intention when we see what happens the fourth time the DJI meets its 50 day SMA. After breaches in SPX and Nasdaq Comp, incredible buying power expended to reclaim it it those indices. There is an air of desperation about the buying so we could be revving up for a decisive break in all three which could give some indication of what P4 is shaping up to be.
The new banner this month is from Gisborne, town beach.
I’m a Firefox user (version 55.03 at the moment), and it’s only showing up as a thin blue water line. On IE however, I see the entire banner (nice!!).
thanks for letting us know Kevin, I’ll ask Cesar to fix
Nice offshores!! Go one good backhand shack this am for you Lara.
🙂 awesome!
Ron the 2nd here.
hello, its doc here…
Does that mean I get to be the dreaded “T” word Doc…?